Sample Category Title
CADCHF Wave Analysis
CADCHF: ⬇️ Sell
- CADCHF reversed from pivotal resistance level 0.6050
- Likely to fall to support level 0.5935
CADCHF currency pair recently reversed from the resistance zone between the pivotal resistance level 0.6050 (former monthly low from March) and the 50% Fibonacci correction of the downward impulse from the start of April.
The downward reversal from resistance level 0.6050 continues the active impulse wave iii of the intermediate impulse wave (3) from the end of November.
Given the clear daily downtrend and the strongly bullish Swiss franc sentiment seen today, CADCHF currency pair can be expected to fall to the next support level 0.5935.

Gold (XAU/USD) Grinds Above $3000/oz. Are Bulls Ready to Take Charge?
- Gold (XAU/USD) is trading above $3000/oz, facing resistance but showing bullish signals.
- Tariff developments and US President Trump's comments are key drivers of market sentiment and gold prices.
- Gold ETF flows were strong in Q1 2025, with a record $21 billion inflow, but April data will be crucial.
- Technical analysis indicates key support levels at 3000, 2982, and 2950, and resistance at 3025 and 3050.
Gold prices have been on a grind higher this morning but apprehension and caution are still evident across financial markets. Gold's decline after President Trump's ‘liberation day’ tariffs were announced did come as a surprise to many but I for one had feared that a lot of the tariff risk had been priced in.
If I am honest however, I did not see such a sharp selloff even if markets had already priced in the tariff announcement. Since the drop, Gold's attempts at a recovery have been met with persistent selling pressure.
There does seem to be a disconnect between Gold and historical trends or price drivers. What I mean by this is that Gold is usually sensitive to moves by the US Dollar, however over the past 12-18 this was not the case. This has continued now with the tariff announcement as traditional safe havens like the CHF and JPY benefitted while what I would consider the most traditional safe haven, Gold struggled.
The factors for this could be endless but today we are seeing a similar story. Comments from US President Donald Trump have helped spur on risk assets as the US President spoke about making tariff deals. President Trump said that a delegation from South Korea is on its way and that he is waiting for China who in his words said ‘China also wants to make a deal, badly’.
This has given risk assets a boost but at the same time Gold has also enjoyed a largely positive day thus far. Tariffs risks no donut persist, but for the time being sentiment does seem to have improved.
Gold ETF March report; Flows were high but April data will be more intriguing
Gold ETF flows have been discussed in a few of my articles of late, with the World Gold Council releasing the March report earlier in the day. I did not expect too many surprises though as tariff announcements came out in April. The next issue should give us more insights on that and how Gold ETF flows fared in the days after the tariff announcement.
When it comes to March and Q1 as a whole, ETF flows were strong.
Gold-backed ETFs saw a strong $8.6 billion inflow in March, pushing total Q1 inflows to $21 billion (226 tons). This was the second-largest quarterly inflow in dollar terms, just behind Q2 2020's $24 billion (433 tons). North America and Europe made up 83% of these inflows, with 61% and 22% shares, respectively. Asia contributed 16%, which is impressive considering it only holds 7% of global assets under management (AUM).
Europe’s Q1 inflows of $4.6 billion were its best since Q1 2020. With rising gold prices, global AUM hit a new record high of $345 billion, up 13% in March and 28% for the quarter. Collective gold holdings also grew by 92 tons in March, reaching 3,445 tons by the end of the month. This is the highest level since May 2023 and just 470 tons below the all-time record set in October 2020.
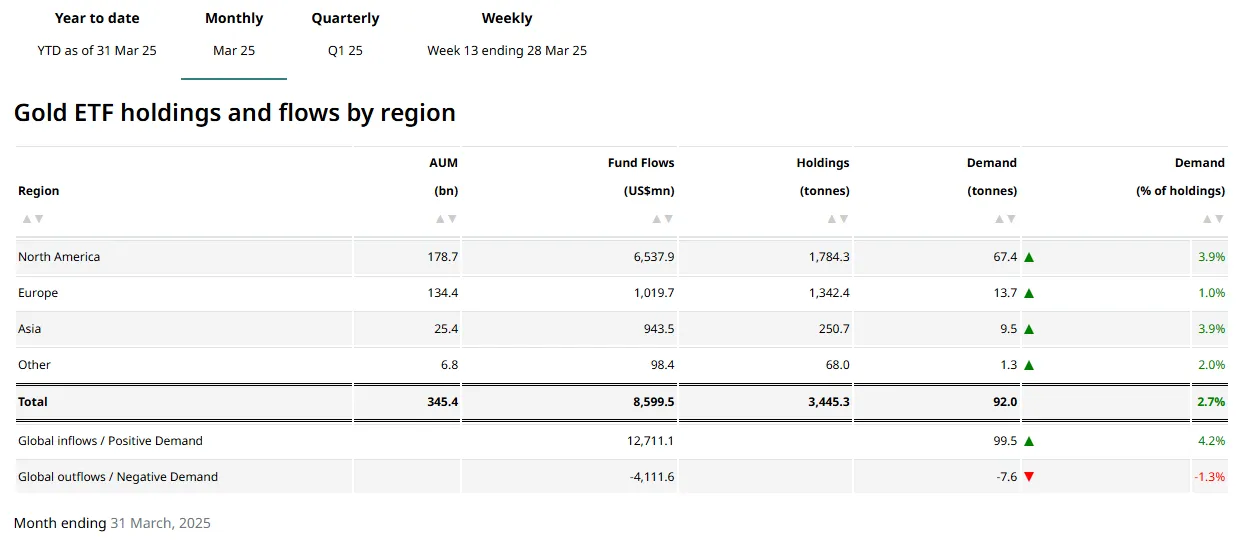
Source: World Gold Council
Given the selloff now in early April and depending where Gold ends the month, I will be very curious to gauge the data next month.
For now and the rest of the week, I expect tariff developments to be the main driving force of market sentiment and Gold as well.
Technical Analysis - Gold (XAU/USD)
From a technical analysis standpoint, Gold prices have edged their way higher since yesterday's lows at 2956.
The daily candle closed around the support level at 2982 before a bullish move in the Asian session leaves Gold trading 1% up for the day at the time of writing.
For now immediate resistance at 3025 has held firm with 3048/3050 the next key level to pay attention to.
The RSI period 14 on the daily timeframe is flashing a bullish signal as it crosses above the 50 neutral level which could hint at a shift in momentum. It will however depend on how the daily candle closes and see if it maintains the momentum and finishes above the 5o handle.
Today the 3000 psychological level has held firm and will need to form a base if bulls are to take control and revisit the early April highs.
If the 3000 handle gives way, 2982 and 2950 will catch my attention as potential areas of support.
Gold (XAU/USD) Daily Chart, April 8, 2025
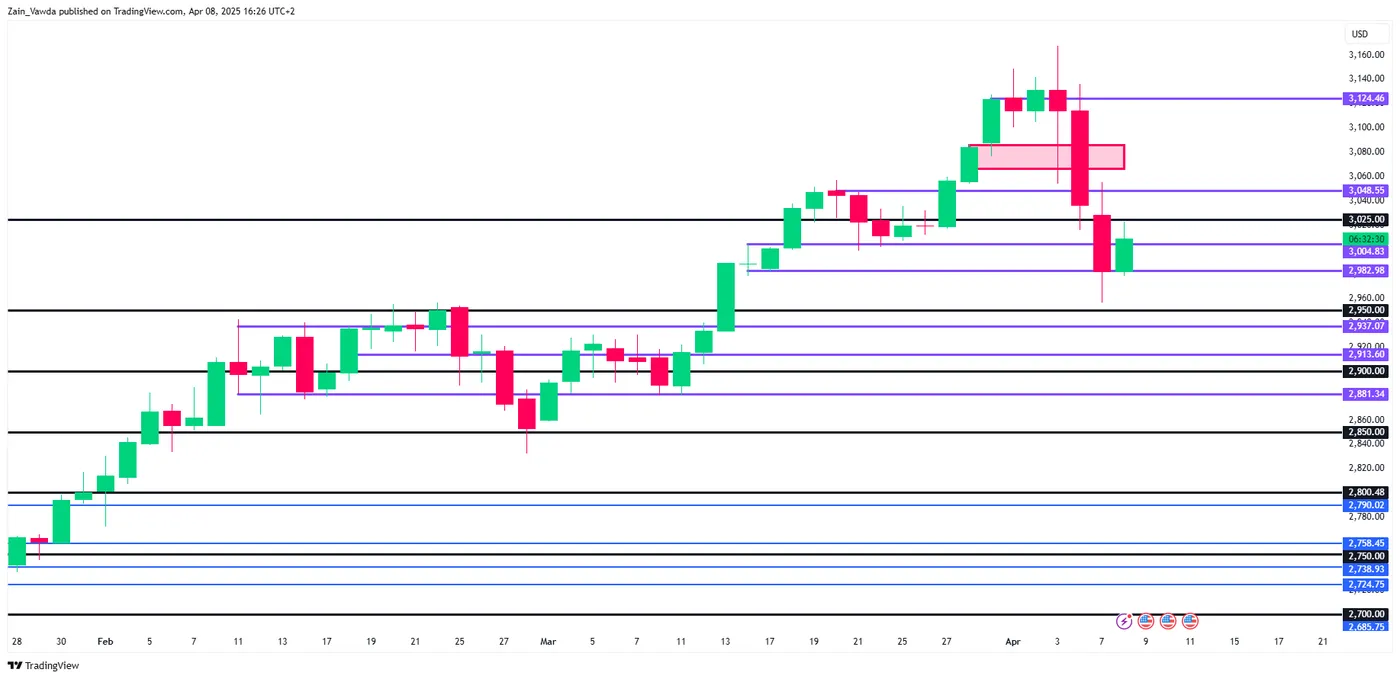
Source TradingView
Support
- 3000
- 2982
- 2950
Resistance
- 3025
- 3050
- 3075
New Zealand’s Central Bank Expected to Lower Rates by a Quarter-Point
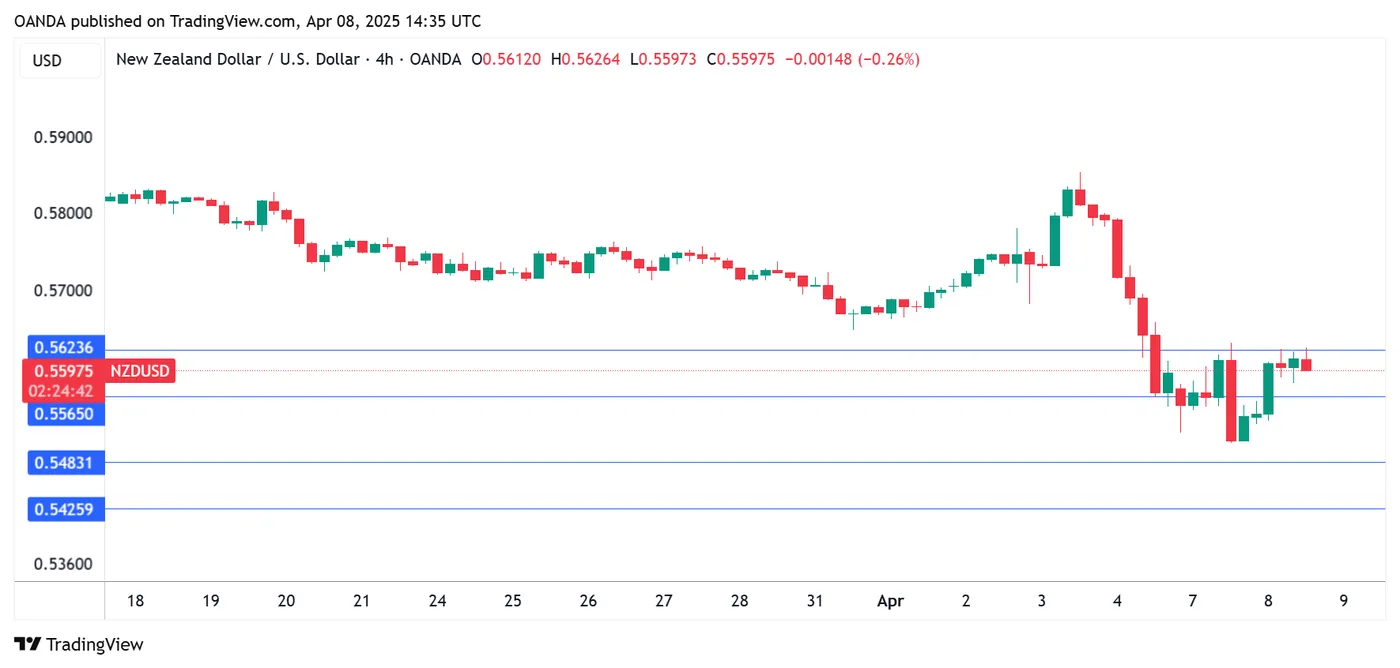
The New Zealand dollar has rebounded on Tuesday. NZD/USD is trading at 0.5615, up 1.3% on the day. This follows a 5% plunge over the past two days.
RBNZ widely expected to cut rates
The Reserve Bank of New Zealand is widely expected to lower interest rates by a quarter-point at its rate meeting on Wednesday. The markets have priced in a quarter-point cut at 75% and a jumbo half-point cut at 25%. The cash rate currently stands at 3.75%
The RBNZ slashed rates by a half-point in February, a response to weak economic growth and an inflation rate of around 2%, the midpoint of its target band.
The market meltdown and escalation in trade tensions due to new US tariffs could force the RBNZ to lower rates faster and deeper than previously expected. There is massive uncertainty in the air and the central bank will have to re-evaluate inflation and growth expectations, given the tariff turmoil.
There is growing talk of a global recession, which would badly hurt New Zealand's export-reliant economy. China is New Zealand's largest trade partner and the escalating trade tensions between the US and China could turn into a New Zealand nightmare. China has imposed 34% reciprocal tariffs on the US, drawing a threat from President Trump that he will counter with a 50% tariff if the Chinese tariff is not removed.
The RBNZ is dealing with the tariff crisis without Governor Adrian Orr, who suddenly resigned last month in the middle of his five-year term. The government has appointed Christian Hawkesby as Governor for a six-month term, after serving as the acting governor after Orr resigned.
NZD/USD Technical
- NZD/USD pushed above resistance at 0.5565 and tested resistance at 0.5623. The next resistance line is 0.5704
- 0.5484 and 0.5426 are providing support
Sunset Market Commentary
Markets
Core bonds lost ground today. Bunds underperformed US Treasuries, switching places with yesterday. The moves’ sizes differ from Monday too. The violent intraday swings back then made way for a steady and solid rise in German rates with gains varying between 4.4 and 9 bps in a bear flattening move. The jury’s still out, though, whether yesterday marked the low point (especially at the front) against the backdrop of the highly unpredictable trade narrative. ECB’s Simkus on the matter said that the US tariff announcement was much more disappointing than thought; Germany’s Nagel said it significantly worsened the global outlook and for VP de Guindos it represents a paradigm shift. The former hasn’t made up his mind for April yet but in any case ruled out the need to talk about a 50 bps cut. Money markets aren’t contemplating such a move either. Rates in the US add 3.4-7 bps across the curve. Comments from US Treasury Secretary Bessent helped somewhat by keeping the door for negotiations open (‘Tariffs will be a melting ice cube if [trade talks are] successful’) in the same vein as Japan’s push for trade talks this morning triggered a 6% rise in the Nikkei stock index. The 10-yr crawls back above the 4.2% support-turned-into resistance zone. Simply looking at the chart is baffling. In mere hours the most watched and traded 10-yr bond yield erased the 35 bps loss since Trump’s Liberation Day. Today’s gains included, it’s even as if nothing happened. Rising risk premia as a buffer for the huge uncertainty hold sway and are (at least partially) compensating for any growth-related downward pressures. European long-term yields enjoy a floor for similar reasons. Today’s eco calendar contained no major releases but we do look out for tonight’s 3-yr auction and even more tomorrow’s 10-yr and Thursday’s 30-yr sale. They’ll be closely watched for signs whether or not global investor appetite for US debt is already abating. FX markets are basically a mirror image of yesterday, when small and less liquid currencies were dumped and most majors including the dollar and the euro (as well as CHF for risk aversion reasons) gained. The US greenback today underperforms global peers, allowing EUR/USD even with a lackluster euro to eke out a small gain to 1.095. EUR/GBP briefly rose towards 0.86 before fatigue kicked in after the recent stellar rally. The pair currently hovers little changed around 0.856. GBP/USD does bounce back marginally from the 1.27 area to 1.277. The Aussie and kiwi dollar top the leader board while CHF is extending its recent bull run. China’s yuan closed at the weakest level since September 2023. This morning’s fixing suggests authorities are ready and willing to use the currency as a trade war tool. Stock markets trade firm in the green but that doesn’t compensate much for the sharp declines nor does it change the dire technical picture. The EuroStoxx50 adds about 3%, WS opens with similar gains.
News & Views
After elevated inflation figures in January and in February, March inflation in Hungary came in on the softer side of expectations. Prices were unchanged M/M with the Y/Y-measure declining from 5.6% to 4.7%. In its flash analysis, the central bank (MNB) indicated that while overall inflation stabilized M/M, core inflation still rose by 0.3% but slowed to 5.7% Y/Y. The measure ex indirect taxes slowed to 5.4% from 6.0%. CPI ex processed food eased to 5.3% from 5.9%. Still, sticky price inflation rose marginally from to 5.9%. The annual inflation of tradables rose 0.6% M/M to 2.6% Y/Y. The annual prices of market services eased to 8.6%, largely attributable to the unwinding of the effect of last year’s backward-looking repricing. Prices rose by 0.6% M/M, reflecting accommodation and catering services. Banking and telecommunications services fees remained broadly unchanged. Food price inflation decreased to 6.2%, partially affected by profit margin caps introduced mid-March. HUF 2-y swap yields today declined 9.0 bps after the release as markets again ponder the chances of the MNB further reducing the policy rate below 6.5% in the second half of this year and/or early next year. Of course, aside for the inflation development, this remains highly conditional on the performance of the forint, which weakened back above EUR/HUF 400 in recent risk-off move.
After easing on the European reflation trade last month, the Swiss franc currently again strengthens closer to the key EUR/CHF 0.92/0.93 support area (currently 0.935). At last month’s policy meeting, the SNB could be relatively confident that inflation could stabilize in the lower part of the 0.0%/2.0% inflation target range. Recent strengthening of the franc including its impact on inflation however might force the SNB again to consider FX interventions or easing the policy rate back to 0% or even back into negative territory (currently 0.25%).
Crypto: A More Subdued Decline, Not Yet a Reversal
Market Picture
The cryptocurrency market found its footing on Monday with the start of active trading in Europe. However, that rebound from the $2.37 trillion level to $2.55 trillion appears to be losing steam. Even at current levels, the decline over the past seven days is over 8%. Without reliable signs of a reversal in the stock markets, the upward momentum could quickly fade. It looks like we are not seeing a reversal but only a stabilisation of the decline.
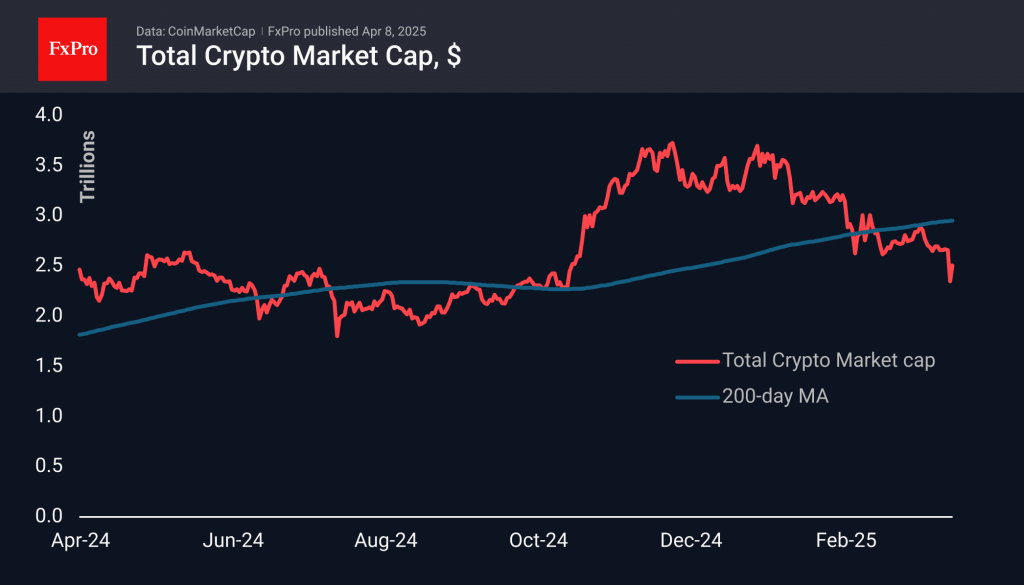
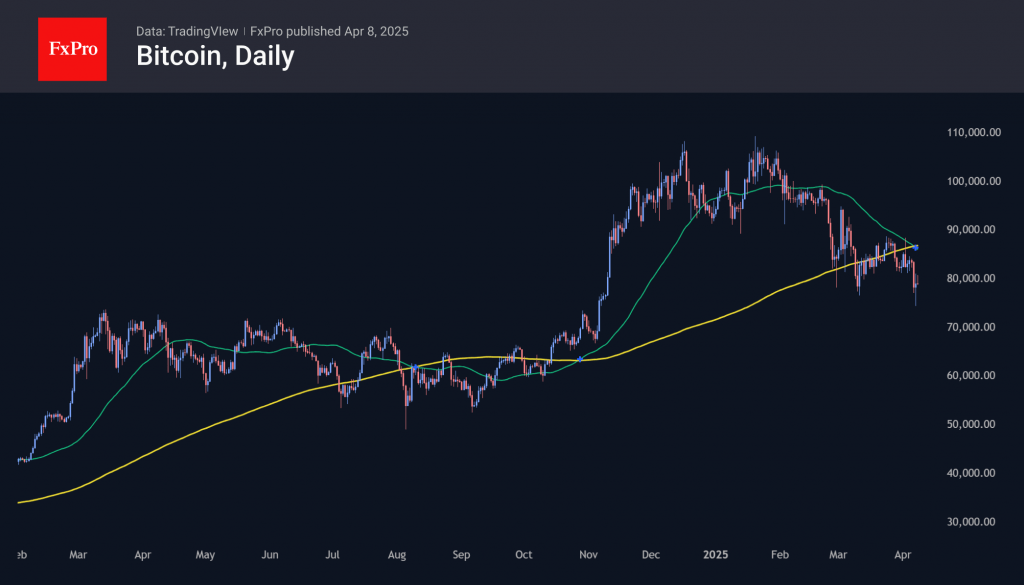
Bitcoin slipped below $75k at the start of the week, bouncing briefly above $80k on Monday and Tuesday. The technical picture for Bitcoin remains tragic. Earlier this month, a death cross formed when the 50-day average dipped below the 200-day. Last year, a similar signal had the opposite effect, recording a low a couple of days before the signal. But in the last couple of months, the downward trending 50-day has been acting as an effective resistance. In case of a market reversal, a consolidation above the 86k level, where it is now, would be an important signal of a break in the downtrend.
News background
According to CoinShares, global investments in crypto funds fell by $240 million last week after two weeks of inflows. Bitcoin investments decreased by $207 million, Ethereum by $38 million, Sui by $5 million, and Solana by $2 million, while XRP investments increased by $4.5 million and Toncoin by $1 million.
Coinshares suggests that the outflow of funds from cryptocurrencies is likely a response to recent news of US trade duties that pose a threat to economic growth.
Binance Research noted that macroeconomic factors like trade policy and rate expectations are increasingly driving cryptocurrency market behaviour, temporarily overshadowing underlying demand dynamics. Bitcoin’s correlation with traditional assets tends to rise during times of acute stress but weakens as conditions normalise.
Bitcoin’s hash rate surpassed the 1 ZH/s (zeta hash) mark for the first time in history. On 5 April, mining difficulty hit a record high (ATH) at 121.51 T. Meanwhile, the profitability of mining is under serious pressure due to falling BTC value and transaction fees.
Strategy company reported unrealised losses of $5.91 billion for Q1 2025.
US: Small Business Optimism Index Drops Again in March
The NFIB's Small Business Optimism Index fell 3.3 points to 97.4 in March, coming in below market expectations for a smaller decline to 99.0.
Seven out of ten subcomponents deteriorated on the month, with the remaining categories roughly unchanged. The largest declines came from the share of businesses expecting the economy to improve (down 16 points to 21%), those expecting higher real sales over the next 6 months (down 11 points to 3%), and those reporting higher earnings in the current quarter (down 4 points to -28%).
The net share of businesses planning to increase employment fell 3 points to 12%, while the share of firms with unfilled job openings rose 2 points to 40%. Quality of labor concerns were unchanged in March, with 19% of business owners identifying this as their top business problem.
The net share of firms currently increasing employee compensation rose 5 points to 38% - the highest level in 9 months - while the net share planning to do so over the next three months rose 1 point to 19%. The share of businesses 'raising' average selling prices fell 6 points to 26% while the share of those 'planning’ to raise average selling prices also rose 1 point to 30%.
Key Implications
Small business confidence has nearly fully retraced its post-election gain after falling for the past three months. Amid elevated uncertainty, expectations for the economy this year have deteriorated, weighing on the sales outlook and expansion plans. In addition, while concerns regarding inflation remain elevated relative to pre-pandemic levels, taxes have now overtaken it to be the number two concern after labor quality. With the 2017 Tax Cuts & Jobs Act due to expire at the end of the year, the impetus on Congress to pass their tax cut package, especially amid rising economic concerns, is growing.
On the inflation front, the share of firms planning to raise average selling prices hit a 12-month high. This may be in part driven by the spike in the share of firms raising wages in March, as the labor market remained tight through the first quarter, but expectations for input cost adjustments due to tariffs are also likely influencing future pricing plans. Fed Chair Powell noted last week that tariffs would likely lead to higher inflation, potentially complicating the Fed's quest to restore price stability and providing an upside risk to interest rates.
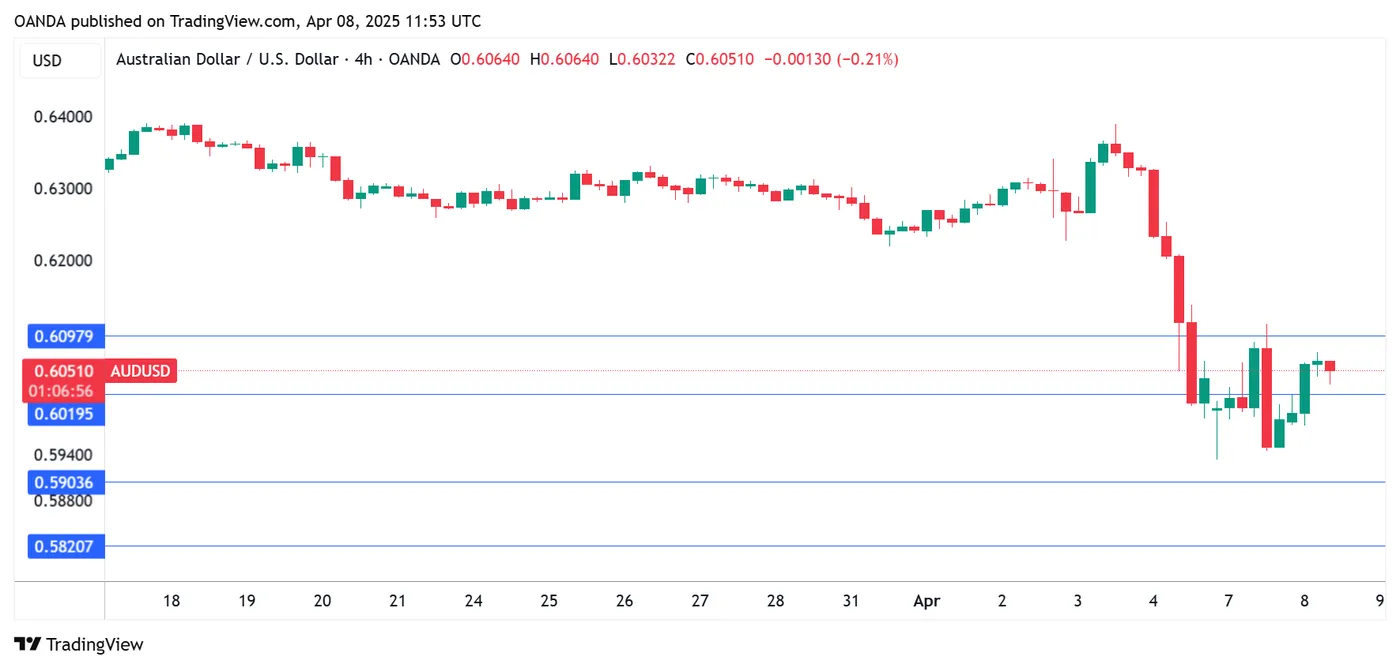
Australian Dollar Rebounds as Market Turmoil Eases
The Australian dollar has posted strong gains on Tuesday. In the European session, AUD/USD is trading at 0.6038, up 0.92% on the day. The Aussie has been swinging wildly and plunged 4.6% on Friday.
Australian consumer confidence sinks
Australia posted soft confidence numbers on Tuesday. The Westpac consumer confidence index declined by 6.0% in April to 90.1, its sharpest loss since May 2023. This was the first drop since January and followed a 4.0% gain in March.
The survey found that consumers are increasingly pessimistic, particularly over US tariff policy. The latest round of tariffs include a 10% tariff on Australian goods.
Business confidence is also deteriorating. The NAB business confidence index edged lower to -3 in March, down from -2 in February and in line with the market estimate. The massive selloff in the financial markets raises the risk of further decline in consumer and business confidence.
The tariff turmoil will likely force the Reserve Bank of Australia to continue cutting rates. The RBA is lagging behind other central banks and has lowered rates only once in its easing cycle, but the markets are expecting up to four rate cuts this year and have priced in a 25-basis point cut in May at 94%.
In the face of the massive selloff on global markets, US President Trump has remained defiant. China has imposed 34% reciprocal tariffs on US goods and Trump has threatened to slap China with a 50% tariff in response to the latest Chinese move.
The mounting escalation between the two largest economies in the world threatens to erupt into a full-scale trade war which would hurt the Australian economy, as China is Australia's biggest trade partner.
AUD/USD Technical
- AUD/USD has pushed above resistance at 0.6016. The next resistance line is 0.6098
- There is support at 0.5903 and 0.5821
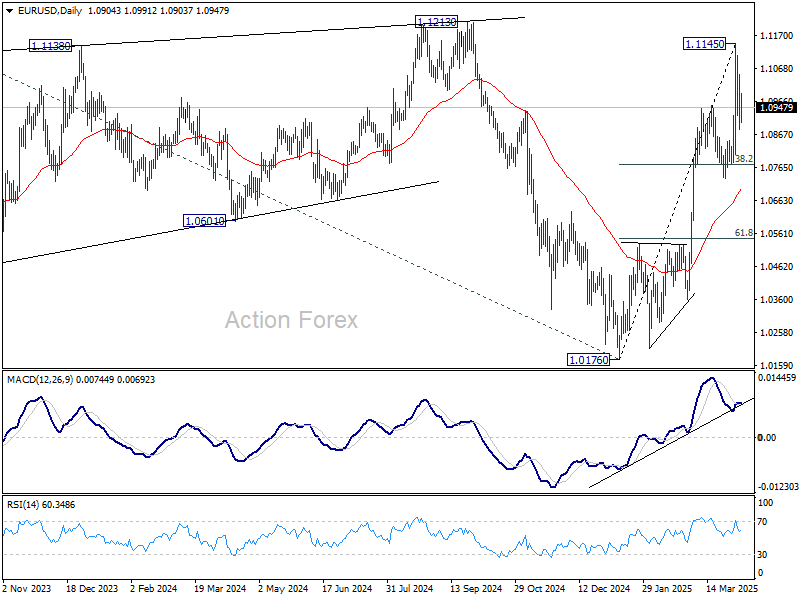
EUR/USD Mid-Day Outlook
Daily Pivots: (S1) 1.0841; (P) 1.0945; (R1) 1.1011; More...
No change in EUR/USD's outlook as consolidations continue below 1.1145. Intraday bias stays neutral for now. Downside of retreat should be contained by 38.2% retracement of 1.0176 to 1.1145 at 1.0775 to bring rebound. On the upside, above 1.1145 will resume the rally from 1.0176 to 1.1213/74 key resistance zone next.
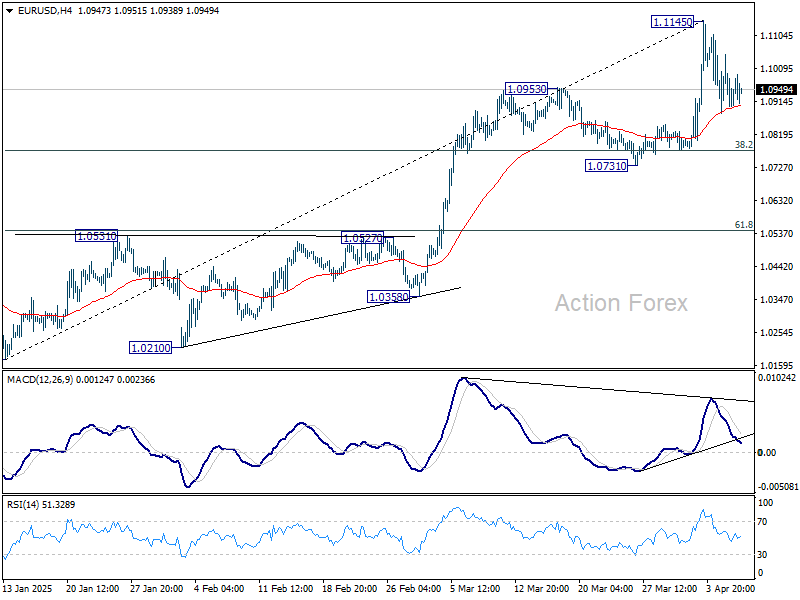
In the bigger picture, fall from 1.1274 (2024 high) has completed as a three wave correction to 1.0176. Rise from 0.9534 ready to resume. Decisive break of 1.1274 will target 100% projection of 0.9534 to 1.1274 from 1.0176 at 1.1916. Also, that will send EUR/USD through the multi-decade channel resistance will carries larger bullish implication. This will now be the favored case as long as 1.0731 support holds.
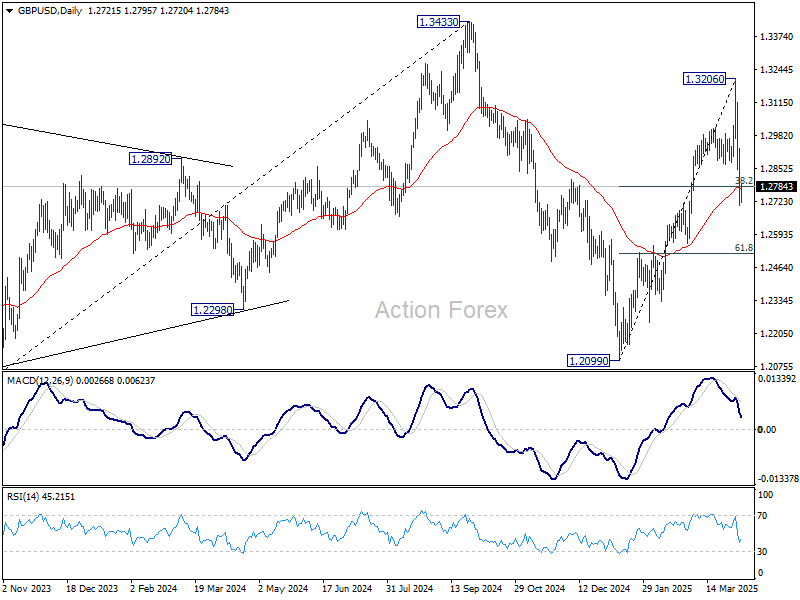
GBP/USD Mid-Day Outlook
Daily Pivots: (S1) 1.2645; (P) 1.2790; (R1) 1.2871; More...
GBP/USD's fall from 1.3206 short term top is still in progress and intraday bias remains on the downside. Sustained trading below 38.2% retracement of 1.2099 to 1.3206 at 1.2783 will target 61.8% retracement at 1.2522. On the upside, above 1.2933 minor resistance will turn intraday bias neutral first.
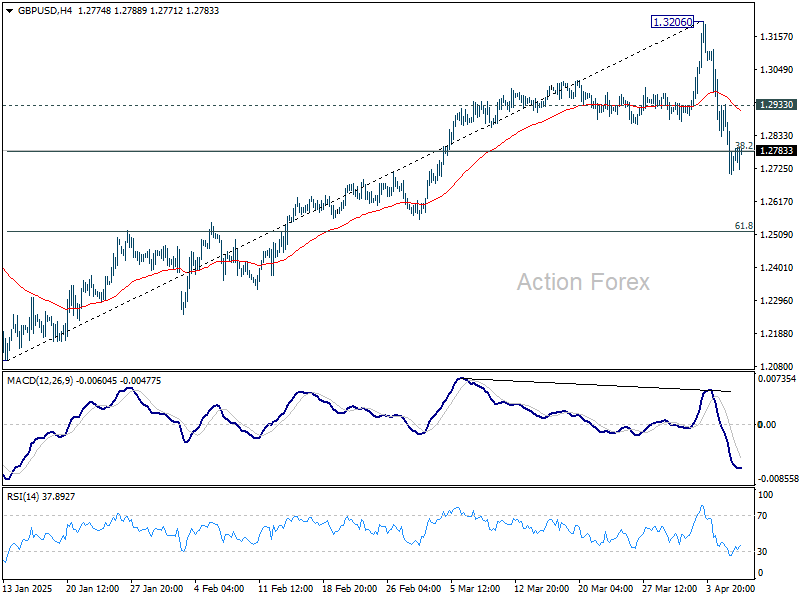
In the bigger picture, price actions from 1.3433 are seen as a corrective pattern to the up trend from 1.3051 (2022 low). Rise from 1.2099 could be the second leg. Overall, GBP/USD should target 1.4248 key resistance (2021 high) on break of 1.3433 at a later stage.