Sample Category Title
USD/JPY Mid-Day Outlook
Daily Pivots: (S1) 145.78; (P) 146.96; (R1) 149.11; More...
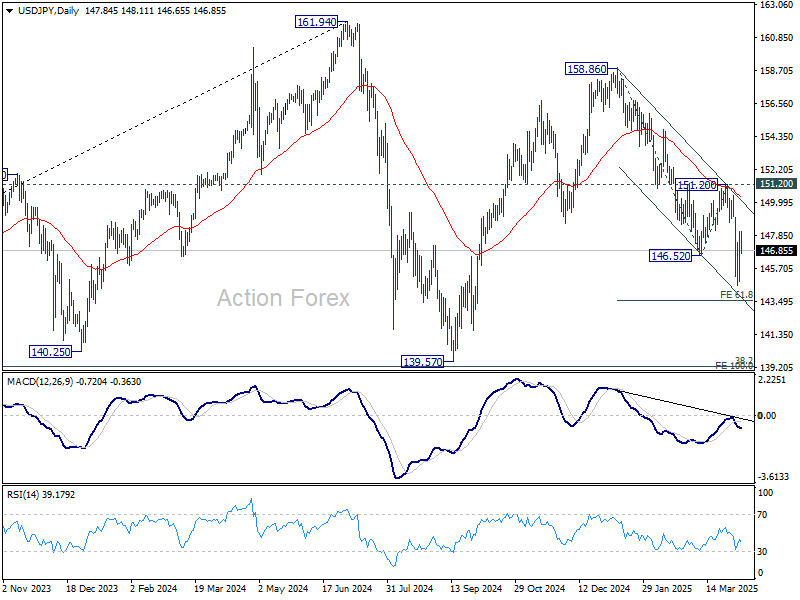
No change in USD/JPY's outlook as consolidation continues above 144.54. Intraday bias stays neutral for the moment. Upside of recovery should be limited below 151.28 resistance. On the downside, below 144.54 will resume the fall from 158.86 and target 61.8% projection of 158.86 to 146.52 from 151.20 at 143.57. Break there will target 139.57 low.
In the bigger picture, price actions from 161.94 are seen as a corrective pattern to rise from 102.58 (2021 low), with fall from 158.86 as the third leg. Strong support should be seen from 38.2% retracement of 102.58 to 161.94 at 139.26 to bring rebound. However, sustained break of 139.26 would open up deeper medium term decline to 61.8% retracement at 125.25.
USD/CHF Mid-Day Outlook
Daily Pivots: (S1) 0.8480; (P) 0.8577; (R1) 0.8704; More…
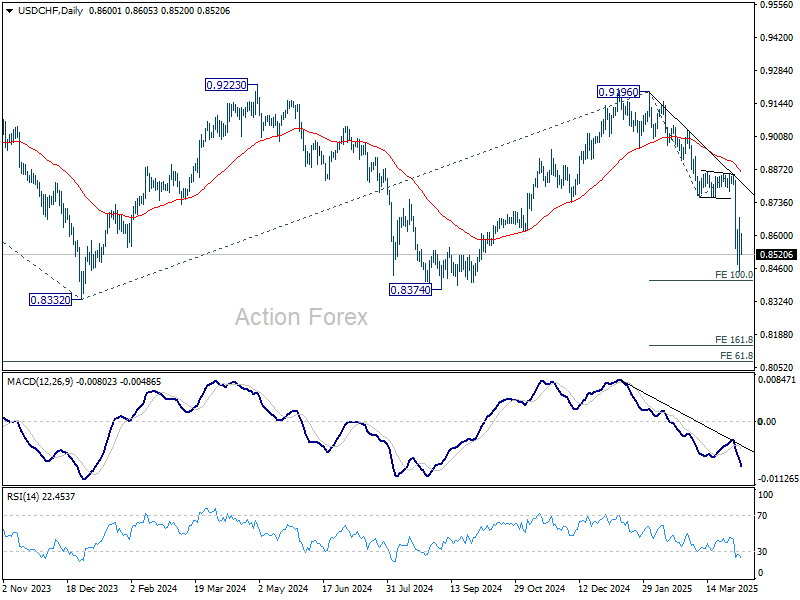
Intraday bias in USD/CHF remains neutral for the moment, and more consolidations would be seen above 0.8450. Upside of recovery should be limited below 0.8757 support turned resistance. On the downside, below 0.8450 will resume the fall from 0.9196 and target 100% projection of 0.9196 to 0.8757 from 0.8854 at 0.8415.
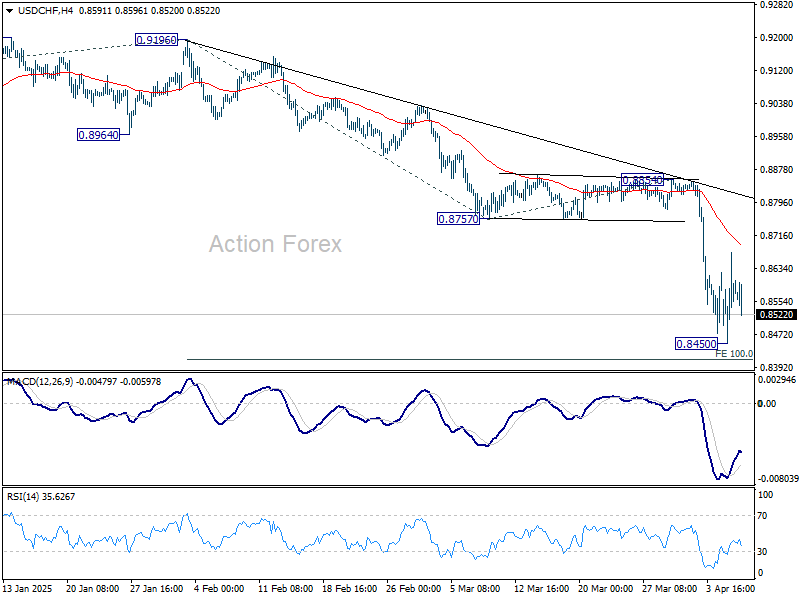
In the bigger picture, rejection by 0.9223 key resistance keep medium term outlook bearish. That is, larger fall from 1.0342 (2017 high) is not completed yet. Firm break of 0.8332 (2023 low) will confirm down trend resumption. Next target is 61.8% projection of 1.0146 (2022 high) to 0.8332 from 0.9196 at 0.8075.
Markets Catch a Breath, But US-China Showdown Keep Rebound on Thin Ice
Global markets are having a precious moment of calm, with risk sentiment stabilizing across Asia and Europe, and US futures pointing to a higher open. The recent wave of aggressive selling appears to have peaked—at least temporarily—offering traders a breather from the huge volatility experienced since last week. However, this rebound should not be mistaken for a true reversal in sentiment. Markets remain highly sensitive, and downside risks persist should trade tensions escalate further.
The immediate flashpoint lies in US-China relations. US President Donald Trump has warned that if China does not withdraw its 34% retaliatory tariffs by Wednesday, the US will impose an additional 50% tariff on Chinese goods. Should that happen, the effective tariff rate on Chinese imports would soar beyond 100%, marking a significant and historic escalation in global trade conflict.
Meanwhile, Chinese authorities are making visible efforts to bolster domestic market confidence. Sovereign wealth fund Central Huijin Investment, often dubbed the “national team,” confirmed ETF purchases and pledged further action to support equity prices. This has been echoed by major state-owned enterprises and listed firms announcing share buybacks. In tandem, China’s financial regulator is preparing to lift caps on insurance fund investments in equities to provide further support to the capital markets.
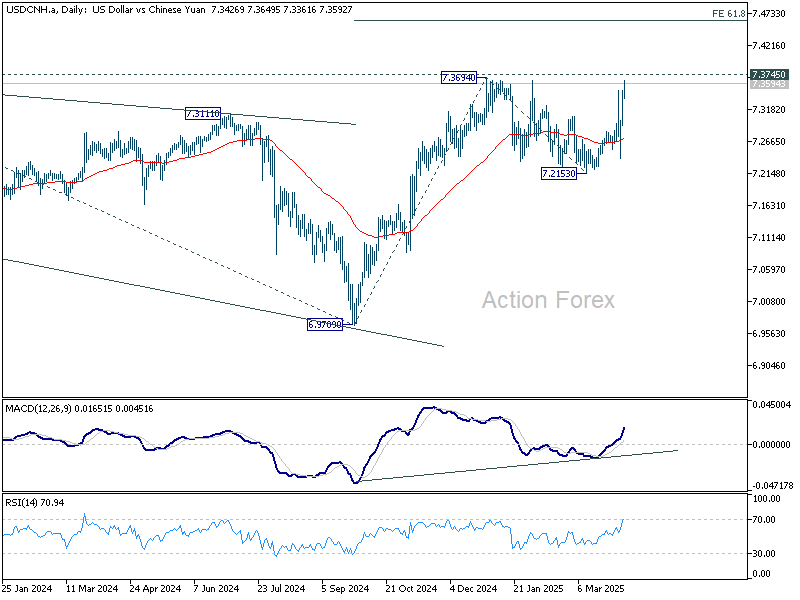
Beyond equity stabilization, currency markets are on alert. The Chinese Yuan is nearing record lows against Dollar, with market speculations over whether Beijing will allow it to depreciate as a countermeasure to tariffs. Should the PBoC relax its grip and let the Yuan slide further, it could trigger fresh turbulence in the regional markets that ripples globally.
From a pure technical perspective, USD/CNH's correction from 7.3964 should have completed at 7.2153 already. Firm break of 7.3964/3745 key resistance zone will quickly push USD/CNH to 61.8% projection of 6.9709 to 7.3694 from 7.2153 at 7.4616.
In Europe, at the time of writing, FTSE is up 2.54%. DAX is up 2.57%. CAC is up 2.34%. UK 10-year yield is up 0.029 at 4.636. Germany 10-year yield is up 0.056 at 2.667. Earlier in Asia, Nikkei rose 6.03%. Hong Kong HSI rose 1.51%. China Shanghai SSE rose 1.58%. Singapore Strait Times fell -2.01%. Japan 10-year JGB yield rose 0.163 to 1.279.
ECB’s de Guindos urges cool heads as Europe faces trade wake-up call
ECB Vice-President Luis de Guindos struck a cautiously hopeful tone on Europe's ability to manage rising global trade tensions, suggesting that markets tend to overreact in the short term but eventually recalibrate.
Speaking at an event in Spain, de Guindos noted that despite the sharp volatility triggered by the US tariff escalation, market liquidity remains intact.
Despite the pressure, de Guindos said he was "relatively optimistic" about Europe's ability to weather the storm, calling the situation a “wake-up call” to pursue greater economic and military autonomy.
De Guindos stressed the importance of negotiating with the U.S. “with a cool head”.
Separately, Greek ECB Governing Council member Yannis Stournaras offered a more cautious view, warning that a renewed surge in inflation or rising inflation expectations could disrupt ECB’s path to monetary policy normalization.
"Tariffs imposed on one country's imports would affect other countries participating in the global chains, even if no countermeasures were imposed," Stournaras added.
Aussie Westpac consumer sentiment slumps post-tariff shock; RBA seen tilting toward May rate cut
Australia’s Westpac Consumer Sentiment index plunged -6.0% in April, dropping from 95.9 to 90.1. The steep fall was notably skewed by the timing of the survey in relation to US announcement of reciprocal tariffs on April 2.
Respondents surveyed before the announcement showed only a modest dip in sentiment to 93.9. Those surveyed after reported a sharp drop of nearly 10% to 86.6. .
The sub-indices measuring sentiment towards the economy were particularly hard-hit, with the outlook for the next 12 months falling -5.7% to 90.5, and the 5-year outlook slipping back by -3.0%
With RBA set to meet on May 19-20, Westpac believes the weakening external backdrop, coupled with softer inflation, will push RBA to deliver another 25 bps rate cut. RBA is likely to become "much more focused on downside risks to growth than lingering questions about inflation".
Australia NAB business confidence dips to -3 ahead of tariff impact
Australia’s NAB Business Confidence index dipped slightly from -2 to -3 in March, remaining firmly in negative territory. Business Conditions, however, edged up from 3 to 4, a modest improvement that still leaves them slightly below average overall.
Cost pressures remained broadly stable, with purchase costs rising 1.4% in quarterly equivalent terms and product price growth holding at 0.5%. Labour cost growth eased slightly.
NAB Chief Economist Sally Auld noted that conditions continue to vary across industries, with the services sector faring best while manufacturing and retail remain under pressure.
Importantly, this data predates the escalation of the global trade dispute, particularly the reciprocal tariff measures announced in early April. As Auld cautioned, these developments could "flow through to forward looking measures in the next survey.”
RBNZ set to cut again, bearish momentum resumes in NZD/JPY
RBNZ is widely expected to deliver another 25bps cut tomorrow, bringing the Official Cash Rate down to 3.50%. With the move largely priced in, traders will be focused on how the central bank interprets the rapidly evolving global environment.
As the first major central bank to meet since the US launched the sweeping reciprocal tariffs, RBNZ’s tone and guidance will not only be key for New Zealand, but will also offer insights for the broader Asia-Pacific region.
While there are speculative whispers about the possibility of a larger-than-expected rate cut to cushion the economy against the external shock, RBNZ will likely refrain from doing so just yet. The current level of uncertainty, both in terms of policy responses and economic impact, should see the central bank remain cautious, maintaining its easing bias without overcommitting.
With another cut already projected in May, RBNZ is expected to stay on its path of gradual policy accommodation while waiting for more concrete data on trade disruption effects. The question of whether the RBNZ will eventually push OCR below 3.00% remains open. Much will depend on how the trade war unfolds, how consumer and business sentiment hold up, and the extent of the ripple effects across Asia’s open economies.
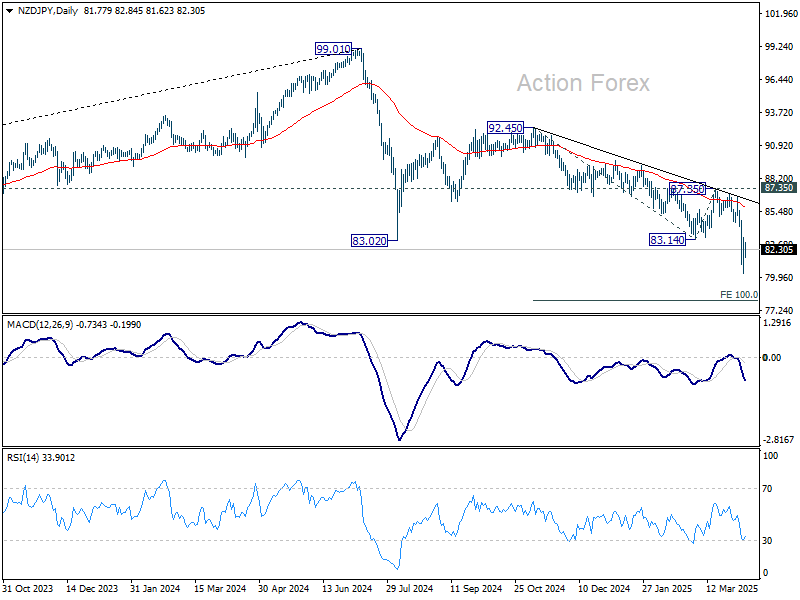
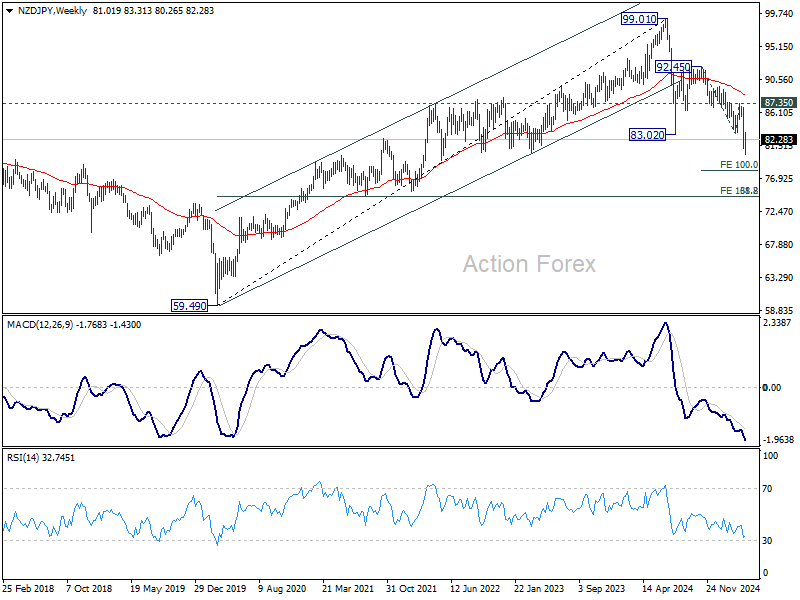
Technically, NZD/JPY's down trend from 99.01 (2024 high) resumed by breaking through 83.02 low last week. Whether this is a correction of the multi-year uptrend from the 2020 low of 59.49, or a full reversal, is yet to be determined.
In either case, near term outlook will remain bearish as long as 87.35 resistance holds, in case of recovery. Next target is 100% projection of 92.45 to 83.14 from 87.35 at 78.04. Firm break there will target 138.2% projection at 74.48. This coincides with 61.8% retracement of 59.49 to 99.01 at 74.58.
USD/CHF Mid-Day Outlook
Daily Pivots: (S1) 0.8480; (P) 0.8577; (R1) 0.8704; More…
Intraday bias in USD/CHF remains neutral for the moment, and more consolidations would be seen above 0.8450. Upside of recovery should be limited below 0.8757 support turned resistance. On the downside, below 0.8450 will resume the fall from 0.9196 and target 100% projection of 0.9196 to 0.8757 from 0.8854 at 0.8415.
In the bigger picture, rejection by 0.9223 key resistance keep medium term outlook bearish. That is, larger fall from 1.0342 (2017 high) is not completed yet. Firm break of 0.8332 (2023 low) will confirm down trend resumption. Next target is 61.8% projection of 1.0146 (2022 high) to 0.8332 from 0.9196 at 0.8075.
ECB’s de Guindos urges cool heads as Europe faces trade wake-up call
ECB Vice-President Luis de Guindos struck a cautiously hopeful tone on Europe's ability to manage rising global trade tensions, suggesting that markets tend to overreact in the short term but eventually recalibrate.
Speaking at an event in Spain, de Guindos noted that despite the sharp volatility triggered by the US tariff escalation, market liquidity remains intact.
Despite the pressure, de Guindos said he was "relatively optimistic" about Europe's ability to weather the storm, calling the situation a “wake-up call” to pursue greater economic and military autonomy.
De Guindos stressed the importance of negotiating with the U.S. “with a cool head”.
Separately, Greek ECB Governing Council member Yannis Stournaras offered a more cautious view, warning that a renewed surge in inflation or rising inflation expectations could disrupt ECB’s path to monetary policy normalization.
"Tariffs imposed on one country's imports would affect other countries participating in the global chains, even if no countermeasures were imposed," Stournaras added.
XAU/USD: Gold Rises Above $3,000 But Downside Still at Risk
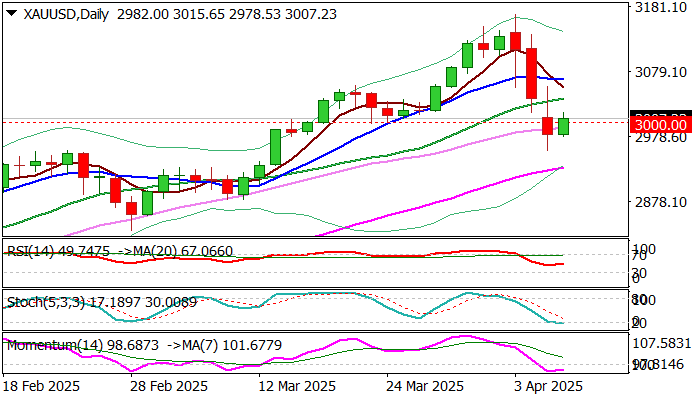
Gold price bounced on Tuesday and returned above key $3000 level, partially offsetting initial negative signal on violation of this support on Monday and threats of deeper pullback on clear break lower.
Profit taking after a steep fall in past three days, which was mainly driven by closing profitable gold longs to cover losses from sharply falling stocks and attempts to regain its safe haven appeal in situation of strong risk aversion, inflated metal’s price.
As mentioned in previous comment, reaction on $3000 level will be crucial for the near term direction, with downside risk still present despite today’s bounce.
Markets await more news about potential negotiations about tariffs after more than fifty countries contacted US administration for a ‘peace talks’, while unstable economic and geopolitical situation continues to provide support for safe haven assets.
Technical picture slightly improved on daily chart, with oversold conditions adding to hopes of further recovery, but countered with still negative momentum.
Potential close above $3000 could provide temporary relief, however more work at the upside will be required.
Break and close above $3037 (Fibo 38.2% of $3167/$2956 / 20DMA) would brighten near term picture and boost expectations of further recovery, while failure here but ability to hold above $3000 would keep hopes of recovery alive, but fragile.
The negative scenario sees attempts above $3000 as a false break which would keep the downside vulnerable of deeper correction towards targets at $2911/00 (Fibo / psychological.
Res: 3017; 3037; 3050; 3061.
Sup: 2978; 2956; 2926; 2911.
Will Brent Oil Recover? Trade Tensions and Inventory Data to Watch
- Brent oil prices are volatile due to concerns about US tariffs, potential global recession, and OPEC+ supply decisions.
- Technical analysis suggests a possible recovery for Brent crude, with the RSI indicating a potential shift in momentum.
- US drilling activity could slow down if WTI prices remain below $65 per barrel, potentially impacting supply.
Brent crude prices were up around 1% in the Asian session but have since turned red for the day following the European open.
Oil prices recovered from their lowest point in nearly four years during the Asian session as worries persist that U.S. tariffs could hurt demand and trigger a global recession. Caution remains as there are still risks of further declines in the days ahead.
As of Monday, Brent and WTI had slumped 14% and 15% respectively following U.S. President Donald Trump's April 2 announcement of "reciprocal tariffs" on all imports.
The situation remains risky as President Trump threatened to add a 50% tariff on Chinese goods if China doesn’t remove its 34% retaliatory tariff yesterday. It’s unlikely China will change its stance with comments overnight hinting as much, which means tensions could rise further, adding to concerns about slower growth and weaker oil demand.
OPEC + concerns
Crude oil prices dropping since April 2 suggest the market sees a higher chance of a recession. The sharp decline will likely concern OPEC+, which surprised everyone last week by announcing a bigger supply increase for May.
If prices keep falling, OPEC+ might stop or even reverse these increases. Saudi Arabia needs around $90 per barrel to balance its budget according to ING. While last week’s supply hike shows they’re not targeting this price, they likely don’t want to see oil prices drop much further below their breakeven point.
A Reuters report yesterday revealed OPEC's oil production dropped in March before a planned output increase, according to a Reuters survey. Nigeria reduced supplies to local refineries, and U.S. efforts to cut exports from Iran and Venezuela had an impact. OPEC produced 26.63 million barrels per day last month, 110,000 barrels per day less than in February, with the biggest declines from Nigeria, Iran, and Venezuela.
Is there a silver lining for Oil prices?
Market participants looking at the supply and demand picture may have a small reason to be optimistic. As with OPEC +, if Oil prices drop too far the profitability comes into question which could help lessen supply and provide some support to prices.
For example, a slowdown in U.S. drilling could give the market some support. There is a case to be made that with current WTI prices a drop in drilling activity becomes a real possibility. This could eventually lead to slower supply growth or even a drop in U.S. oil production. U.S. shale production declines quickly, so constant drilling is needed to maintain stable output. According to the Dallas Federal Reserve Energy survey, producers need about $65 per barrel to profitably drill a new well.
The longer WTI prices hover below the $65 a barrel, the greater the probability that drilling activity may start to be impacted. This is definitely worth monitoring.
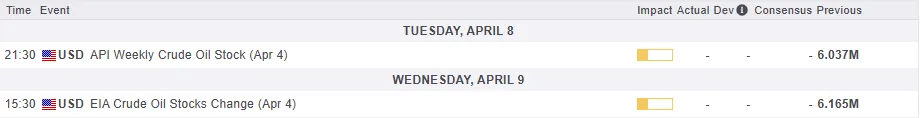
Inventories data due later this week
A preliminary Reuters poll on Monday suggested that U.S. crude oil and distillate stockpiles likely increased by about 1.6 million barrels last week, pointing to weak demand. The American Petroleum Institute is set to release inventory data on Tuesday, with official numbers from the Energy Information Administration coming on Wednesday.
Technical Analysis - Brent Crude
This is a follow-up analysis of my prior report “Brent Oil price plummets: OPEC+ output hike & price outlook” published on April 1 2025.
From a technical analysis standpoint, Brent has printed an indecision doji candle on the daily timeframe which could hint at a potential recovery.
The period 14-RSI is in overbought territory and may be used as a confirmation of sorts that momentum has shifted. When the RSI crosses back above the 30 level this could be a sign.
Immediate resistance rests at 66.42 and 68.17 before the 69.52 and 70.00 psychological handle come into focus.
Having broken above the descending trendline Brent looked poised for further gain earlier this week. However, as discussed in the article on April 1, the fundamentals did not support the technicals completely. Downside risk was always present with growth concerns always likely to arise from the tariff announcements.
A move lower from current price and yesterday's lows are the first area of support resting at 62.76 before the 61.00 and psychological 60.oo handle comes into focus.
For now though, Oil will be driven by overall market sentiment as well as developments around the tariff picture moving forward.
Brent Crude Oil Daily Chart, April 8, 2025
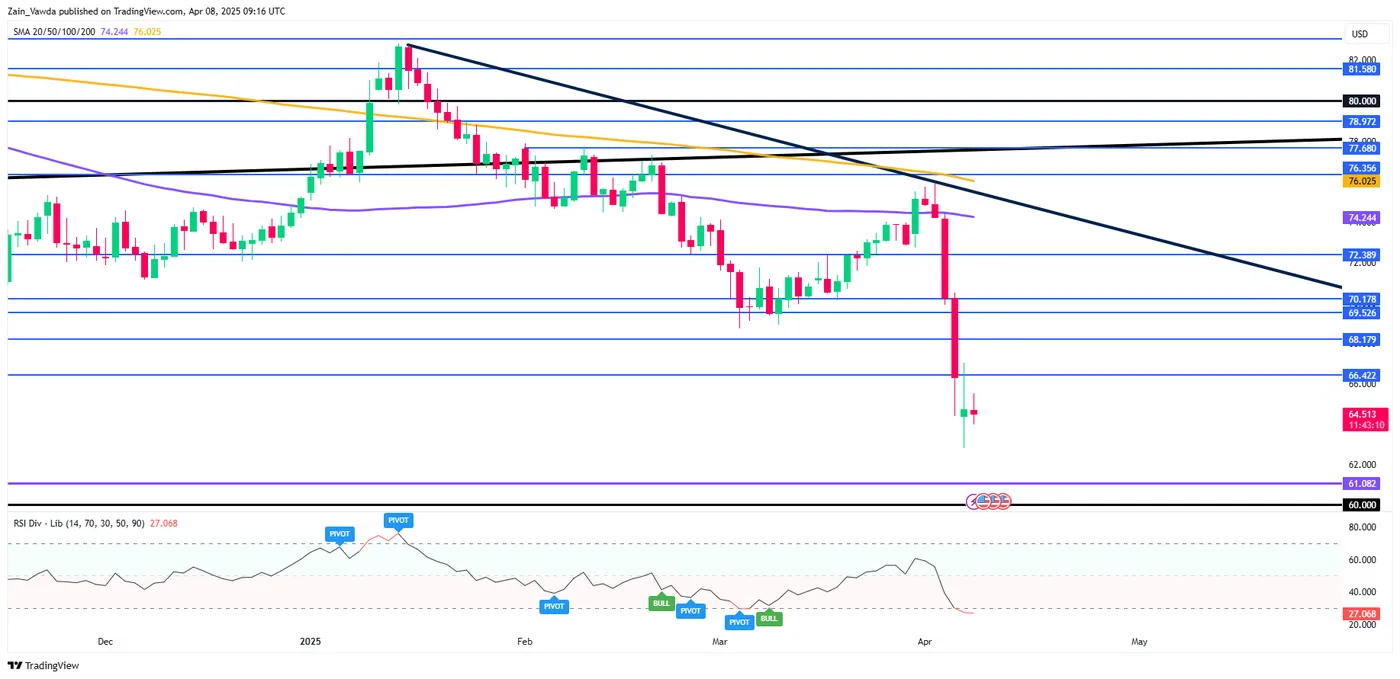
Source: TradingView (click to enlarge)
Support
- 62.76
- 61.00
- 60.00 (psychological level)
Resistance
- 66.42
- 68.17
- 69.52
Client Sentiment Data
Looking at OANDA client sentiment data and market participants are long on WTI with 91% of traders holding long positions. I prefer to take a contrarian view toward crowd sentiment and thus the fact that so many traders are long means WTI prices could decline further.
EURCAD: Precise Reaction Higher from the Blue Box—What’s Next?
In this technical blog, we will look at the past performance of the 1-hour Elliott Wave Charts of EURCAD. In which, the rally from 22 November 2024 low is unfolding as an impulse sequence. Therefore, called for an extension higher to take place. We knew that the structure in EURCAD should remain supported & extend higher. So, we advised members not to sell the pair & buy the dips in 3, 7, or 11 swings at the blue box areas. We will explain the structure & forecast below:
EURCAD 1-Hour Elliott Wave Chart From 3.21.2025
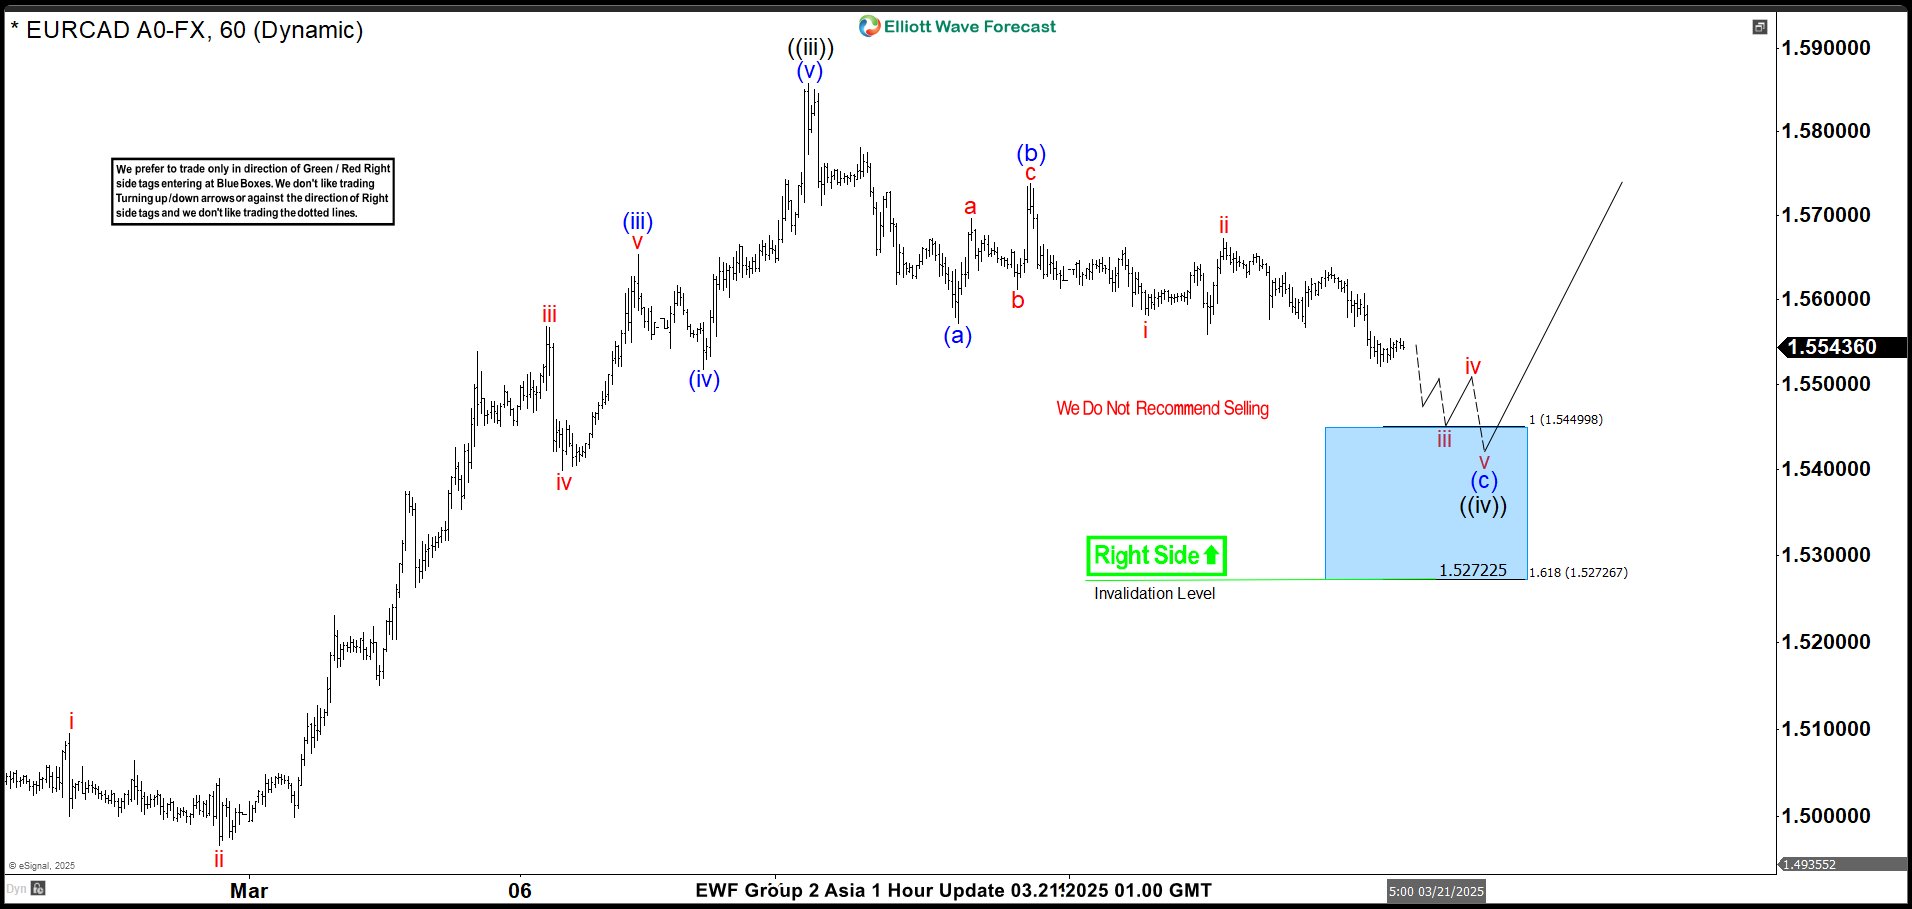
Here’s the 1-hour Elliott wave Chart from the 3.21.2025 Asia update. In which, the rally to 1.5857 high completed wave ((iii)) & made a pullback in wave ((iv)). The internals of that pullback unfolded as Elliott wave zigzag correction where wave (a) ended at 1.5571 low. Then a bounce to 1.5738 high-ended wave (b) & started the next leg lower in wave (c) towards 1.5449- 1.5272 blue box area. From there, buyers were expected to appear looking for new highs ideally or for a 3-wave bounce minimum.
EURCAD Latest 1-Hour Elliott Wave Chart From 4.08.2025
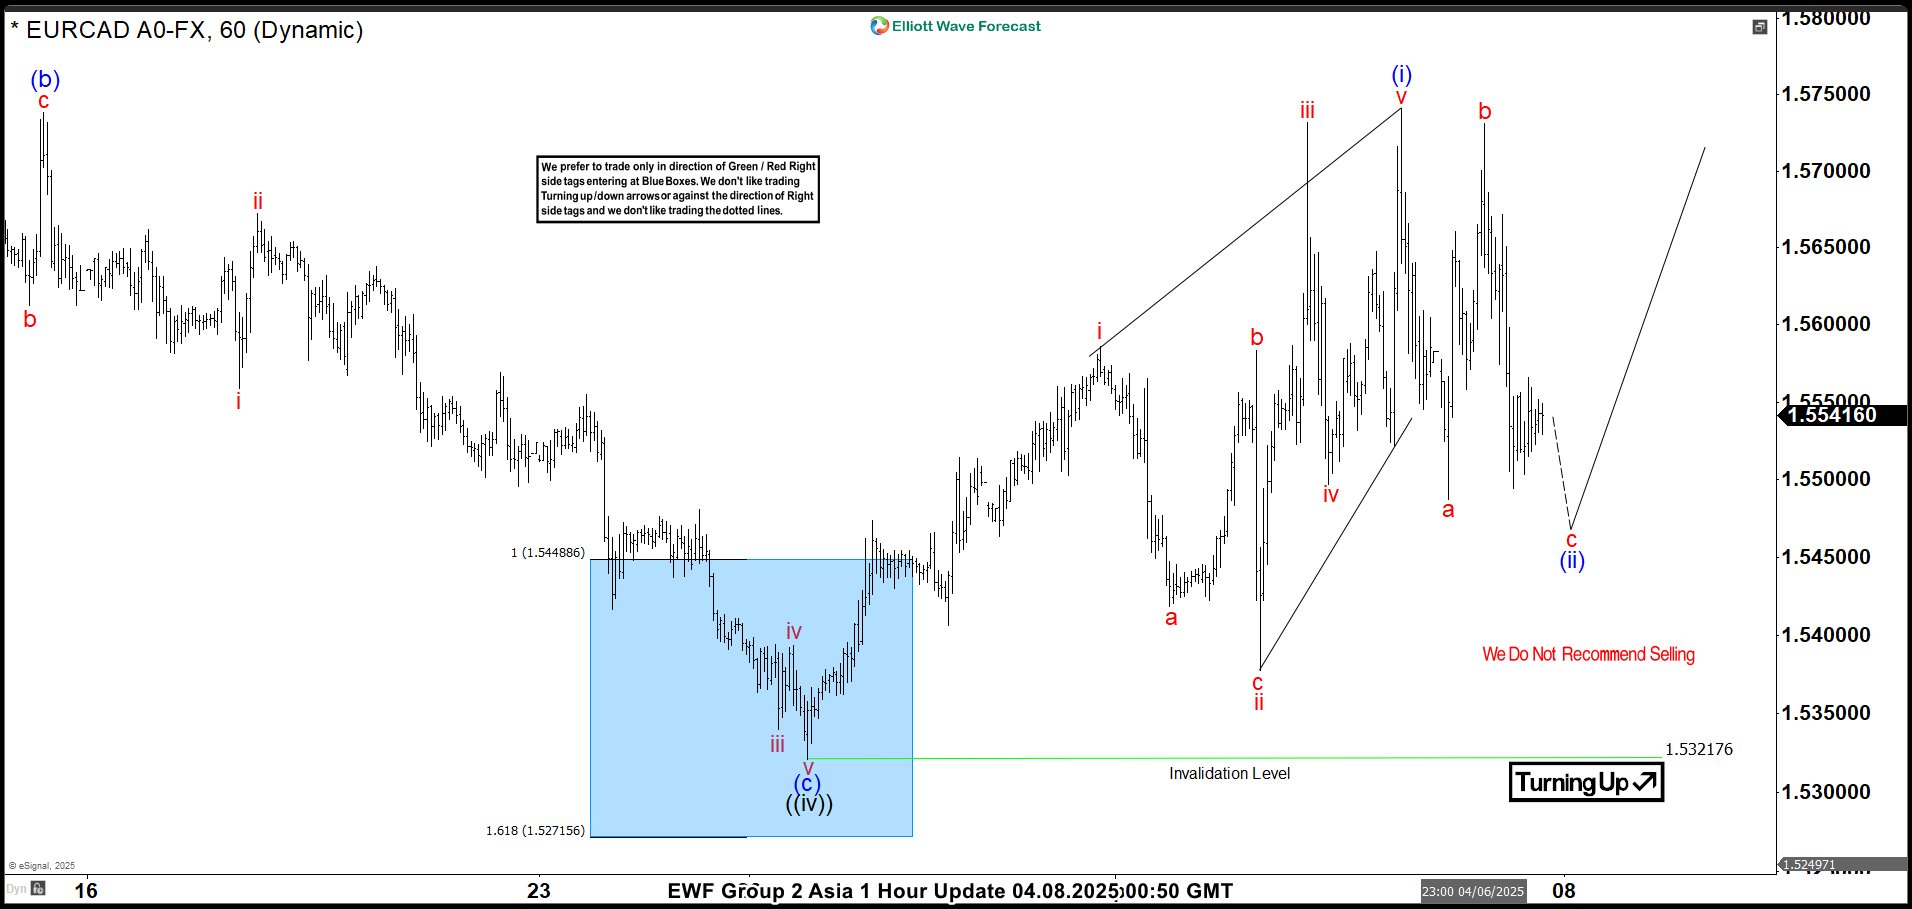
This is the latest 1-hour Elliott wave Chart from the 4.08.2025 Asia update. In which the pair is showing a strong reaction higher taking place, right after ending the zigzag correction within the blue box area. Allowed members to create a risk-free position shortly after taking the long position at the blue box area. However, a break above 1.5857 high is still needed to confirm the next extension higher minimum towards 1.5985- 1.6190 area & avoid double correction lower.
Japanese Yen Recovers Some Losses as Investors Seek Safe-Haven Assets
The USD/JPY pair has stabilised around 147.60 following two consecutive days of gains, with the yen now attempting to recoup some of its recent losses.
Key factors influencing USD/JPY movements
Uncertainty in global trade relations remains a key focus for currency markets, heightening demand for safe-haven assets. Recent reports indicate that US President Donald Trump has agreed to meet Japanese officials to initiate trade discussions following a phone call with Prime Minister Shigeru Ishiba.
US Treasury Secretary Scott Bessent will lead the negotiations, underscoring the strength of the US-Japan alliance. Key topics will include tariffs, non-tariff barriers, foreign exchange policies, and government subsidies.
Despite Trump’s openness to dialogue, he has dismissed the possibility of delaying new reciprocal tariffs and warned that these measures could remain in place indefinitely. Domestically, Japan’s current account surplus for February reached a record high, buoyed by rising exports and declining imports, which has provided firm support for the yen.
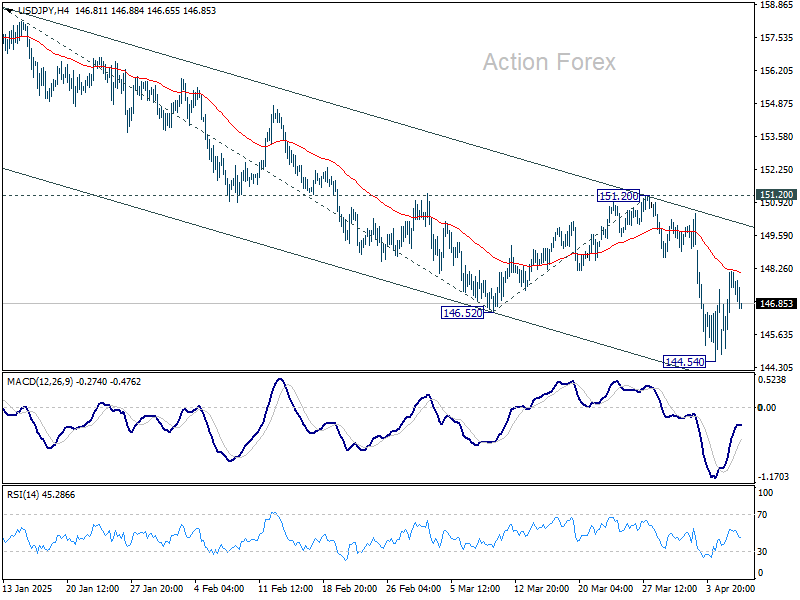
Technical outlook: USD/JPY
H4 Chart: The pair achieved its local downside target at 144.50 before correcting to 148.12. Following this correction, we anticipate another potential decline towards 143.83. This scenario is supported by the MACD indicator, where the signal line remains below zero and points sharply downward.

H1 Chart: The pair completed an upward structure, reaching 148.12, and is now consolidating below this level. We expect a new downward wave towards 146.27, with further downside potential to 143.83. The Stochastic oscillator confirms this outlook, with its signal line below 50 and trending firmly downward towards 20.

Conclusion
The yen’s recovery reflects ongoing market caution, with technical indicators suggesting further downside for USD/JPY. Investors will closely monitor trade developments and macroeconomic data for directional cues.
RBNZ set to cut again, bearish momentum resumes in NZD/JPY
RBNZ is widely expected to deliver another 25bps cut tomorrow, bringing the Official Cash Rate down to 3.50%. With the move largely priced in, traders will be focused on how the central bank interprets the rapidly evolving global environment.
As the first major central bank to meet since the US launched the sweeping reciprocal tariffs, RBNZ’s tone and guidance will not only be key for New Zealand, but will also offer insights for the broader Asia-Pacific region.
While there are speculative whispers about the possibility of a larger-than-expected rate cut to cushion the economy against the external shock, RBNZ will likely refrain from doing so just yet. The current level of uncertainty, both in terms of policy responses and economic impact, should see the central bank remain cautious, maintaining its easing bias without overcommitting.
With another cut already projected in May, RBNZ is expected to stay on its path of gradual policy accommodation while waiting for more concrete data on trade disruption effects. The question of whether the RBNZ will eventually push OCR below 3.00% remains open. Much will depend on how the trade war unfolds, how consumer and business sentiment hold up, and the extent of the ripple effects across Asia’s open economies.
Technically, NZD/JPY's down trend from 99.01 (2024 high) resumed by breaking through 83.02 low last week. Whether this is a correction of the multi-year uptrend from the 2020 low of 59.49, or a full reversal, is yet to be determined.
In either case, near term outlook will remain bearish as long as 87.35 resistance holds, in case of recovery. Next target is 100% projection of 92.45 to 83.14 from 87.35 at 78.04. Firm break there will target 138.2% projection at 74.48. This coincides with 61.8% retracement of 59.49 to 99.01 at 74.58.
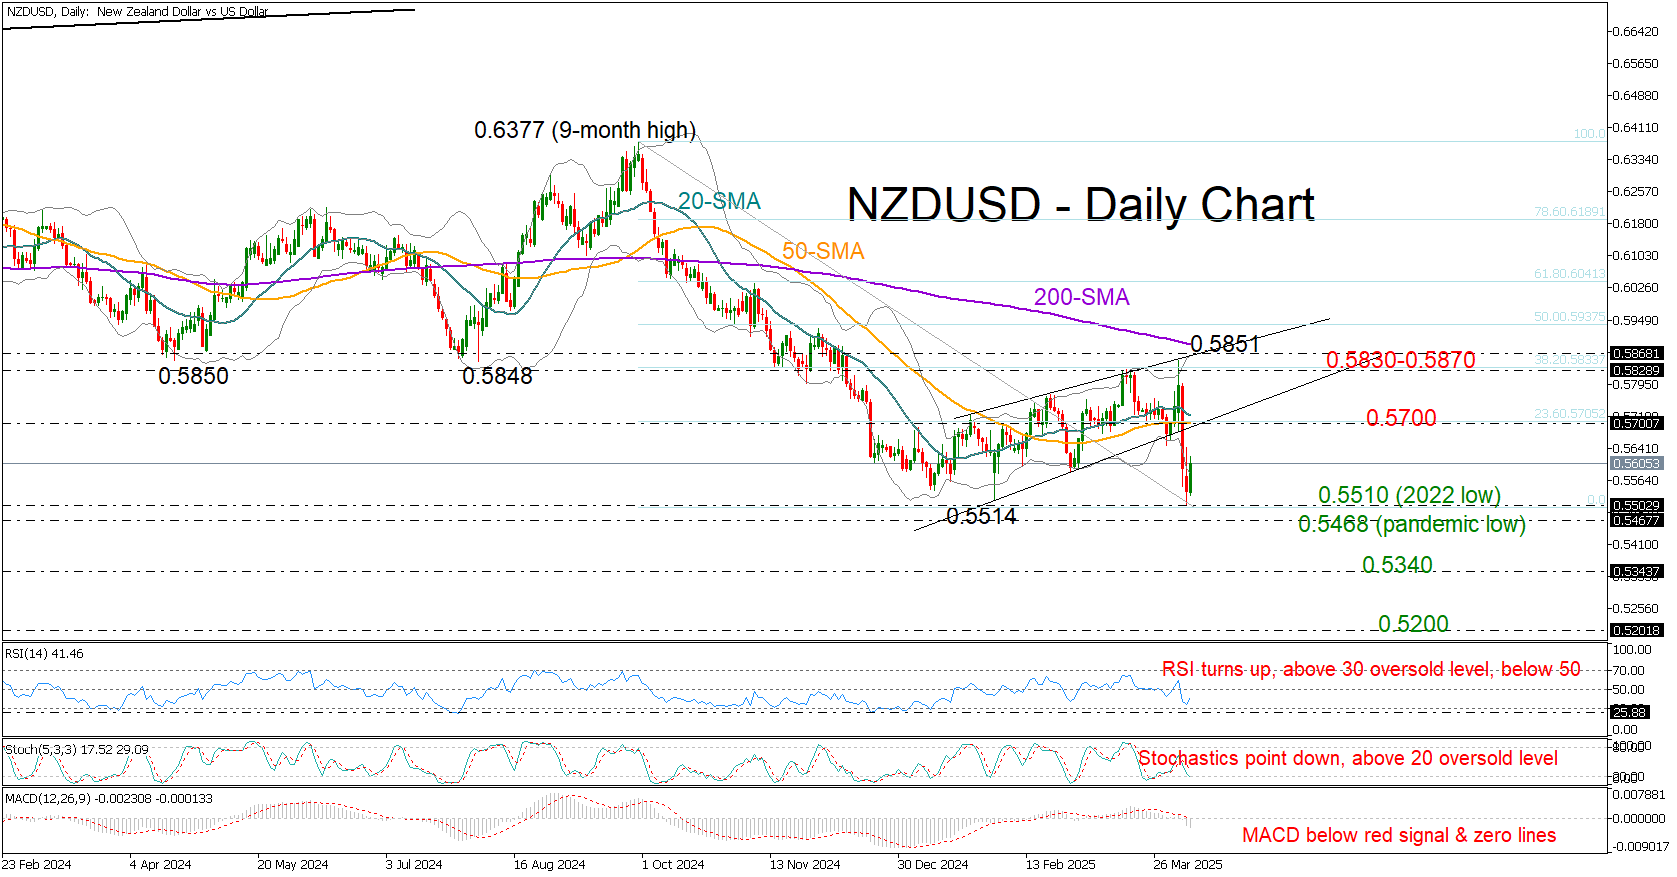
NZD/USD Rebounds: A Dead Cat Bounce?
- NZD/USD rebounds near 2022 and pandemic lows.
- Short-term trend remains bearish; bulls need a break above 0.5870.
NZDUSD switched to recovery mode on Tuesday after a bleak start to the week, which pushed the price slightly below the 2022 low of 0.5510 and closer to its pandemic trough of 0.5468, as investors continued to digest tariff-led growth risks.
The RBNZ’s policy decision on Wednesday (03:00 GMT) is the next highlight on the calendar. While a 25bps rate cut to 3.5% is expected, a larger 50bps move might be on the cards as well. However, with the global trade war having just escalated between the US and China, and other economies preparing their countermeasures against the White House, policymakers may hold off on aggressive actions.
Technically, the short-term outlook remains bearish. Momentum indicators like RSI and MACD suggest limited upside, with no clear signs of oversold conditions or reversal.
Still, with the price hovering near a long-term pivot area, some stability could emerge. The main target could be the 0.5700 round figure, where the 50-day simple moving average (SMA) intersects with the short-term support trendline from February. A decisive break above this level could lead to a retest of the key 0.5830–0.5870 zone and the 200-day SMA. A move above that range would upgrade the short-term outlook.
In the bearish scenario, if the downtrend extends below the pandemic low of 0.5468, support may emerge near the 0.5345 level and then around 0.5200. Then, the 2009 bottom at 0.4890 might come into play.
All in all, NZDUSD continues to exhibit weakness despite today’s bounce. For the risk bias to turn positive, the bulls must stage a sustainable rally above the 200-day SMA and the 0.5870 region.