Sample Category Title
Bitcoin: Bulls Regain Traction on Softer Tariff Rhetoric
Bitcoin jumped on Monday, advancing 2.7% until early US trading, as softer tones on tariffs from Trump’s administration revived positive sentiment.
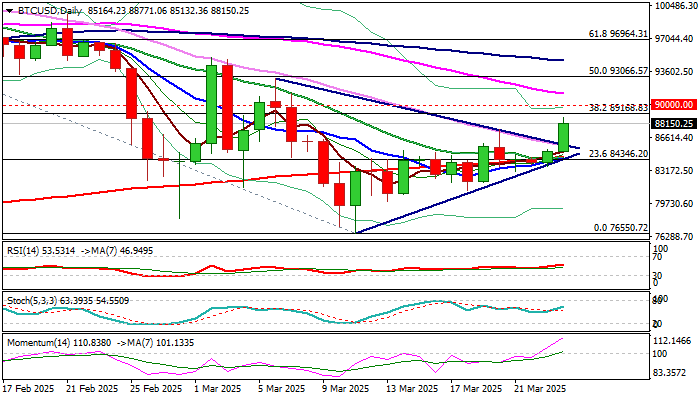
Fresh strength emerges above multi-day range and generates positive signal on break of the upper boundary of triangle on daily chart.
Daily close above triangle (upper line lays at 86113) will be minimum requirement to keep fresh bulls in play.
Key barriers at 89168 (Fibo 38.2% of 109582/76550) and 90K (round figure, former range floor and key support) are coming in focus, with break here to generate initial reversal signal and open way for stronger recovery (91295 – 55DMA and 93066 – Fibo 50% mark next targets).
Res: 89168; 90000; 91294; 93066.
Sup: 87497; 86113; 84500; 83098.
Sunset Market Commentary
Markets
European PMIs offered a first glimpse of the impact on the German-European defense initiative on business. So far, though, the huge government spending announcements only lifted the forward looking indicator (sentiment towards future activity), specifically in Germany. That makes sense of course since all of this still needs to translate into actual policy decisions and thus into the real economy. It’s against that backdrop we shouldn’t be too worried about an overall slight miss of the composite European PMI, which came in at 50.4 vs 50.7 expected and picking up from 50.2. It’s nonetheless the highest print in seven months. Manufacturing was responsible for the improvement. While the overall indicator is still in contraction territory, the 48.7 was the highest reading since February 2023. In addition, the output subseries returned to growth for the first time in two years. Germany contributed to this due to what is seen as a production boost ahead of import tariffs. While this is likely to fade again, the effects of the large infrastructure & defense package may take over afterwards. The services gauge fell to a four-month low of 50.4. New orders dropped in both sectors and with a faster rise in services employment and softer reduction of the work force in manufacturing, backlogs of work fell once again. Input costs inflation eased due to a services-lead slowdown, be it to a still sharp rate. This resulted in the slowest pace of rising selling prices year-to-date. Interestingly though, the manufacturing sector raised output prices for the first time in seven months. In theory today’s outcome support the case for a final, tactical ECB rate cut in April before moving into an extended pause, our preferred scenario. Euro area money market thinking, however, remains split with implied probabilities only marginally rising to 63% compared to 58% on Friday. That’s also keeping European yields in check. They erased some kneejerk losses quickly to trade between 1-3 bps higher in a steepening move. We suspect reports of the US pursuing a more targeted approach in the reciprocal tariff threat (April 2 is the due date) instead of blunt, widespread and/or cumulative (on existing levies) increases to have helped in the background as well.
Divergence again between the US and Europe, but this time with the US Global March PMI printing substantially stronger than expected (53.5 from 51.6). Still the report contained some ‘mixed’ signals. Services activity improved sharply from 51.0 to 54.3, the highest level in 3 months. The manufacturing PMI declined from 52.7 to 49.8. Despite the overall improvement, S&P indicated that business expectations for the year ahead fell to their second lowest since October 2022 as companies grew increasingly cautious about the economic outlook. Cost pressure also intensified across the economy and fed through in selling prices, especially in manufacturing. Despite the uptick, S&P assess that the survey still points to slower growth in Q1 (1.5% Q/Qa) and that sentiment darkened further. Markets apparently gave more weight to the positives. US yields jumped after release to currently trade 6.0 to 8.0 bps higher across the curve. Despite persistent uncertainty, US equities (Nasdaq +2.0 %) and the dollar DXY (104.3) outperform. The euro initially weathered a slightly disappointing EMU PMI quite well, but dropped back to the 1.08 area after the stronger than expected US PMI. In the UK, the PMI also showed a surprise rebound (52.0 from 50.5, highest in 6 months) due to a sharp improvement in services activity (53.2). S&P also indicted a robust increases in prices charged. The reaction of UK markets was a bit mixed with only a limited changes in UK yields, but sterling performing solidly, especially against a bleak euro. EUR/GBP declined to test the 0.8350 area.
News & Views
Data published by Statistics Poland showed February real retail sales declining by 6.0% M/M to be 0.5% lower Y/Y. The outcome was substantially weaker than expected. In a monthly perspective, sales declined 13.6% for textiles, 7.1% for household goods, 4.9% for food and 3.9% for pharmaceuticals. Monthly retail sales data are notoriously volatile and Statistics Poland indicates that the data was influenced by a smaller number of trading days compared to February last year. Even so, the disappointing retail sales releases follow weaker than expected production data and softer than expected wage growth data early published last week. Recent softer than expected data question the hawkish stance from central bank governor Glapinski and might at least support the case of some of the more dovish members within the MPC to keep the debate open on possible interest rate cuts, e.g. in the second half of the year. The Polish 2-y swap yield eases 4 bps to 4.92% but the zloty remains well bid, with EUR/PLN declining to 4.176.
AUD/USD Outlook: Technical Factors Supporting a Potential Aussie Dollar Bearish Move
- The recent 5% rebound seen in the AUD/USD from its 3 February low is likely to be a minor corrective rebound.
- The medium-term downtrend phase of the AUD/USD in place since its 30 September 2024 high of 0.6943 remains intact.
- Watch the 0.6215 potential downside trigger level of the AUD/USD.
RBA’s less dovish stance and China’s stimulus are creating a floor
The Reserve Bank of Australia (RBA) has been reluctant to enter an easing cycle after its recent “hawkish cut” guidance on 18 February where it slashed its cash policy interest rate by 25 basis points (bps) to 4.1%.
Despite its first-interest rate reduction since November 2020, RBA Governor Bullock has poured “cold water” to temper down market expectations of further rate cuts during her press conference due to labour market tightness in Australia.
After the conclusion of China’s National People’s Congress in early March, top policymakers have signalled more upcoming stimulus measures to jumpstart domestic consumption in China which is also Australia’s largest trading partner.
Hence, further stimulus measures from China to offset potential aggressive trade tariffs from the US may increase China’s imports from Australia, in turn, creating a floor on the AUD/USD.
Weak momentum and narrowing of AU-US sovereign yield spread
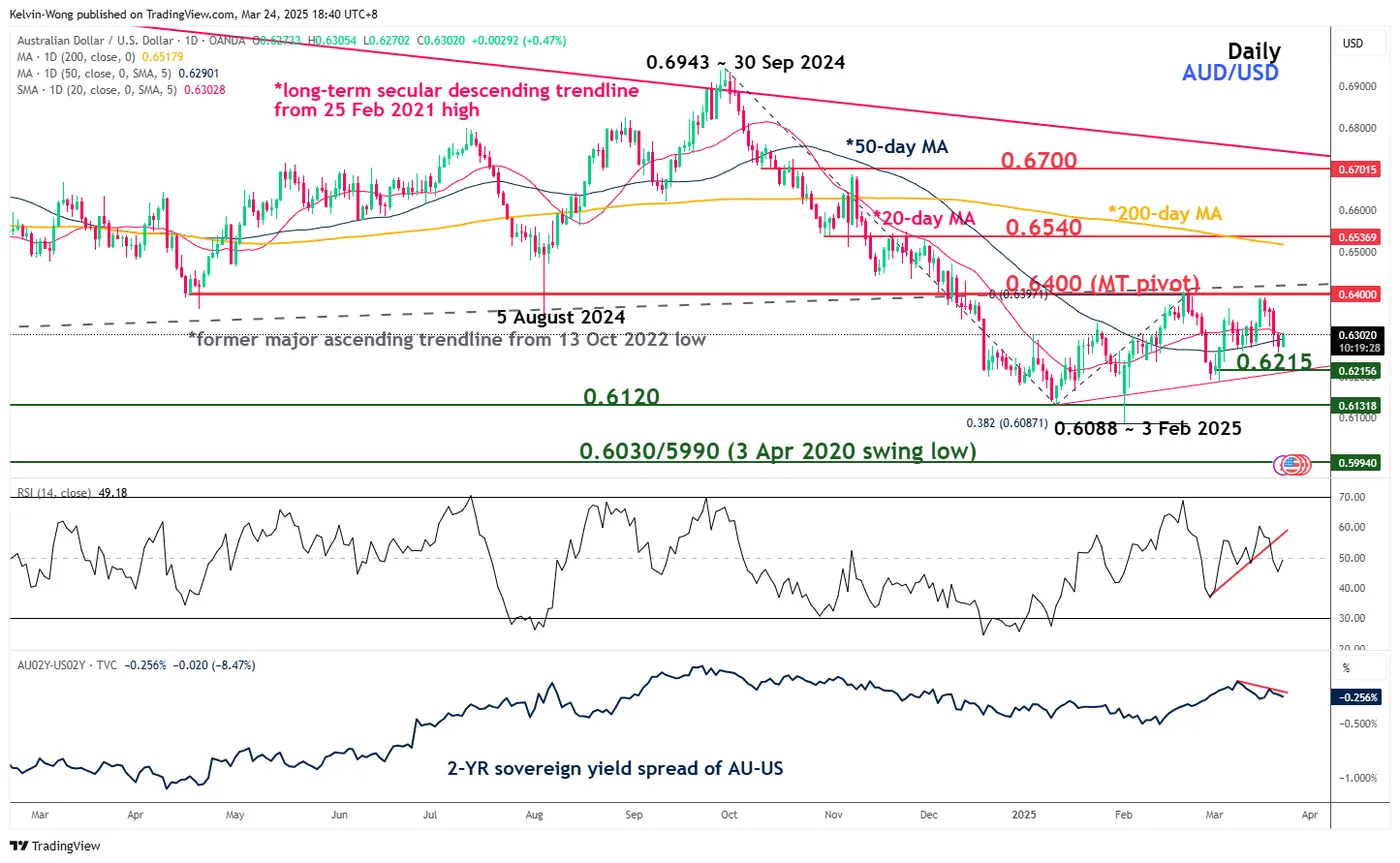
Fig 1: AUD/USD medium-term trend with 2-year AU-US sovereign yield spread as of 24 Mar 2025 (Source: TradingView, click to enlarge chart)
In the lens of technical analysis, the four weeks of up move seen on the AUD/USD from its 3 February low of 0.6088 is likely a minor corrective rebound sequence within its medium-term downtrend phase that is still in progress since the 30 September 2024 swing high of 0.6943.
The daily RSI momentum indicator broke below its ascending trendline support last Thursday, 20 March, and breached below the 50 level which suggests a lack of upside momentum.
In addition, the shorter-term 2-year yield spread between Australian government bonds and US Treasury notes (also can be used as a gauge to measure the relative difference between monetary policy stances of RBA and Fed) has started to narrow again after it printed a lower high on 20 March to hit -0.25% at this time of the writing from-0.12% on 10 March (see Fig 1).
Watch the 0.6400 key medium-term pivotal resistance on the AUD/USD and a break below the 0.6215 intermediate support (also the ascending trendline from 13 January) may trigger the start of another potential impulsive down move sequence to retest 0.6120 before the next medium-term support comes in at 0.6030/0.5990.
On the other hand, a clearance above 0.6400 invalidates the bearish scenario for a recovery towards the next medium-term resistance at 0.6540 (also close to the 200-day moving average).
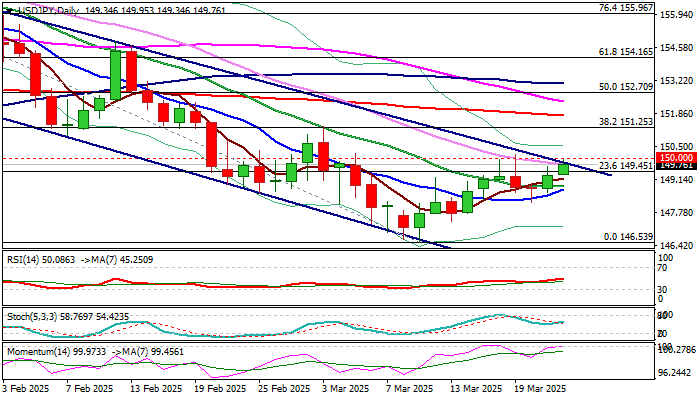
USDJPY – Bulls Attack Again Pivotal 150 Barrier
USDJPY remains constructive and attacks again key barriers at 149.80/150.00 (bear-channel upper boundary / psychological) on Monday, after a double failure at 150 level last week.
Technical picture is improving on daily chart (converging 10/20DMA’s below the price are about to form a bull-cross / RSI is heading north) but 14-d momentum continues to move sideways on the centreline ad 55/100/200 DMA’s are still in bearish configuration and partially offset positive signals.
Fundamentals are also mixed, as signals that BoJ remains on policy tightening path may offer support to yen, but would be countered by persisting hawkish stance of the US central bank and their latest signals for only two cuts in this year, mainly due to growing concerns that inflation may rise again on escalation of trade war.
Look for reaction at 150 zone for fresh direction signals, with sustained break higher to open way for fresh acceleration higher and unmask targets at 151.25 (Fibo 38.2% of 158.87/146.53) and 151.76 (200DMA).
On the other hand, repeated failure at 150 zone would weaken near-term structure, though bias to remain bullishly aligned while above 20DMA (148.85).
Res: 150.00; 150.53; 151.00; 151.25
Sup: 149.45; 148.85; 148.72; 148.18
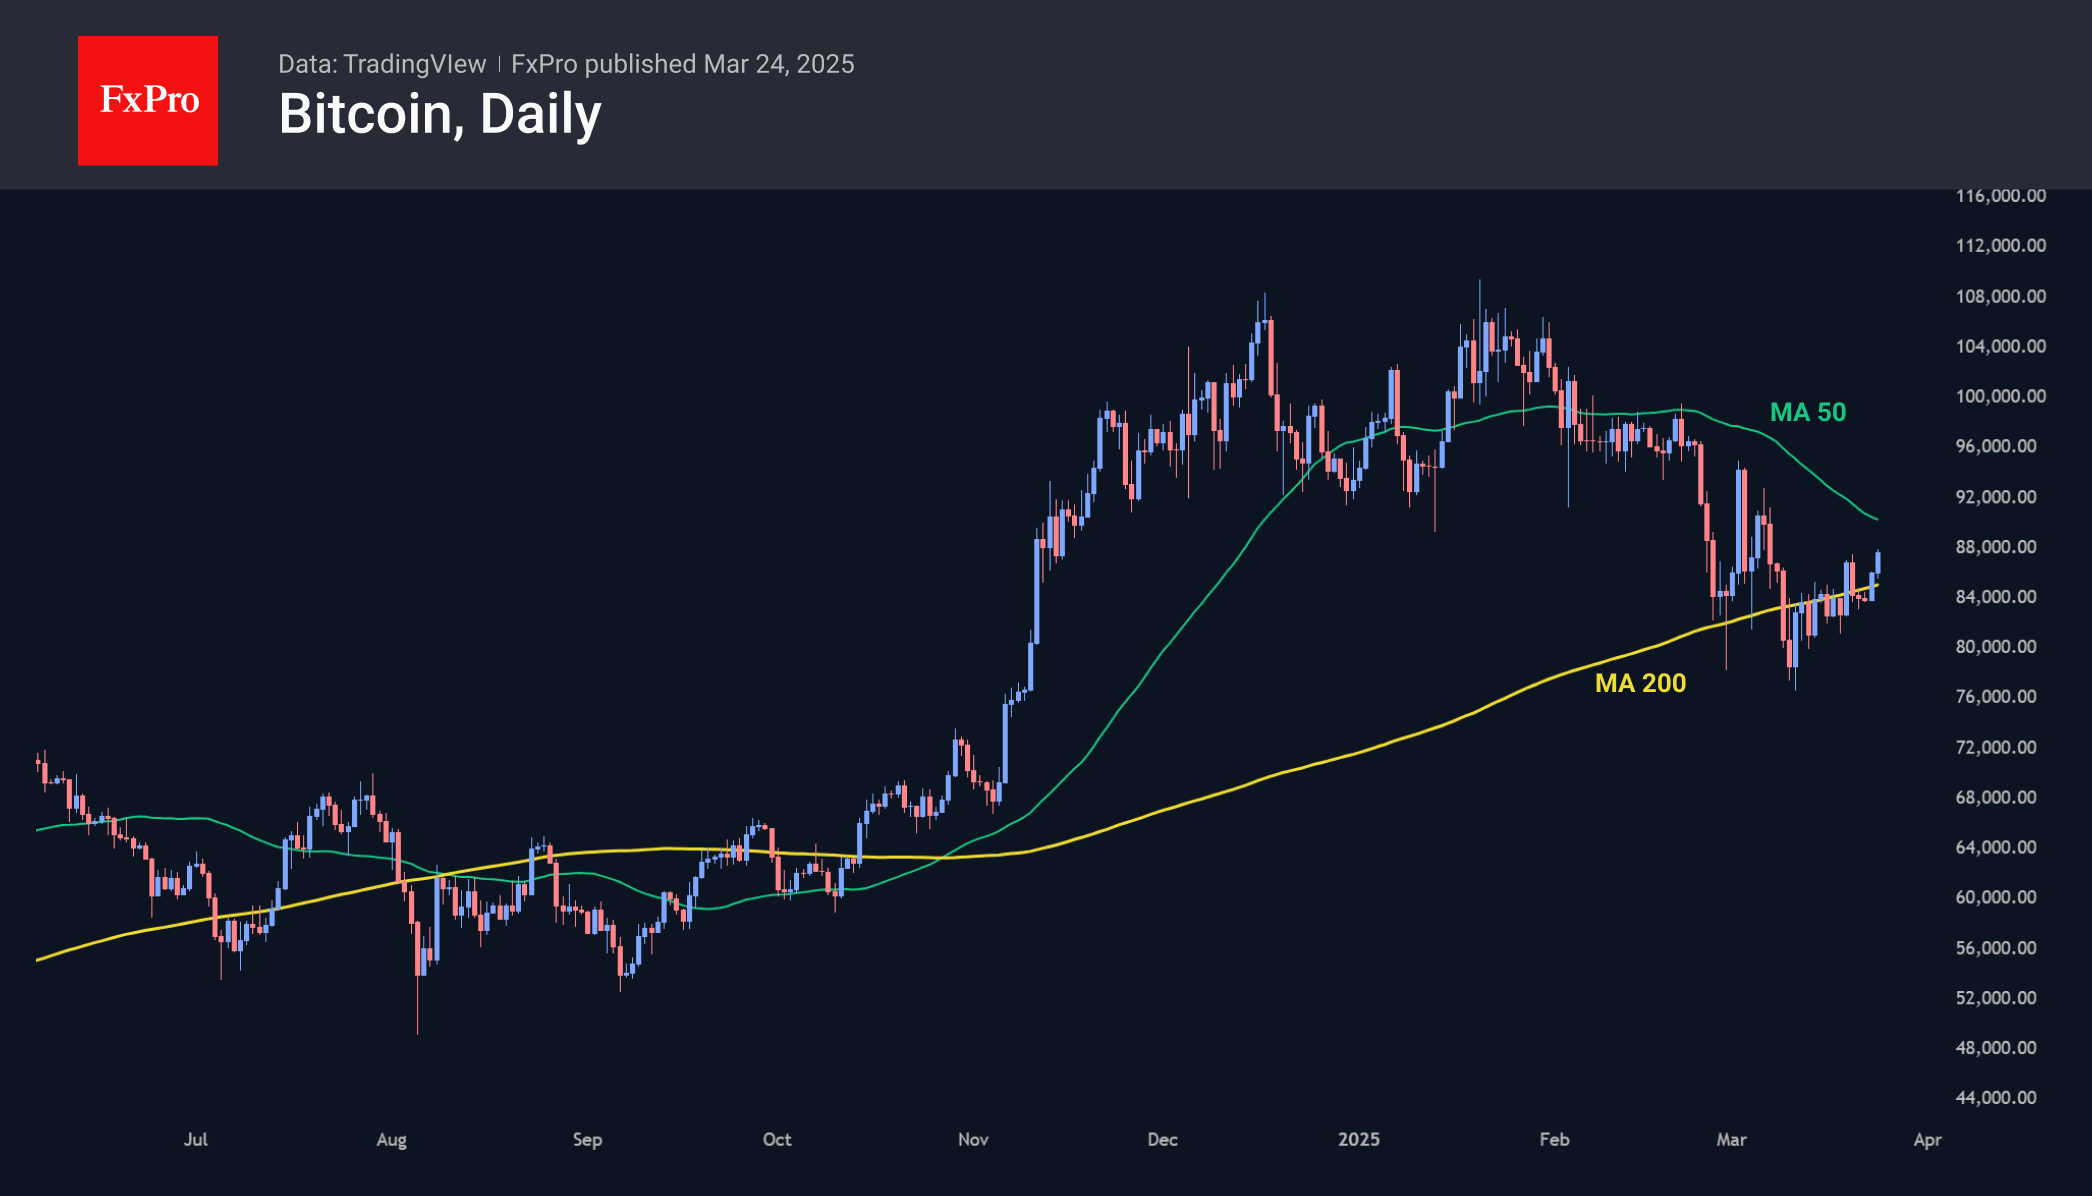
Bitcoin Pushes Up from 200-day MA
Market Picture
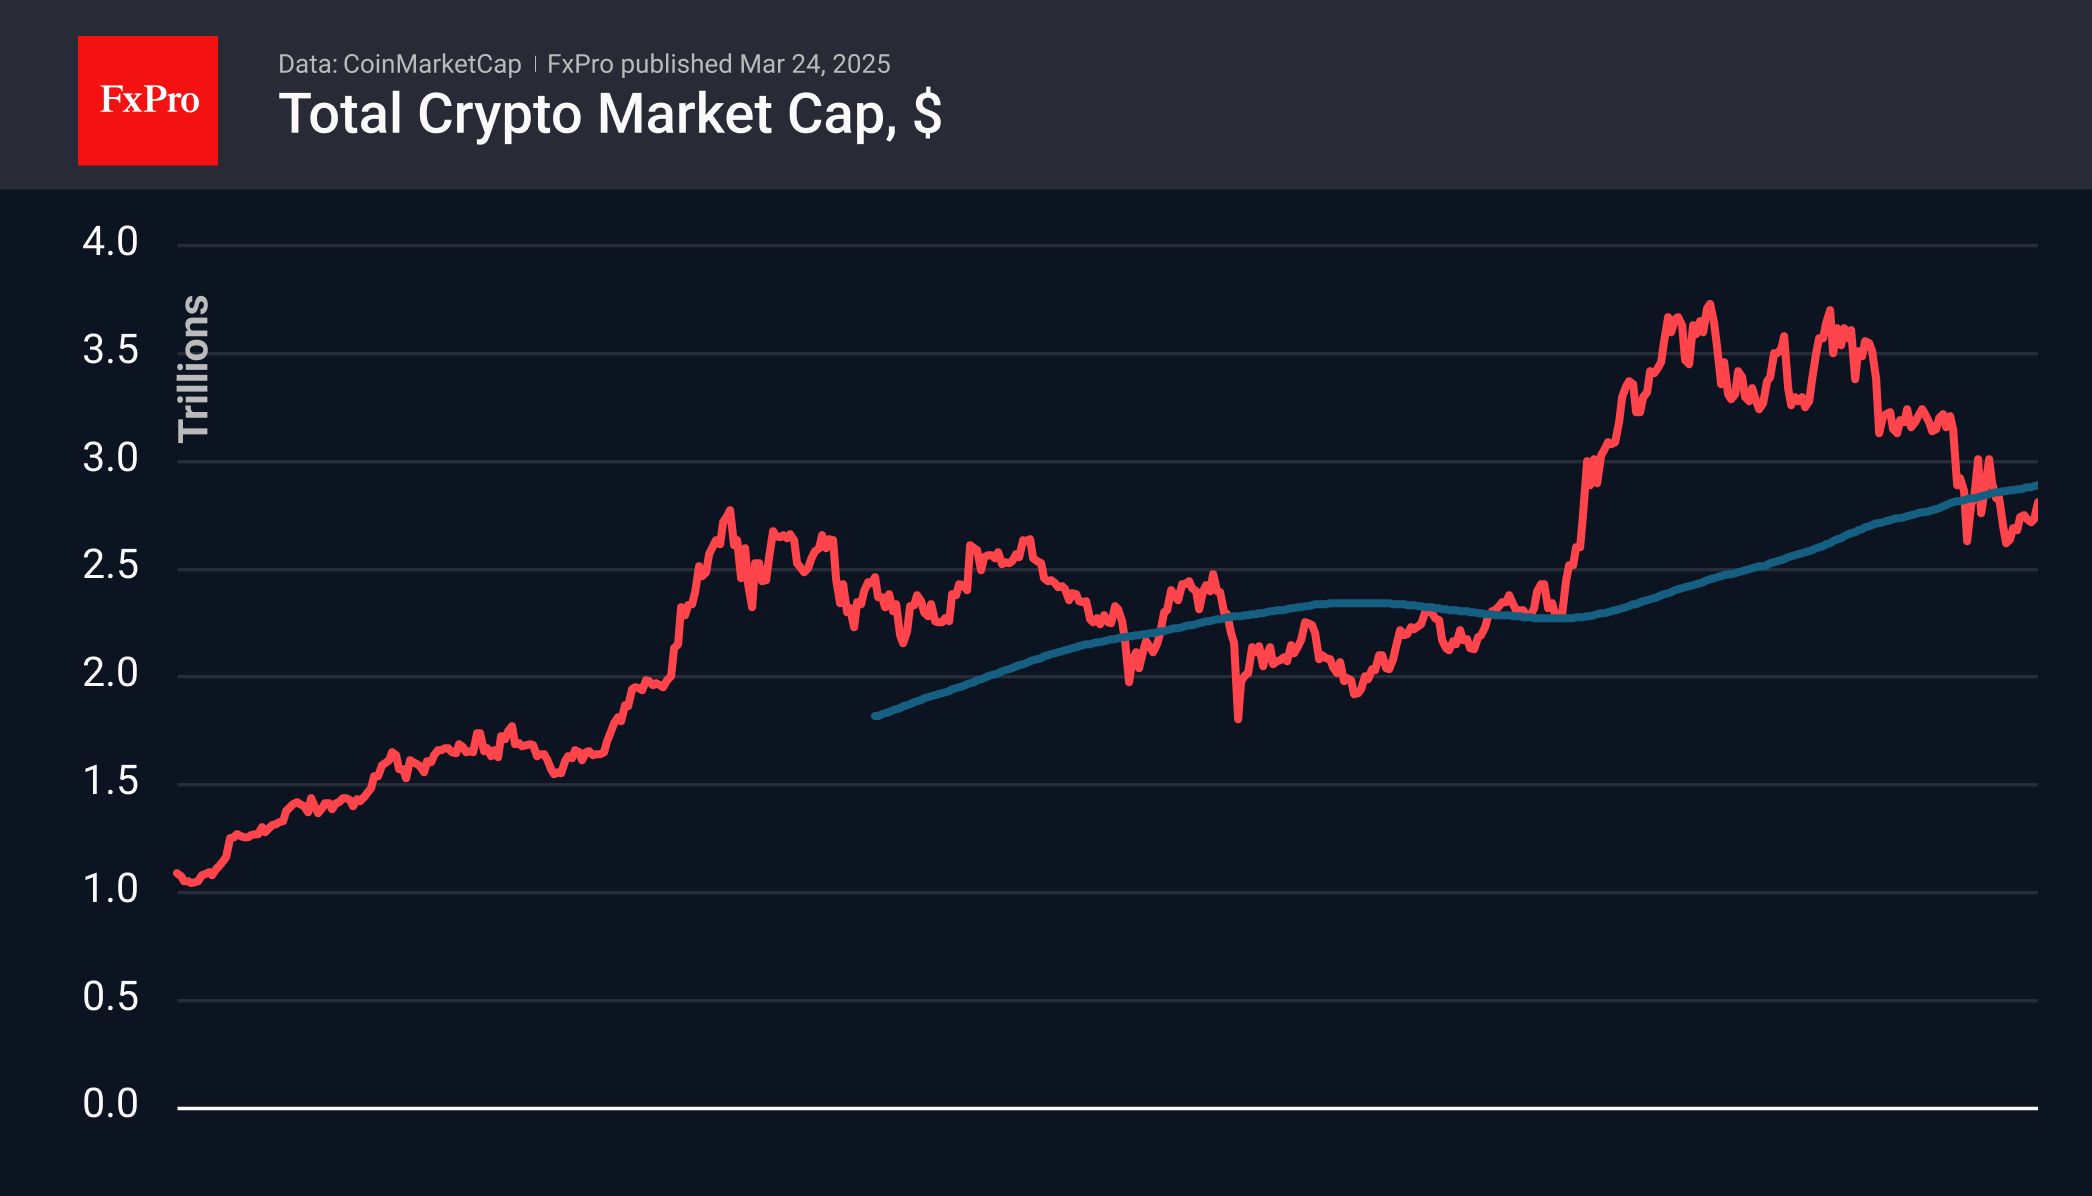
Crypto market capitalisation rose 3.2% in the last 24 hours to $2.86 trillion, the highest in two and a half weeks. The climb intensified on Sunday and accelerated early in the day on Monday. Technically, the market remains below its 200-day moving average, but the battle for the long-term trend could be the main event on Monday.
Bitcoin appears to have already won that battle of its own, pushing off its 200-day on Sunday and gaining ground on Monday. Prices at $87K repeat last week’s peaks. In our view, the bulls defended the long-term uptrend, although the price spent a long time below the key curve. Among the short-term benchmarks for buyers, we highlight $90K, where the significant round mark and the 50-day average are combined.
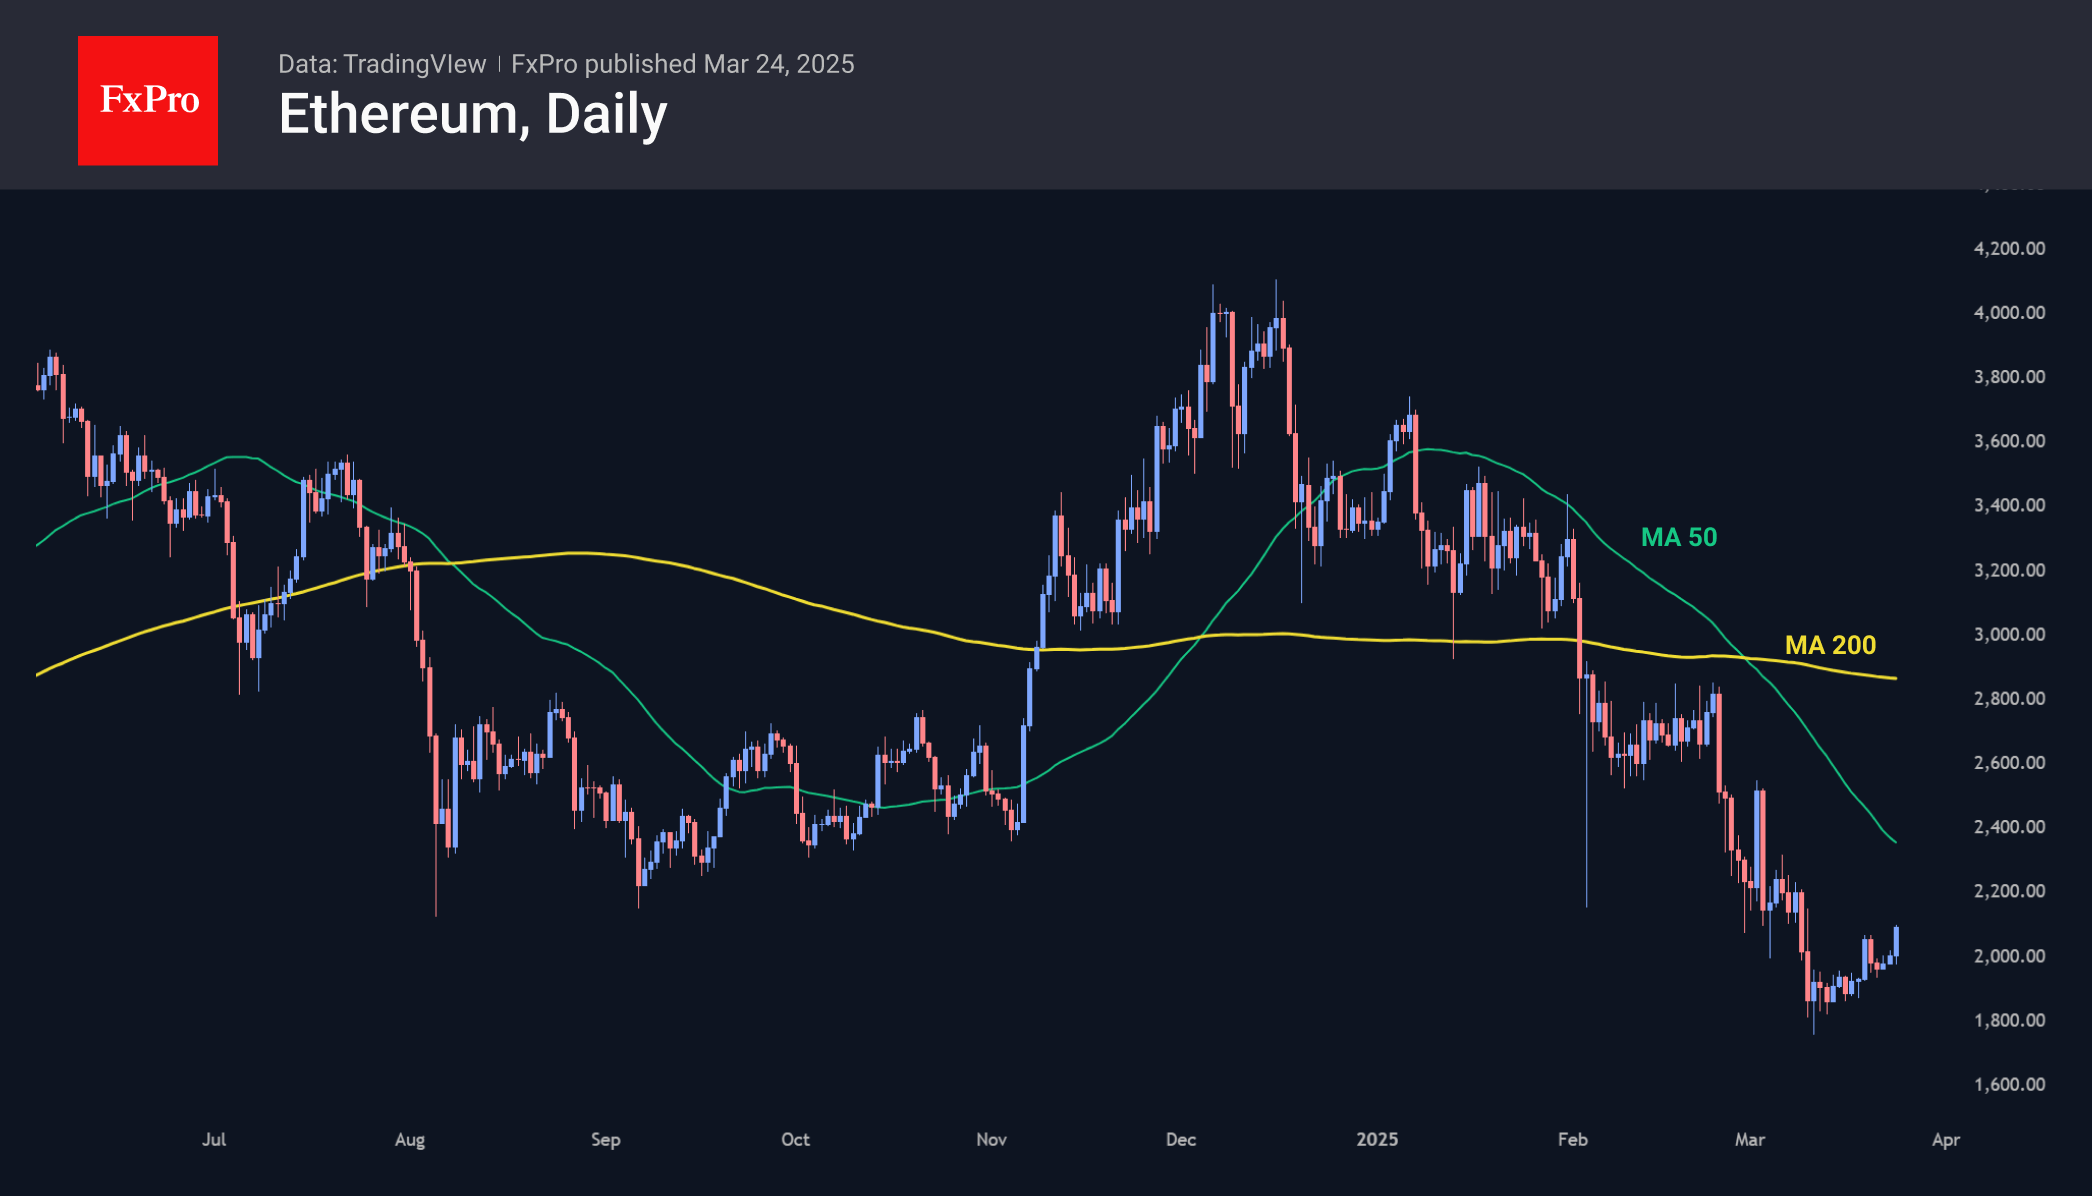
Ethereum has added over 10% in the last 24 hours, accelerating gains as it returns to the territory above $2000. That said, the second most capitalised coin has been falling for so long and has fallen so low that it will need to exceed $2,300 to break the downtrend of the past three months.
News Background
According to Santiment, the available supply of Ethereum on trading platforms has shrunk to 8.97 million ETH. This is the lowest value since November 2015, which could indicate potential growth due to the reduced supply. BlackRock expects that investor interest in Ethereum may soon recover.
The US Department of the Treasury’s Office of Foreign Assets Control (OFAC) has lifted economic sanctions on Tornado Cash. Over 100 Ethereum addresses were removed from the sanction’s lists.
Australia presented a plan to develop cryptocurrency legislation in the country. It provides for the creation of a regulated ecosystem that will combine innovation with consumer protection.
Tether, the issuer of the USDT stablecoin, intends to hire one of the Big Four audit firms to verify reserves. According to the head of Tether, this will be much easier after the Donald Trump administration comes to power. Tether was among the seven largest buyers of US Treasury bonds.
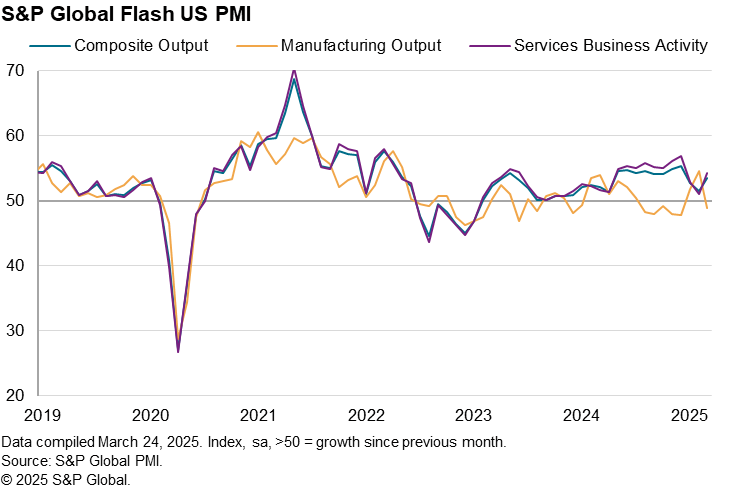
US PMI services jumps to 54.3, but manufacturing back in contraction
US economic activity accelerated at the end of Q1, led by strong rebound in the services sector. PMI Services surged from 51.0 to 54.3 in March, lifting Composite PMI from 51.6 to 53.5. However, the picture was not universally upbeat, with the Manufacturing PMI slipping back into contraction territory at 49.8, down from 52.7.
Chief Business Economist Chris Williamson noted that the data suggest annualized growth of 1.9% in March, but only 1.5% for the quarter—marking a slowdown from Q4 2024.
Williamson added that near-term risks also seem "tilted to the downside". Much of the services rebound may prove short-lived. Manufacturing's decline highlights the waning benefit from earlier "front-running of tariffs". Business confidence fell to one of the lowest levels in the past three years, with anxious over the fallout from the Trump administration’s "Federal spending cuts and tariffs."
Tariff-related inflation pressures are beginning to show. Input costs are now rising at the fastest pace in nearly two years Manufacturers, in turn, are increasingly raising prices to protect margins. Though, services inflation remains relatively tame—thanks to soft demand and competitive pricing.
EUR/USD Mid-Day Outlook
Daily Pivots: (S1) 1.0787; (P) 1.0824; (R1) 1.0852; More...
No change in EUR/USD's outlook and intraday bias stays mildly on the downside. Correction from 1.0953 short term top would extend to 38.2% retracement of 1.0358 to 1.0953 at 1.0726. Strong support should be seen there to bring rebound. On the upside, break of 1.0953 will resume the rally from 1.0176 towards 1.1274 key resistance.
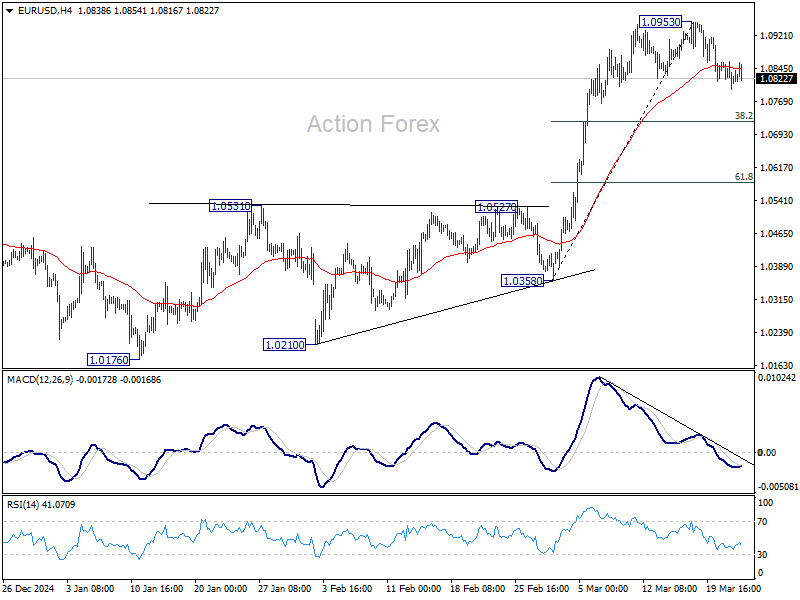
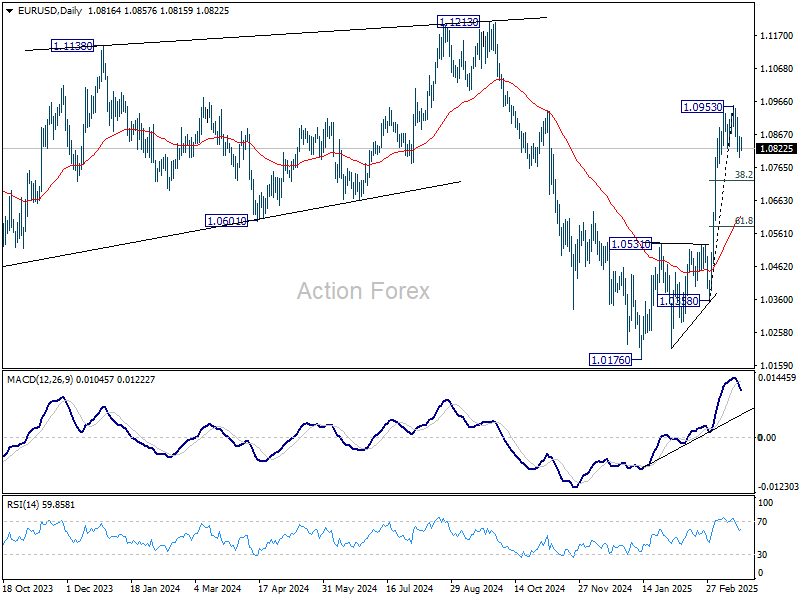
In the bigger picture, prior strong break of 55 W EMA (now at 1.0675) suggests that fall from 1.1274 (2024 high) has completed as a three wave correction to 1.0176. Rise from 0.9534 is still intact, and might be ready to resume. Decisive break of 1.1274 will target 100% projection of 0.9534 to 1.1274 from 1.0176 at 1.1916. Also, that will send EUR/USD through a multi-decade channel resistance will carries larger bullish implication. This will now be the favored case as long as 1.0531 resistance turned support holds.
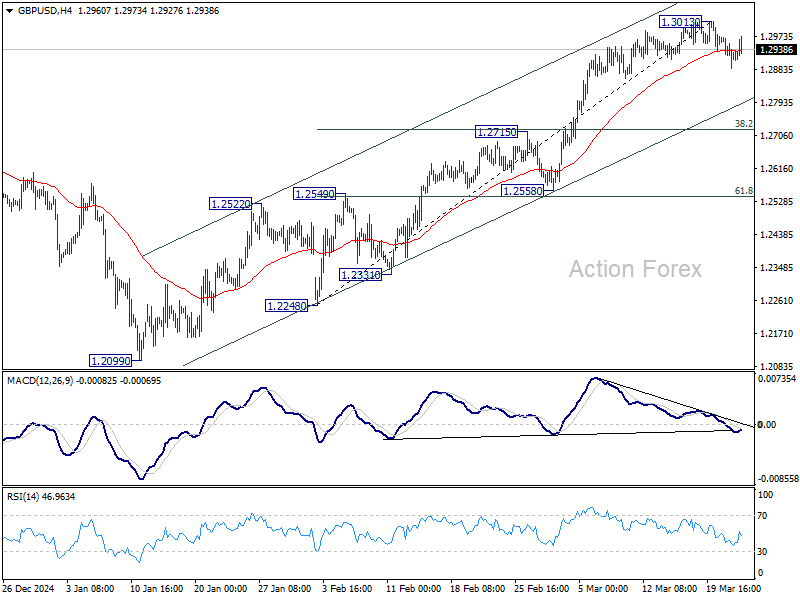
GBP/USD Mid-Day Outlook
Daily Pivots: (S1) 1.2878; (P) 1.2926; (R1) 1.2965; More...
Intraday bias in GBP/USD stays mildly on the downside despite today's recovery. Correction from 1.3013 short term top would extend to 38.2% retracement of 1.2248 to 1.3013 at 1.2721. Strong support should be seen there to bring rebound. On the upside, break of 1.3013 will resume the rally from 1.2099.
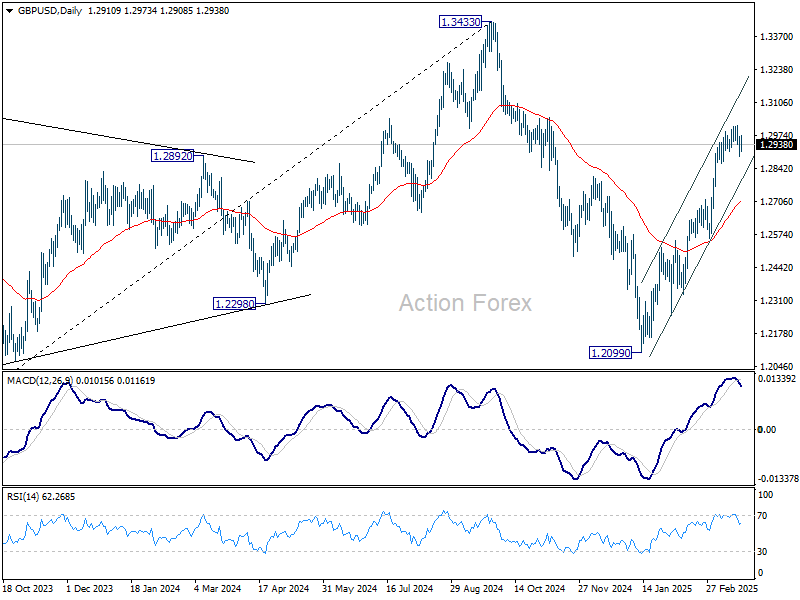
In the bigger picture, up trend from 1.3051 (2022 low) is not completed. Resumption is expected after corrective pattern from 1.3433 completes. Next target will be 1.4248 key resistance. This will now remain the favored case as long as 1.2099 support holds.
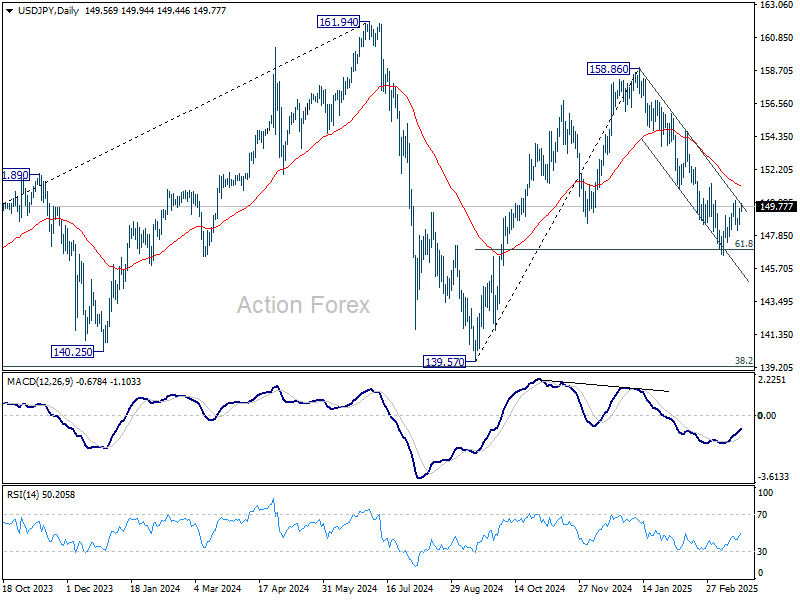
USD/JPY Mid-Day Outlook
Daily Pivots: (S1) 148.71; (P) 149.19; (R1) 149.79; More...
Intraday bias in USD/JPY remains neutral for the moment. Recovery from 146.52 is seen as a corrective move. In case of stronger rise, upside should be limited by 150.92 support turned resistance. On the downside, break of 148.17 support will bring retest of 146.52 first. Sustained trading below 61.8% retracement of 139.57 to 158.86 at 146.32 will resume the fall from 158.86 to 139.57 support.
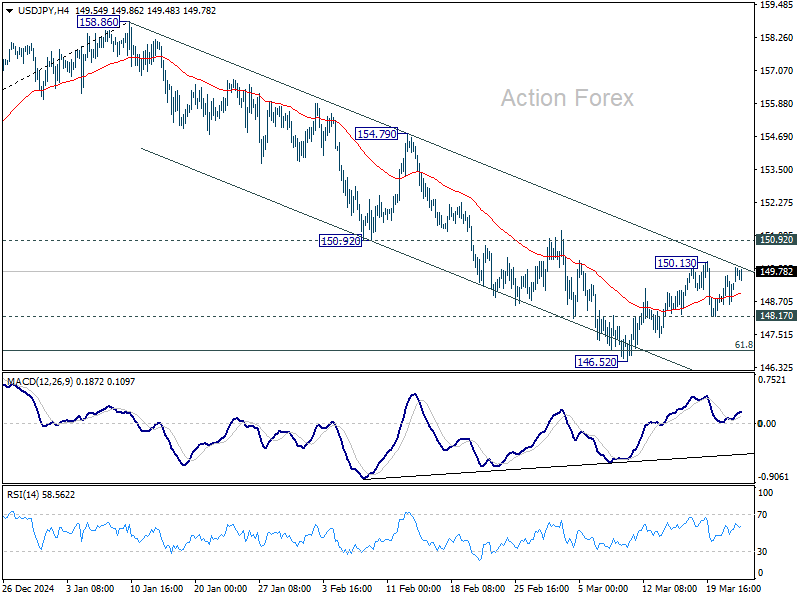
In the bigger picture, price actions from 161.94 are seen as a corrective pattern to rise from 102.58 (2021 low), with fall from 158.86 as the third leg. Strong support should be seen from 38.2% retracement of 102.58 to 161.94 at 139.26 to bring rebound. However, sustained break of 139.26 would open up deeper medium term decline to 61.8% retracement at 125.25.
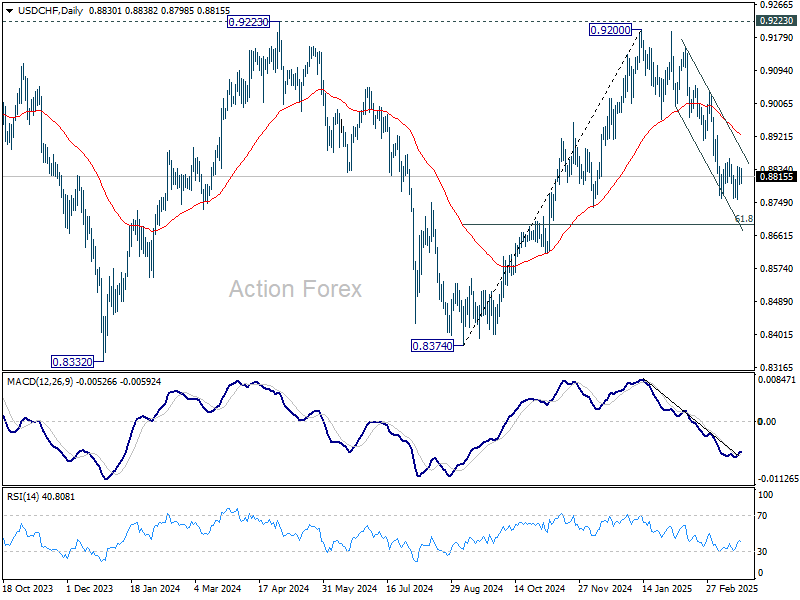
USD/CHF Mid-Day Outlook
Daily Pivots: (S1) 0.8805; (P) 0.8823; (R1) 0.8849; More…
No change in USD/CHF's outlook as consolidations continue in established range above 0.8757. In case of stronger recovery, upside should be limited by 0.8911 support turned resistance. On the downside, break of 0.8757 will resume the fall from 0.9200 to 61.8% retracement of 0.8374 to 0.9200 at 0.8690. Sustained break there will pave the way back to 0.8374 support.
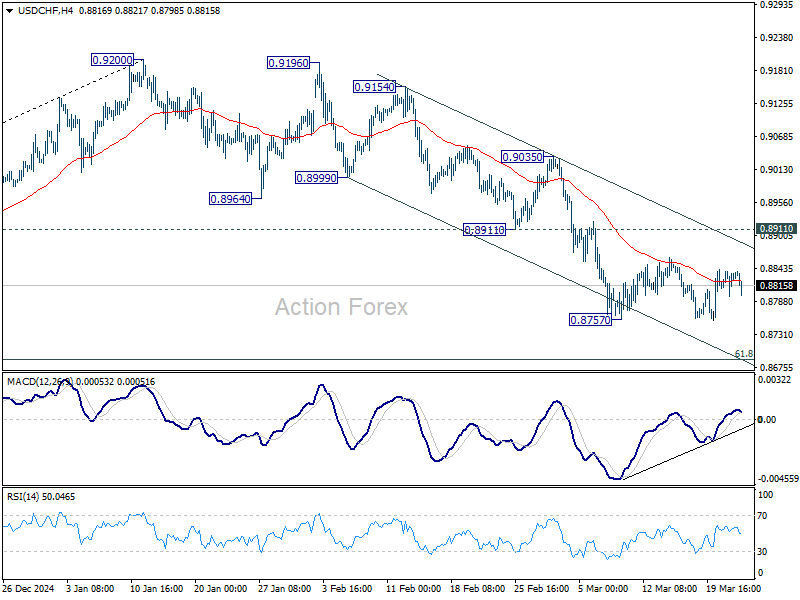
In the bigger picture, rejection by 0.9223 key resistance keep medium term outlook bearish. That is, larger fall from 1.0342 (2017 high) is not completed yet. Firm break of 0.8332 (2023 low) will confirm down trend resumption.