Sample Category Title
EUR/JPY Daily Outlook
Daily Pivots: (S1) 162.01; (P) 162.53; (R1) 163.50; More...
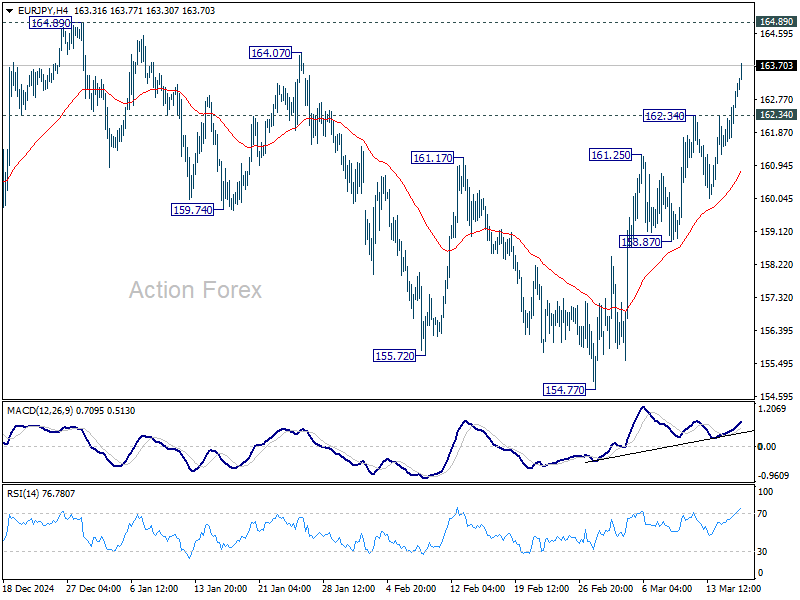
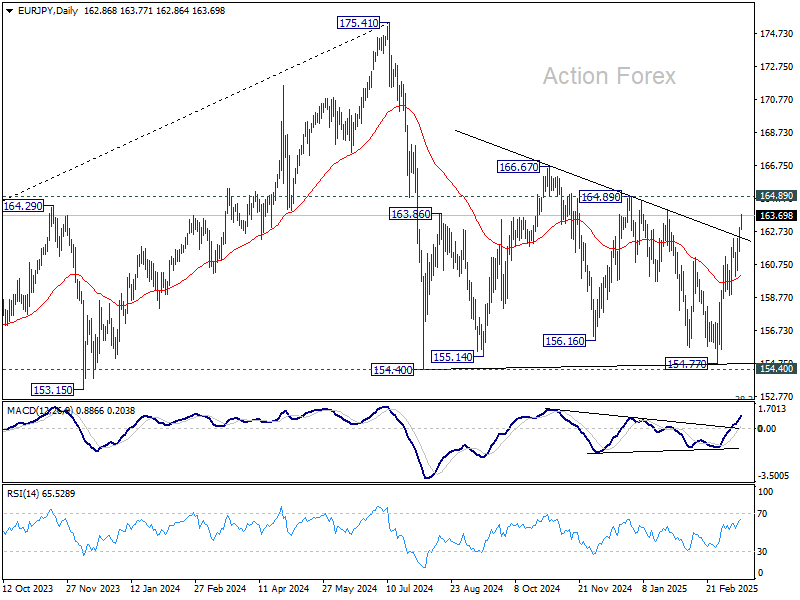
Intraday bias in EUR/JPY is back on the upside with strong break of 162.34 temporary top. Rise from 154.77, as another rising leg in the consolidation from 154.40, should target 164.89 resistance. On the downside, below 162.34 will turn intraday bias neutral again and bring consolidations first.
In the bigger picture, price actions from 175.41 are seen as correction to rally from 114.42 (2020 low). Strong support should be seen from 38.2% retracement of 114.42 to 175.41 at 152.11 to contain downside. However, sustained break of 152.11 will bring deeper fall even still as a correction.
EUR/GBP Daily Outlook
Daily Pivots: (S1) 0.8397; (P) 0.8408; (R1) 0.8418; More...
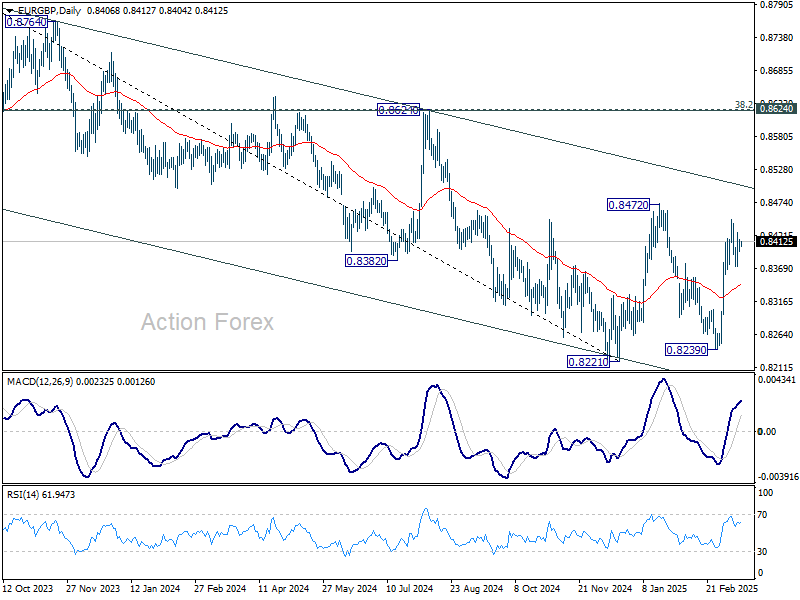
EUR/GBP is staying in consolidation below 0.8448 and intraday bias stays neutral. Further rally is expected as long as 0.8358 minor support holds. On the upside, break of 0.8448 will target 0.8472 resistance first. Firm break there will resume whole rebound from 0.8221 to medium term falling channel resistance (now at 0.8508). Nevertheless, break of 0.8358 will suggest that rise from 0.8239 has completed and turn bias back to the downside instead.
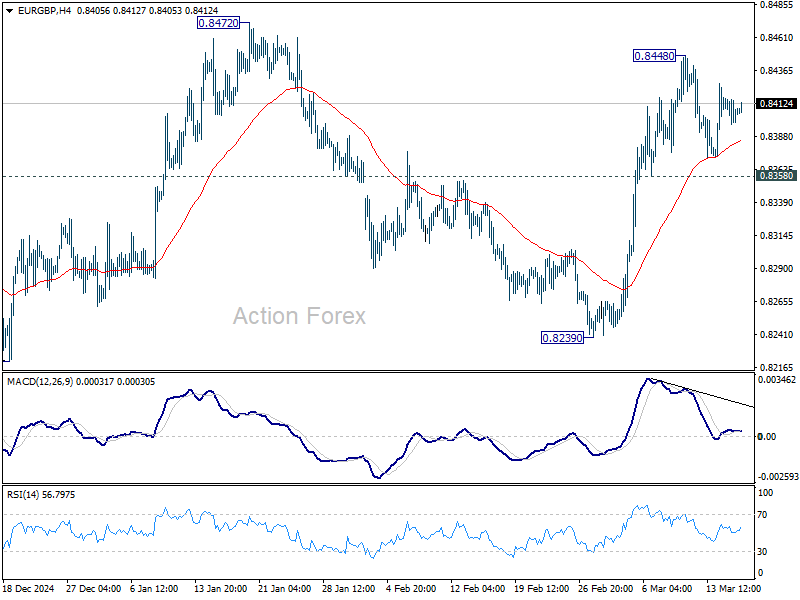
In the bigger picture, EUR/GBP is still bounded inside medium term falling channel. While rebound from 0.8221 might extend higher, it could still develop into a corrective pattern. Overall outlook will be neutral at best and down trend from 0.9267 (2022 high) could extend, at least until decisive break of channel resistance (now at 0.8508).
EUR/AUD Daily Outlook
Daily Pivots: (S1) 1.7051; (P) 1.7141; (R1) 1.7195; More...
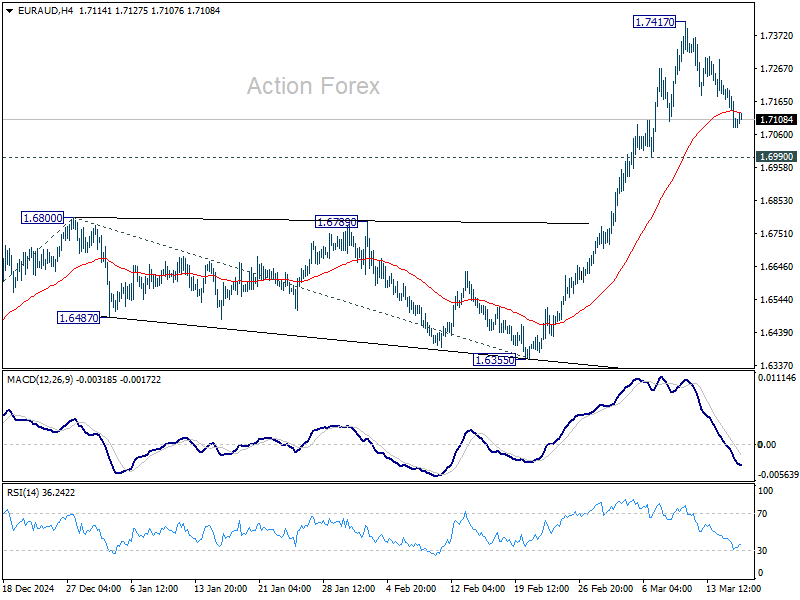
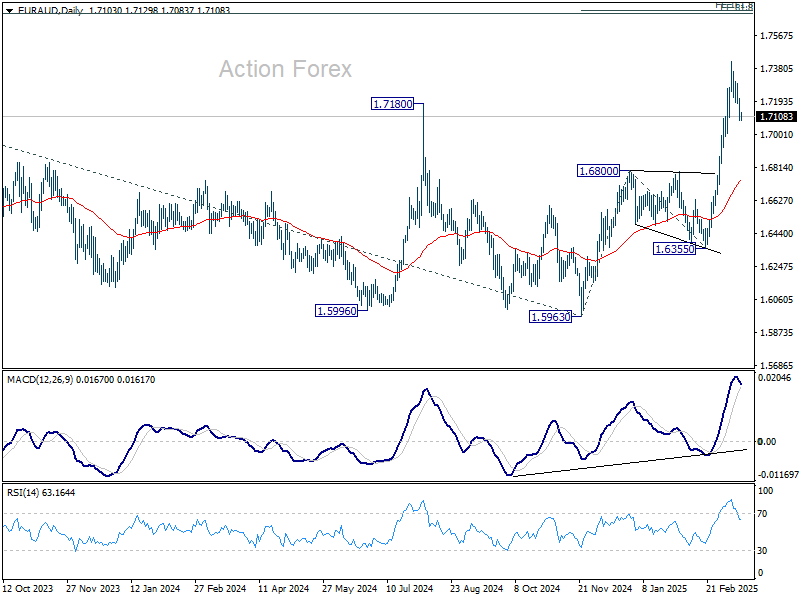
Intraday bias in EUR/AUD stays neutral at this point, and more consolidations would be seen below 1.7417. Downside of retreat should be contained by 0.6990 support to bring rebound. On the upside, break of 1.7417 will resume rise from 1.6335 to 161.8% projection of 1.5963 to 1.6800 from 1.6355 at 1.7709 next.
In the bigger picture, the breach of 1.7180 key resistance (2024 high) suggests that up trend from 1.4281 (2022 low) is resuming. Sustained trading above 1.7180 will confirm and target 61.8% projection of 1.4281 to 1.7062 from 1.5963 at 1.7682, which is also close to 61.8% retracement of 1.9799 (2020 high) to 1.4281 at 1.7691. For now, this will remain the favored case as long as 1.6800 resistance turned support holds, even in case of deep pullback.
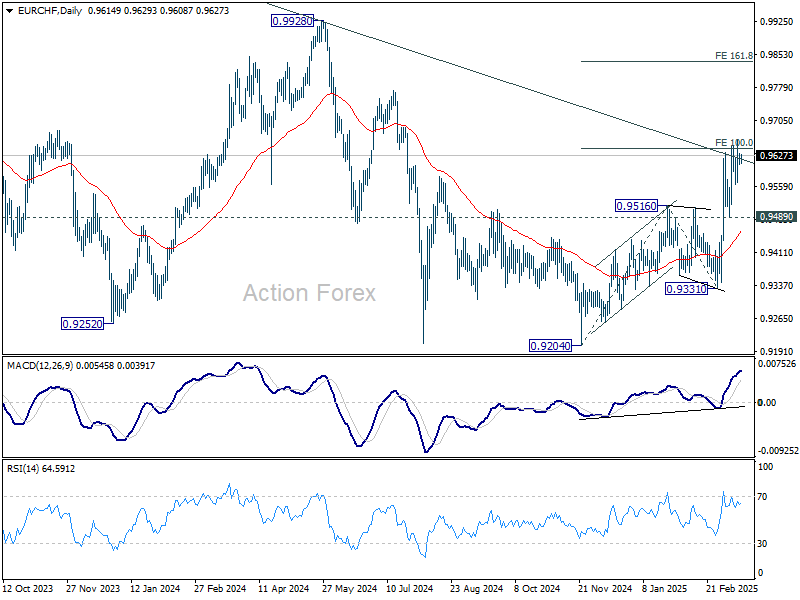
EUR/CHF Daily Outlook
Daily Pivots: (S1) 0.9607; (P) 0.9622; (R1) 0.9636; More....
No change in EUR/CHF's outlook and intraday bias stays neutral first. Further rise is expected as long as 0.9489 support holds. Sustained trading above 100% projection of 0.9204 to 0.9516 from 0.9331 at 0.9643 will pave the way to 161.8% projection at 0.9836 next.
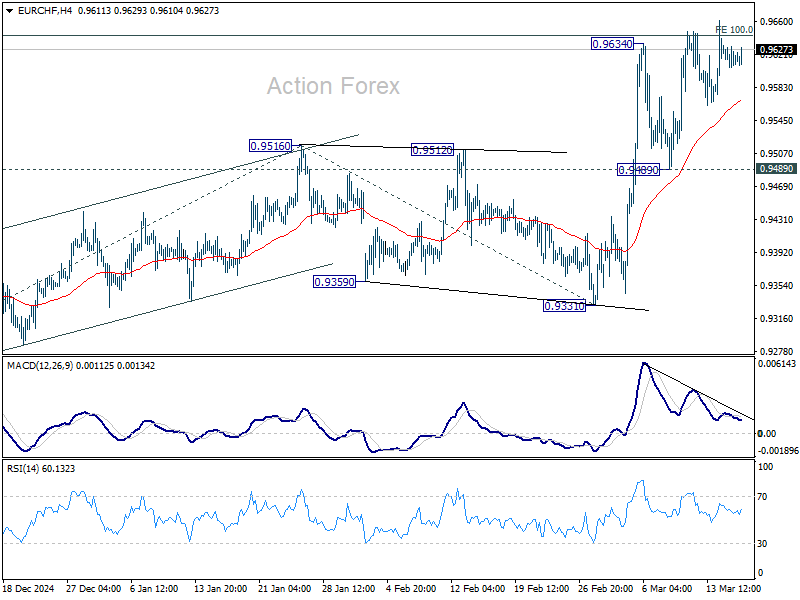
In the bigger picture, prior strong break of 55 W EMA (now at 0.9487) is a medium term bullish sign. Sustained break trading above long-term falling channel resistance (at around 0.9620) would suggest that the downtrend from 1.2004 (2018 high) has bottomed at 0.9204. Stronger rally should then be see to 0.9928 key resistance at least.
Market Focus on Germany Rubberstamping a Historical Debt Deal
Markets
Yesterday’s final input to the Fed meeting on Wednesday won’t change the status quo decision that’s expected. February core retail sales were decent but in some cases merely rebounded from a weak January while the NY manufacturing index added to a growing stagflationary narrative. US yields whipsawed to finish between -2.8 and +2.8 bps in a flattening move. German Bunds greatly outperformed in what is perhaps some buy the rumour, sell the fact short covering ahead of today’s key vote in the German parliament on the debt package. It’s mere size, a €500bn special infrastructure fund and a de facto blank cheque for defense spending, should serve as solid bottom below yields, making yesterday’s correction potentially a short-lived one. Risk sentiment was positive, spurring equity gains between 0.3-0.9% in Europe and the US. Cyclicals and smaller currencies stood to benefit. The likes of AUD and NZD outperformed, helped higher by new Chinese stimulus initiatives which focus on domestic demand. At the other spectrum there’s JPY and USD. The trade-weighted dollar index finished at a five-month low (103.37). The euro lost against most peers too but nevertheless gained against the US currency. EUR/USD closed above 1.09. EUR/GBP held steady north of 0.84 in technical trading.
Asian dealings this morning happen against a constructive background. Regional stocks eke out gains up to 2% in the wake of yesterday’s performance on WS. There is little news to support the moves though. Tariff fears moved a bit to the background for the time being with the next key date some time away still. The US plans to install reciprocal tariffs on April 2. There is heavy debate on how these should look like with proposals ranging from complex methods such as taxing individual countries and products to simplified ones by applying a layered, three-tier system with low, medium and high tariff rates. Today, though, market focus will be on Germany rubberstamping a historical debt deal and the talks between US president Trump and his Russian counterpart Putin. Especially the latter is a wildcard for trading. One of the objectives is probably to have Putin agree to the 30-day ceasefire, signed off earlier by the US and Ukraine. The devil (for Ukraine and Europe altogether) will be in the details but a truce for markets should be positive regardless. Bunds may underperform Treasuries in a daily perspective. EUR/USD is moving towards first resistance of 1.0937 (November correction high). This is only a minor hurdle before moving towards the 1.12-area.
News & Views
Assistant governor of the Reserve Bank of Australia (RBA) Sarah Hunter confirmed the recent assessment of other board members including governor Michelle Bullock that the RBA is more cautious than the market about the prospect for further rate cuts. The RBA at the February meeting for the first time reduced its policy rate by 25 bps to 4.10% after having kept it unchanged since November 2023. It said then it was the right time to take away some of the restrictiveness. But there is a lot of uncertainty about the RBA’s forecasts, in particular with respect to the policy steps taken in the US, Hunter indicated. With respect to domestic developments in Australia, Hunter said that the pick-up in household consumption in Q4 of last year was not a temporary bounce, but a genuine improvement in the underlying momentum. Markets currently see a chance of about 70% of an additional rate cut at the May meeting. A third rate cut is discounted by autumn. The Aussie dollar recently bottomed against a weakening dollar and recently drew some comfort from China preparing additional measures to support domestic demand. AUD trades near 0.637, compared to sub 0.615 levels in January.
Bloomberg referring to people familiar with the deliberations reported that US Trade Representative Jamieson Greer is trying to take control of the process of tariffs announcements on April 2 as he tries to inject order into this sweeping process. According to the Bloomberg article, Greer has reinstated parts of a traditional policy process that were missing from prior tariffs imposed on Canada, Mexico, China and metals by asking for public comments on the reciprocal duties. That gives the trade office a formal way to receive feedback from businesses and other stakeholders. Greer is also said to take those requests into account when setting up the tariff program. Bloomberg also refers to a formula for a single rate for each country based on that nation’s average tariff level and other measures the Trump team considers discriminatory.
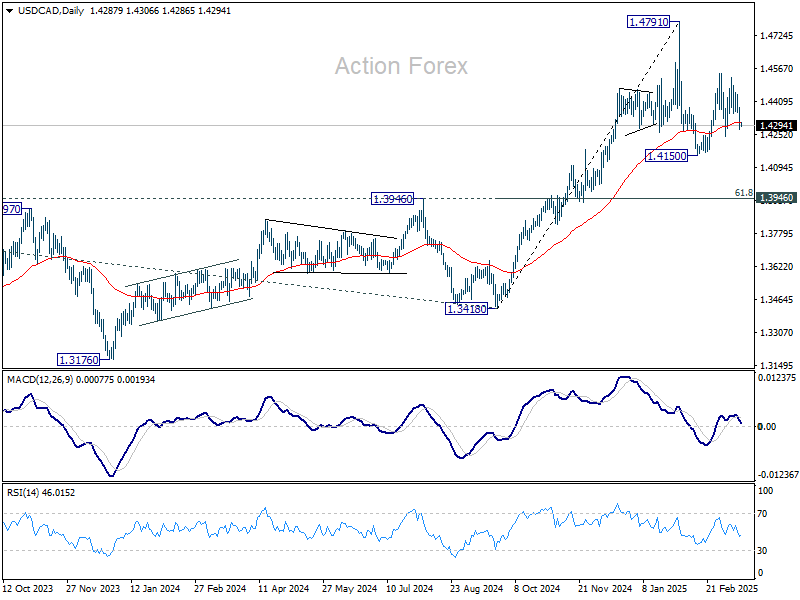
USD/CAD Daily Outlook
Daily Pivots: (S1) 1.4246; (P) 1.4315; (R1) 1.4355; More...
Intraday bias in USD/CAD stays neutral first as range trading continues. On the downside, break of 1.4238 support will argue that corrective pattern from 1.4791 has started the third leg already. Intraday bias will be back on the downside for 1.4150 support and below. On the upside, though, break of 1.4541 will resume the rebound from 1.4150, as the second leg of the pattern.
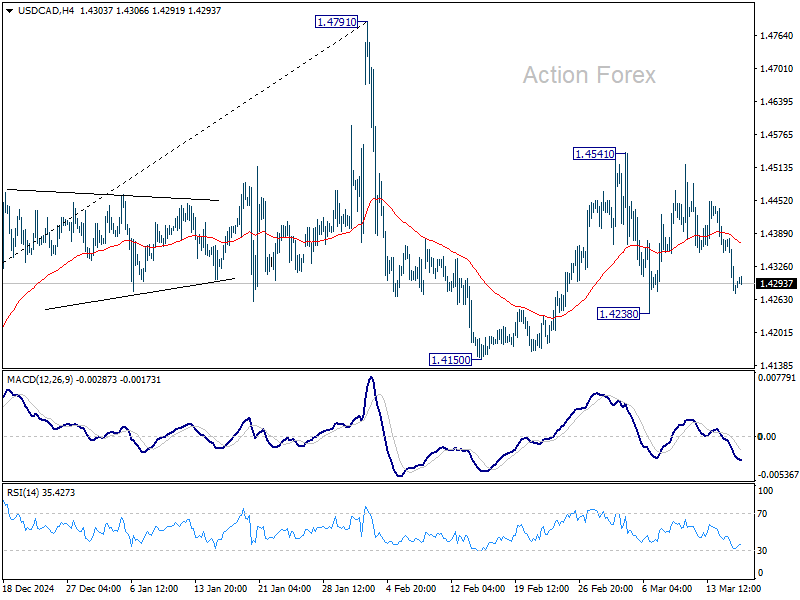
In the bigger picture, long term up trend is tentatively seen as resuming with prior breach of 1.4667/89 key resistance zone (2020/2015 highs). Next target is 100% projection of 1.2401 to 1.3976 from 1.3418 at 1.4993. This will remain the favored case as long as 1.3976 resistance turned support holds (2022 high), even in case of deep pullback.
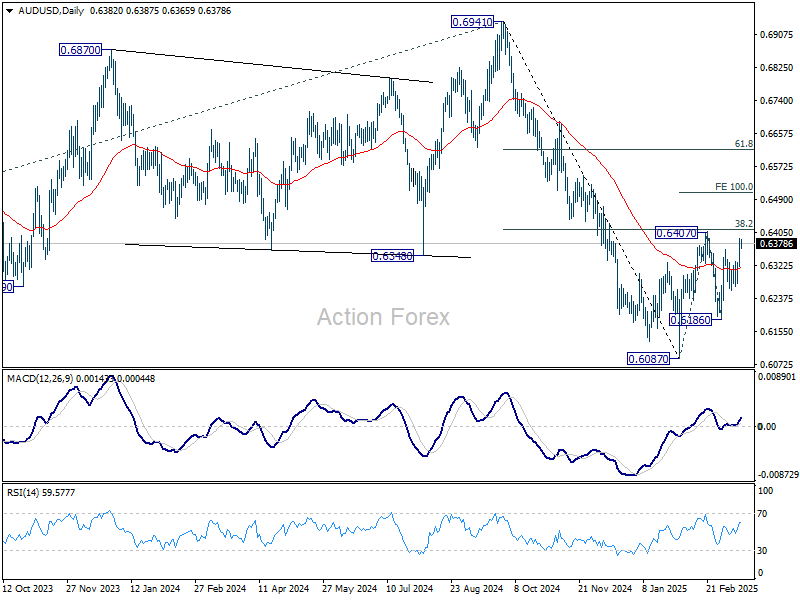
AUD/USD Daily Report
Daily Pivots: (S1) 0.6336; (P) 0.6364; (R1) 0.6412; More...
No change in AUD/USD's outlook and intraday bias stays neutral. On the upside, sustained break of 0.6407 will resume the rebound from 0.6087 to 100% projection of 0.6087 to 0.6407 from 0.6186 at 0.6506, even still as a corrective move. On the downside, break of 0.6186 will target 0.6087 support first.
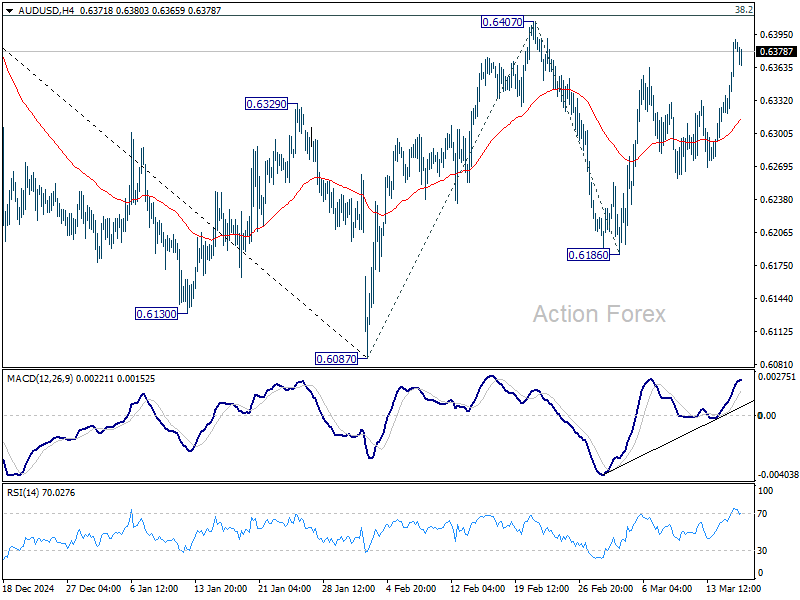
In the bigger picture, fall from 0.6941 (2024 high) is seen as part of the down trend from 0.8006 (2021 high). Next medium term target is 61.8% projection of 0.8006 to 0.6169 from 0.6941 at 0.5806. In any case, outlook will stay bearish as long as 55 W EMA (now at 0.6482) holds.
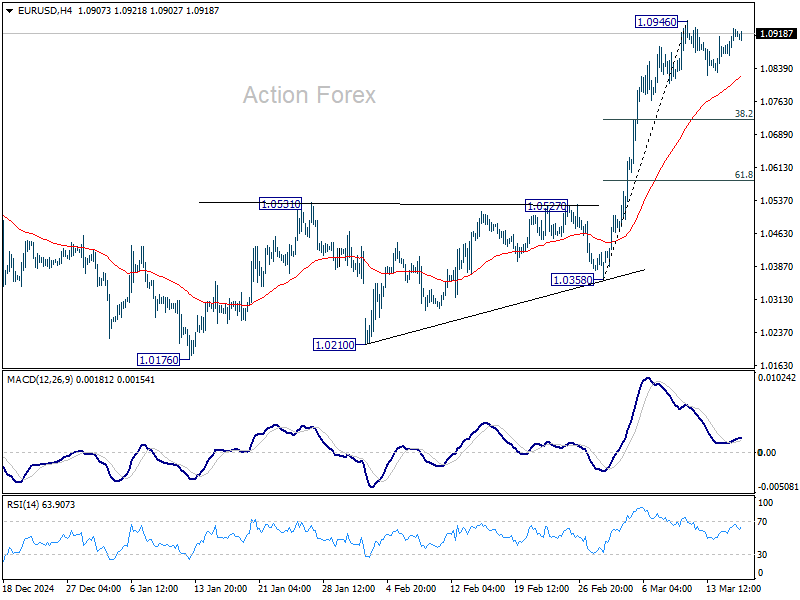
EUR/USD Daily Outlook
Daily Pivots: (S1) 1.0884; (P) 1.0906; (R1) 1.0945; More...
Intraday bias in EUR/USD remains neutral as consolidations continue below 1.0946. In case of another fall, downside should be contained by 38.2% retracement of 1.0358 to 1.0946 at 1.0721 to bring rebound. On the upside, break of 1.0946 will resume the rally from 1.0176 to retest 1.1274 key resistance.
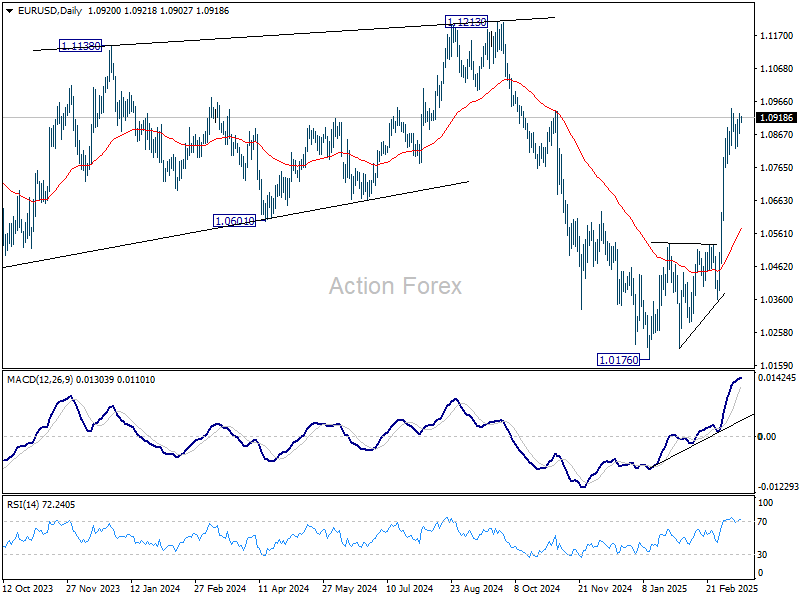
In the bigger picture, prior strong break of 55 W EMA (now at 1.0675) suggests that fall from 1.1274 (2024 high) has completed as a three wave correction to 1.0176. Rise from 0.9534 is still intact, and might be ready to resume. Decisive break of 1.1274 will target 100% projection of 0.9534 to 1.1274 from 1.0176 at 1.1916. Also, that will send EUR/USD through a multi-decade channel resistance will carries larger bullish implication. This will now be the favored case as long as 1.0531 resistance turned support holds.
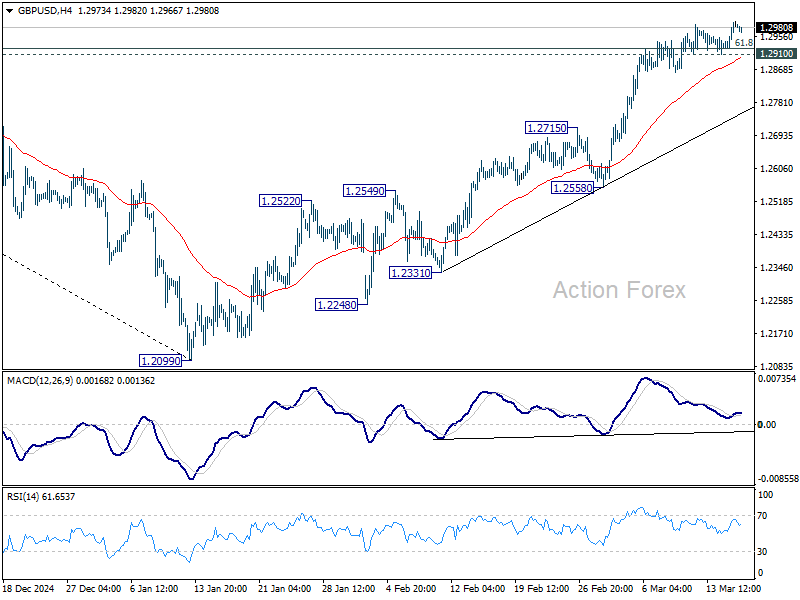
GBP/USD Daily Outlook
Daily Pivots: (S1) 1.2940; (P) 1.2970; (R1) 1.3020; More...
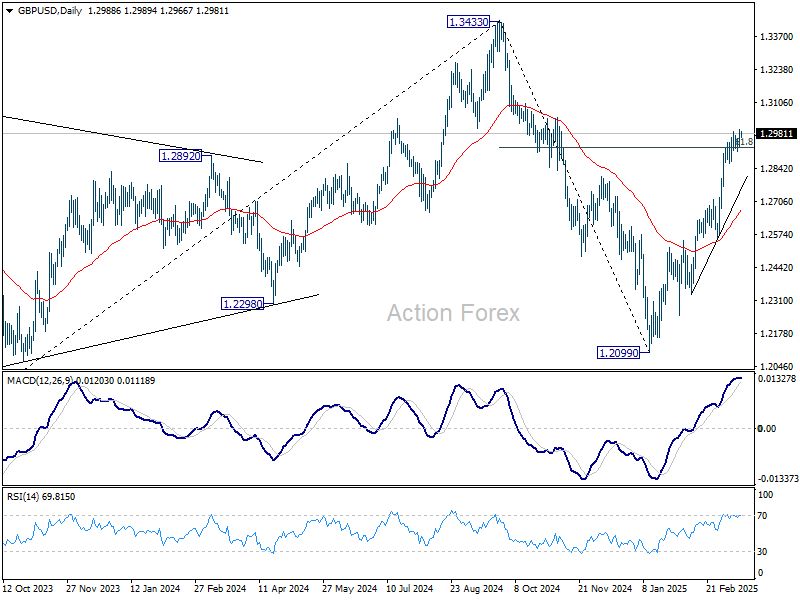
While upside momentum in GBP/USD is unconvincing as seen in 4H MACD, further rally is expected as long as 1.2910 support holds. Sustained trading above 61.8% retracement of 1.3433 to 1.2099 at 1.2923 will pave the way back to 1.3433 high. However, break of 1.2910 will indicate short term topping, and turn bias back to the downside for deeper pullback.
In the bigger picture, up trend from 1.3051 (2022 low) is not completed. Resumption is expected after corrective pattern from 1.3433 completes. Next target will be 1.4248 key resistance. This will now remain the favored case as long as 1.2099 support holds.
USD/CHF Daily Outlook
Daily Pivots: (S1) 0.8786; (P) 0.8821; (R1) 0.8844; More…
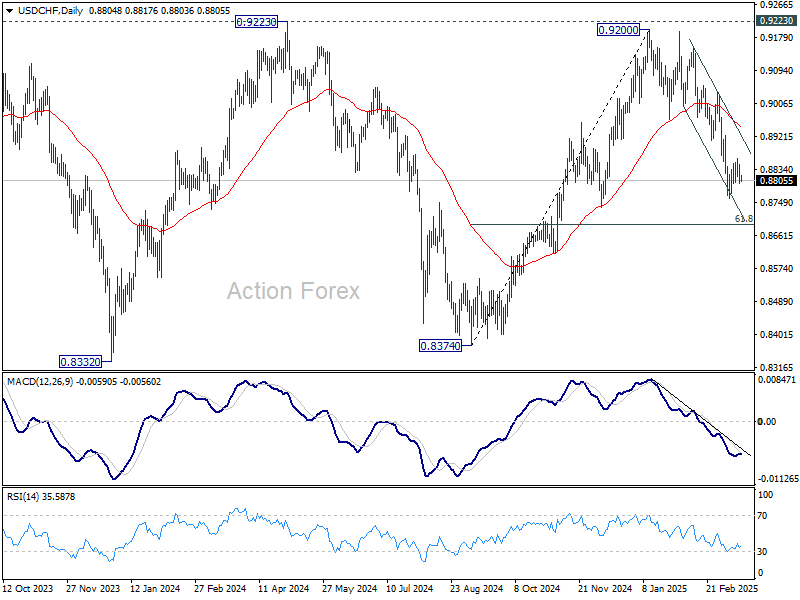
USD/CHF weakened after rejection by 55 4H EMA (now at 0.8844), but stays in range above 0.8757. Intraday bias stays neutral for the moment. In case of another recovery, upside should be limited by 0.8911 support turned resistance. On the downside, break of 0.8757 will resume the fall from 0.9200 to 61.8% retracement of 0.8374 to 0.9200 at 0.8690. Sustained break there will pave the way back to 0.8374 support.
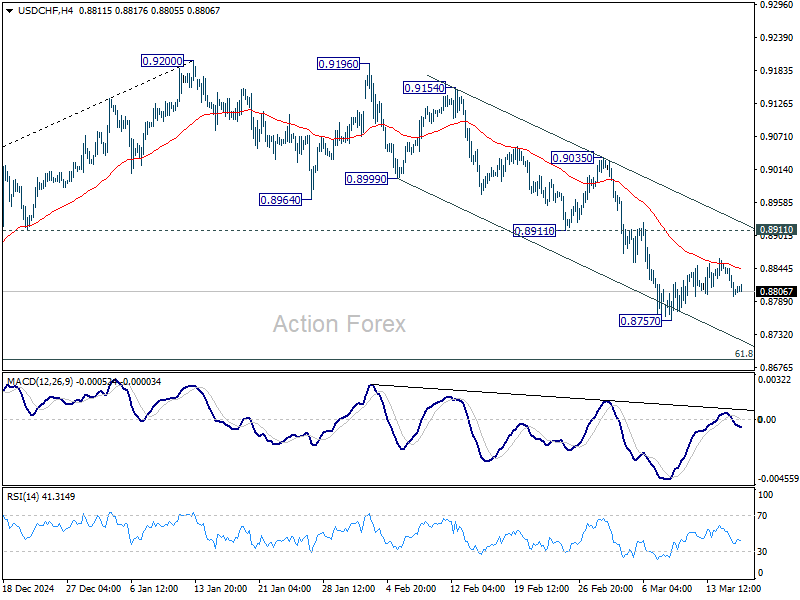
In the bigger picture, rejection by 0.9223 key resistance keep medium term outlook bearish. That is, larger fall from 1.0342 (2017 high) is not completed yet. Firm break of 0.8332 (2023 low) will confirm down trend resumption.