Sample Category Title
EUR/USD: Bullish Bias Above 1.0800, All Eyes on German Debt Vote on Tuesday
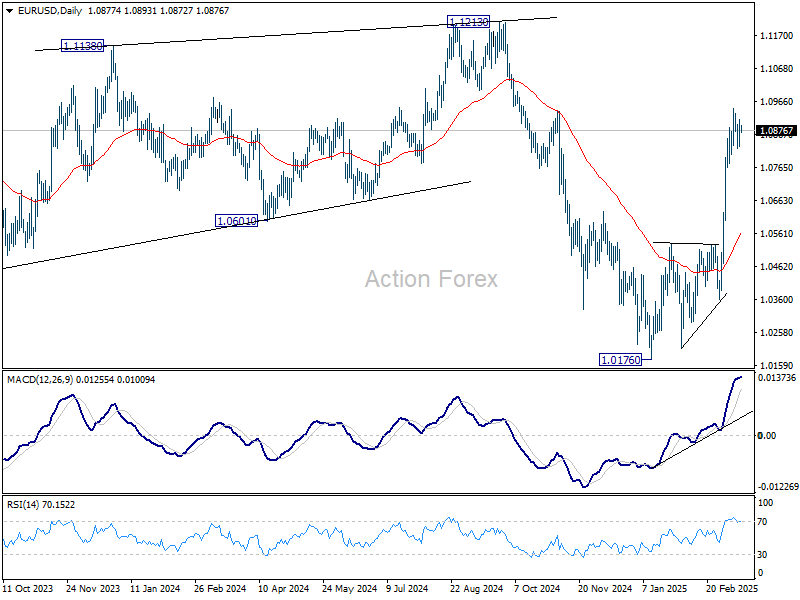
The Euro holds in extended consolidation under new 5-month high, following strong rally in past two weeks.
Technical picture remains bullish on daily chart, though overbought RSI and fading bullish momentum, keep in play risk of deeper pullback.
Near-term action should remain biased higher while the price stays above broken pivotal barriers, now acting as solid supports at 1.0820/00 zone (10DMA / Fibo 61.8% of 1.1214/1.0177 / round figure) and keep in focus targets at 1.0969/1.1000 (Fibo 76.4% / psychological).
Weaker dollar and supportive fundamentals played the key role in the latest rally, with focus on German vote for historical changes to borrowing rules which would allow the plan for massive increase in state borrowing for Euro 500 billion for defense and boost of economic growth.
Res: 1.0947; 1.0969; 1.1000; 1.1024.
Sup: 1.0868; 1.0820; 1.0800; 1.0726.

A Series of Central Bank Meetings and Key (Geo)political Cliffhangers
Markets
US data screamed stagflation but markets didn’t bother this time around. A steep drop in consumer confidence (University of Michigan) coincided with a sharp rise in the year-ahead inflation expectations series and an even sharper one in the longer-term 5-10yr gauge. The former rose to the highest since 2022 (4.9%), the latter a 30-year high of 3.9%. Stocks in the US shrugged it off and with the support of the technical charts (eg. S&P500 at 23.6% retracement of the 2022-2025 rise) ended a bad week on a good note (+1.6-2.6%). Core bonds fell with Treasuries underperforming Bunds. Rates in the US rose between 3.3-6.2 bps in a bear flattening move. Bund yields added 0.2-2.7 bps in a steepener. The euro held a slight advantage over the dollar, helped higher by the deal Germany’s CDU/CSU reached with the Greens to support the debt brake reform and other (defense) stimulus initiatives. The measures will be put to vote in the outgoing parliament tomorrow. EUR/USD tried to take out 1.09 again but settled for a bit less eventually (1.0879). Sterling traded on the backfoot following a disappointing set of industrial data. EUR/GBP rallied from the 0.837 support area towards 0.841. The general risk-on was also apparent in tariff-stricken currencies such as CAD and MXN or cyclicals including AUD and NZD. Those latter currencies in particular were perhaps eying new Chinese stimulus measures. Reports/rumours lingered on Friday and authorities made an official pledge in Xinhua News state agency on Sunday. The report calls for steps to revive domestic consumption by boosting people’s incomes as well as to stabilize stock and real estate markets. Specifics are expected to be announced later today. This comes after the first set of hard data for 2025 offered a glimmer of hope (see below) for the ailing economy. The yuan as well as local stocks trade guarded though. USD/CNY rises slightly towards 7.24. Other stocks in the region are better bid while core bonds and major FX consolidate at the start of a busy week that includes a series of central bank meetings and key (geo)political cliffhangers. The Fed gathers on Wednesday and has some final input today with the February retail sales even as they won’t change the status quo decision that’s widely expected. The Fed will present updated forecasts but we expect them to come with a big uncertainty disclaimer. The Bank of Japan also decides over policy on Wednesday as does the Bank of England on Thursday, together with the Swedes and Swiss. (Geo)politics take center stage with POTUS Trump speaking with his Russian counterpart tomorrow. The German parliamentary vote is also scheduled for tomorrow while a high-stakes European defense summit is scheduled March 20-21.
News & Views
Rating agency Moody’s on Friday raised the credit rating of Greece from Ba1 to Baa3. The outlook has been set at stable from positive. Moody’s was the last of the major rating agency’s to return the Greek credit rating back into investment grade territory, a symbolic step that the country is leaving behind the era of the sovereign debt crisis. The upgrade reflects Greece’s greater resilience to potential future shocks. Public finances have improved more quickly than expected. Based on the government's policy stance, institutional improvements that are bearing fruit, and a stable political environment, Moody’s expects Greece to continue to run substantial primary surpluses which will steadily decrease its high debt burden. Greece's debt-to-GDP ratio has declined by about 50 ppts since its peak in 2020 and it is down by around 27 ppts relative to pre-Covid levels. Moody’s estimates it stood at 156.1% of GDP end 2024 and projects it to decline to 148.3% and 140.6% in 2025 and 2026 respectively. The country's debt structure remains favourable, with an average term to maturity of 18.8 years, with all of the debt at fixed rates.
(Some) Chinese eco data published this morning printed stronger than expected, raising some hope that the country might have performed reasonably well at the start of the year despite the overall economic uncertainty. Retail sales (5.9% Y/Y YTD vs 5.3% Y/Y expected), industrial production (4.0% YTD vs 3.8% expected) and fixed assets investment (4.1% YTD VS 3.2% expected) all printed stronger than expected. China publishes data for January and February combined to address statistical issues due to the timing of the Lunar New Year. On the other hand, the jobless rate rose from 5.2% to 5.4%. In its assessment, the statistical office noted the positive momentum but said that the external environment is increasingly complex and severe, domestic effective demand is weak, some enterprises face difficulties in production and operation, and the foundation for sustained economic recovery and growth is not strong enough. This is laying the groundwork for the authorities to clarify additional steps to support the economy and in particular domestic demand, probably as soon as today.
Good News from China
A set of Chinese data released earlier today looked better-than-expected; the fixed asset investment unexpectedly accelerated in February, growth in industrial production slowed less than expected – a slowdown due to the Chinese new year break, while growth in retail sales accelerated to 4%, more than expected. The unemployment rate rose, however, and the worries regarding the property crisis and the shrinking population remain on the back of investors’ mind despite the AI-led boost in Chinese equities this year. To address the issues while the momentum is in favour, the Chinese authorities pledged to provide more support to stabilize stock and property markets, support wages and more importantly do something to boost the shrinking birth rates. The Hang Seng is up this morning by around 0.70% at the time of writing, the CSI 300 index shows reluctance to extend Friday’s nearly 2.50% jump before more details are unveiled from the Chinese authorities. Oil gained on Chinese stimulus prospects early Monday, but the gains are fully given back as the worsening trade war, its negative impact on growth global growth prospects, the possibility of a potential end to the Ukrainian war and OPEC+ production restoration plans keep the upside potential limited near the $68pb, with potential of a further fall toward the $65pb.
Germans have a plan
On Friday, Friedrich Merz reportedly reached an agreement with the Greens to unlock a EUR 500bn debt-financed spending bill on infrastructure and defence. The latter pushes the German yields higher, obviously, with the 10-year bund yield testing the 2023 peak. The euro continues to see support on the expectation that the extra spending will boost growth and even productivity in Europe. Massive spending could also boost inflation to some extent – which could require a more restrictive European Central Bank (ECB) policy than other wise – that is also positive for the euro’s valuation. As such, the EURUSD has its eyes set on the 1.10 psychological mark and the EURGBP is challenging the two-year descending channel on improved growth prospects for the continental Europe versus the deteriorating outlook across the Channel. Indeed, Friday’s data from the UK looked bad: the industrial production fell more than expected and the GDP growth turned negative in January. The British government’s plans to raise taxes are suspected to play a role in the growth slowdown, and the rising gilt yields narrow the prospects of spending and growth. The UK’s ability to secure a special treatment from the US in the growing tariff war doesn’t help. The Bank of England (BoE) is expected to maintain the rates unchanged this week. But against the dollar, the GBP outlook remains positive. Cable could well succeed another attempt to clear the 1.30 offers, as the growth prospects for the UK deteriorates less aggressively than for the US. And market valuations are very much impacted by the changes in growth expectations– which, in return, are highly influenced by the White House policies.
The rotation trade remains in play
The European Stoxx 600 remained well bid near its 50-DMA last week, the FTSE 100 managed to rebound above its 50-DMA after spending three sessions below this level last week, while the S&P500 tipped a toe into the correction territory following a four-straight-week and a 10% selloff. Friday’s session looked better for the US equities, as the oversold conditions attracted dipbuyers and the US politicians agreed to avert a government shutdown. But the news were not great, mind you. The consumer sentiment tanked to the lowest levels in the US since November 2022 while the long-term inflation expectations spiked to the highest levels since 1993 – that’s the worst possible combination for market sentiment. As such, Friday’s rebound may not lead to a sustainable rebound in US equities, and the US equities probably have room to extend their downside correction 5-10% more.
All eyes are on the Federal Reserve (Fed) this week. The Fed is expected to maintain the rates unchanged with a 99% certainty according to the activity on Fed funds futures. The dot plot and Jerome Powell’s comments could give hints regarding how the Fed is planning to navigate the tariff war hammering the US economic prospects. The US dollar is under pressure, while investors buy gold each time,they hear the word ‘tariff’. The yellow metal traded above the $3000 per ounce for the first time in history. The Bank of America said that the price of an ounce could increase to $3500 on geopolitical uncertainties and Bloomberg hints that gold is still from its inflation-adjusted peak of 1980 – which, in today’s prices, would stand near $3800 per ounce.
German Fiscal Package Negotiations Take Centre Stage
In focus this week
The main spotlight of the week will be on news regarding the negotiations of the German fiscal package. The package is scheduled to be passed in the Bundestag on Tuesday and then in the Bundesrat on Friday, with expectations for approval. Merz states that CDU/CSU unanimously support the proposal, although there are risks that some may not vote in favour and that Bavaria's 'Free Voters' might not support it in the Bundesrat on Friday.
In the US, President Trump announced that he will be speaking with Russian President Putin about ending the war in Ukraine on Tuesday. On the data side, February retail sales data will be released this afternoon. Markets will closely follow if the recent weakness seen in consumer sentiment surveys has translated into more cautious spending behaviour.
On Wednesday, the FOMC meeting is set to take place, with an unchanged rate decision anticipated. Attention will be on Powell's communication about future rate cuts and economic projections, as the Fed may signal further tapering or the end of QT soon. On Thursday, the Bank of England is expected to keep the Bank Rate at 4.50%, following its gradual approach to monetary policy. Meanwhile, the SNB is likely to cut the policy rate by 25bp to 0.25% due to subdued inflation pressures.
Economic and market news
What happened over the weekend
In Germany, the incoming government has reached an agreement with The Greens on reforming the debt brake and establishing an infrastructure fund. Overall, the package is nearly identical to what was originally proposed. Concessions to The Green party include a commitment for the off-budget fund to focus on green initiatives, with EUR 100bn out of the EUR 500 billion dedicated to this cause. On defence, the agreement maintains the exemption of spending above 1% of GDP from the debt brake, with an expanded definition to include aid to Ukraine and intelligence services. The third aspect of relaxing regional governments' "black zero" policy is also agreed upon.
In the euro area, final inflation figures came in for Germany, France and Spain. While France and Spain reported levels consistent with their initial flash estimates, German final HICP inflation was revised down to 2.6% y/y from 2.8% y/y in the flash release. The lower final print will pull down the euro area HICP where German inflation has a weight of 28%.
In the US, the University of Michigan's consumer survey revealed a significant decline in sentiment as inflation fears grew. Preliminary March results indicate a 1-year inflation outlook of 4.9%, up from February's 4.3%. Consumers are less optimistic, with current situation assessments dropping to 63.5 from 65.7, and future expectations falling to 54.2 from 64.0. The impact on consumption will be closely watched when February retail sales data is released today.
In Sweden, the Labor Force Survey for February showed employment rising by 0.2%, while the unemployment rate fell to 8.9%, mainly due to a decrease in the activity rate and more discouraged workers. Although employment aligns with the Riksbank's December forecast, unemployment remains high. The decline in temporary workers suggests a weak labour market outlook for the next 6-9 months, with slow improvement expected later this year. The data highlights low resource utilization, indicating potential downside risks for Riksbank rate cuts, though high inflation remains the primary concern.
The Swedish Moderate Party announced that: 1) The government will add SEK 11.5bn of fiscal spending in the spring amendment budget bill, likely with parts of it being defence related. 2) The Moderate Party is open to more borrowing, which they label should be temporary in nature. How large the increase in defence spending eventually will be is likely to be decided at the upcoming NATO summit in June. For a discussion on defence spending, see Reading the Markets Sweden, 21 February.
Equities: In the absence of new tariff threats, equities engineered a nice rebound bounce on Friday. Nasdaq a full 2.6% higher, Russell 2000 2.5%, S&P 500 2.1% and Dow 1.7%. This was a classic rebound session where investors bought the dip in the most battered sectors, such as tech, energy, banks and consumer discretionary. All sectors were notably higher, though cyclicals were in clear favour. The return in risk appetite was visible outside US too, with Stoxx 600 up 1.1% with banks, tech and industrials in the lead. However, this still takes most US lower for the fourth straight week and Europe for its second. One day without tariff news was too little for investor to build upon, as US futures are nosediving again this morning.
FI&FX: SEK, NOK and EUR gained vis-à-vis USD and JPY on Friday as risk sentiment recovered to end the week. EUR/USD traded close to the 1.09 level and EUR/SEK fell towards the 11.00 level. Bond yields held steady with the 10Y US Treasury trading close to 4.30% and the 10Y German bond yield trading around the 2.90% level.
EUR/GBP Daily Outlook
Daily Pivots: (S1) 0.8378; (P) 0.8403; (R1) 0.8435; More...
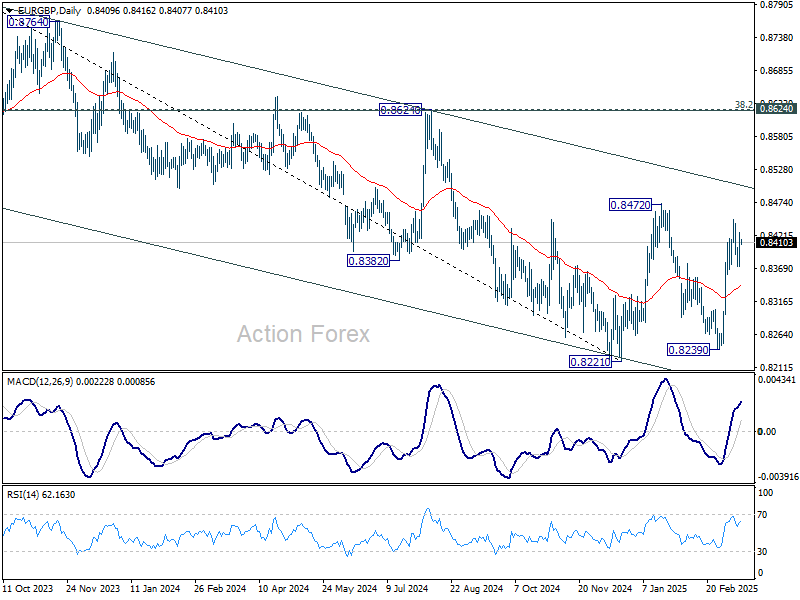
Intraday bias in EUR/GBP remains neutral for the moment, and more consolidations could be seen. Further rally is expected as long as 0.8358 minor support holds. On the upside, break of 0.8448 will target 0.8472 resistance first. Firm break there will resume whole rebound from 0.8221 to medium term falling channel resistance (now at 0.8508). Nevertheless, break of 0.8358 will suggest that rise from 0.8239 has completed and turn bias back to the downside instead.
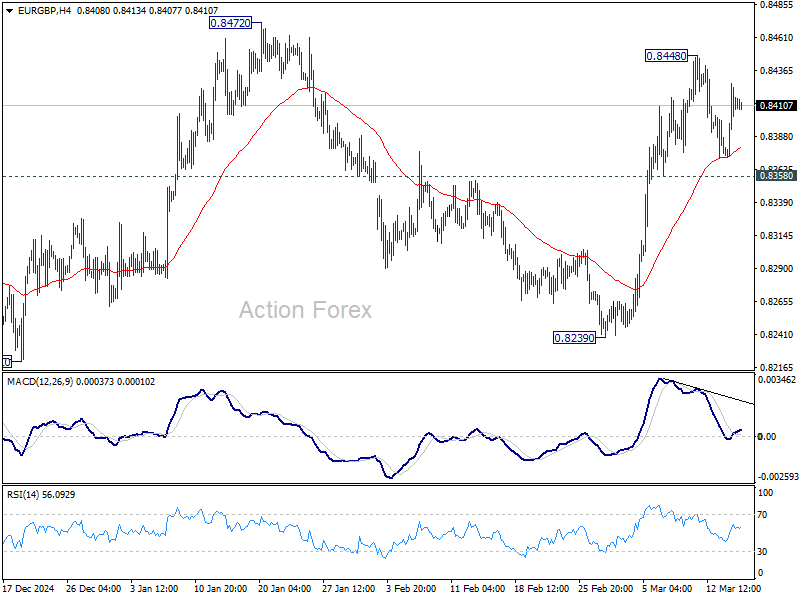
In the bigger picture, EUR/GBP is still bounded inside medium term falling channel. While rebound from 0.8221 might extend higher, it could still develop into a corrective pattern. Overall outlook will be neutral at best and down trend from 0.9267 (2022 high) could extend, at least until decisive break of channel resistance (now at 0.8508).
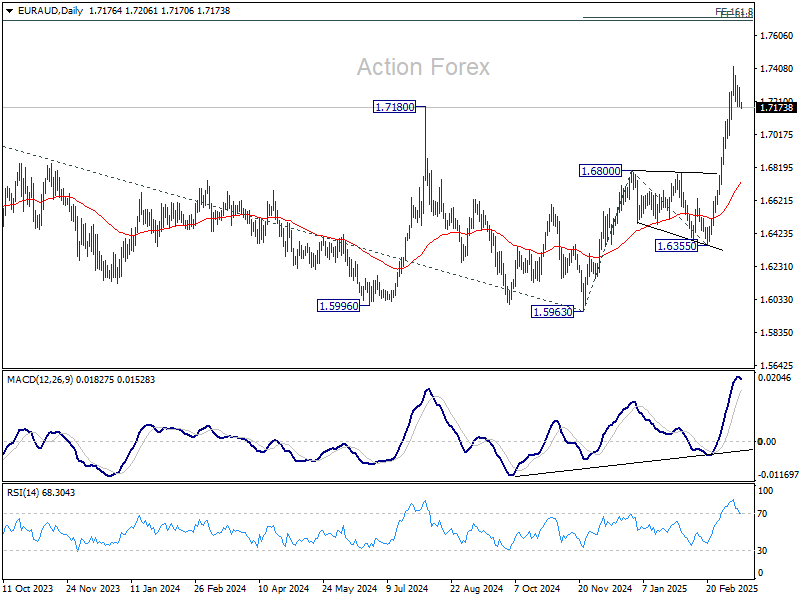
EUR/AUD Daily Outlook
Daily Pivots: (S1) 1.7151; (P) 1.7225; (R1) 1.7267; More...
Intraday bias in EUR/AUD remains neutral for consolidations below 1.7417. Downside of retreat should be contained by 0.6990 support to bring rebound. On the upside, break of 1.7417 will resume rise from 1.6335 to 161.8% projection of 1.5963 to 1.6800 from 1.6355 at 1.7709 next.
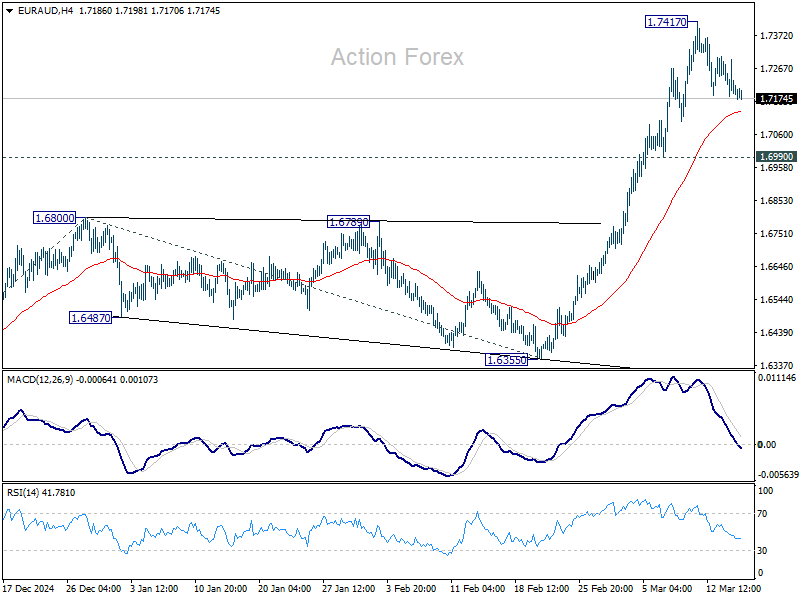
In the bigger picture, the breach of 1.7180 key resistance (2024 high) suggests that up trend from 1.4281 (2022 low) is resuming. Sustained trading above 1.7180 will confirm and target 61.8% projection of 1.4281 to 1.7062 from 1.5963 at 1.7682, which is also close to 61.8% retracement of 1.9799 (2020 high) to 1.4281 at 1.7691. For now, this will remain the favored case as long as 1.6800 resistance turned support holds, even in case of deep pullback.
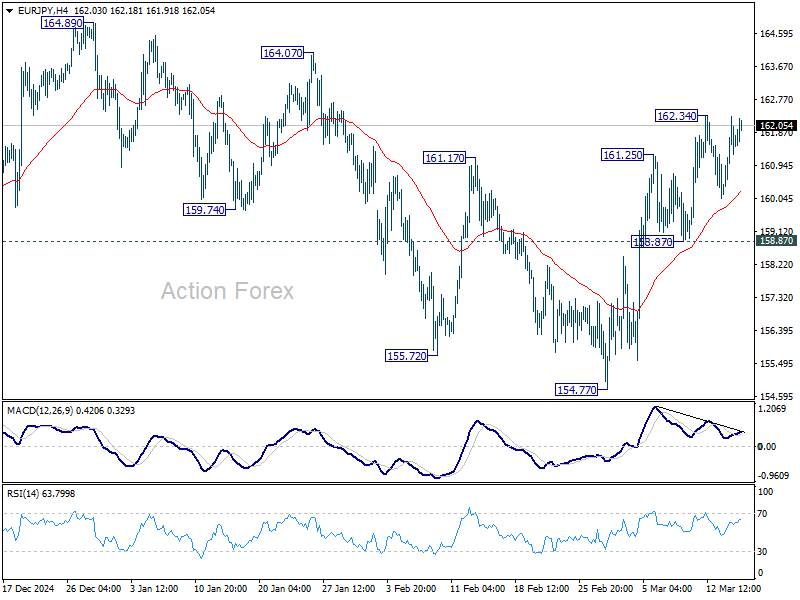
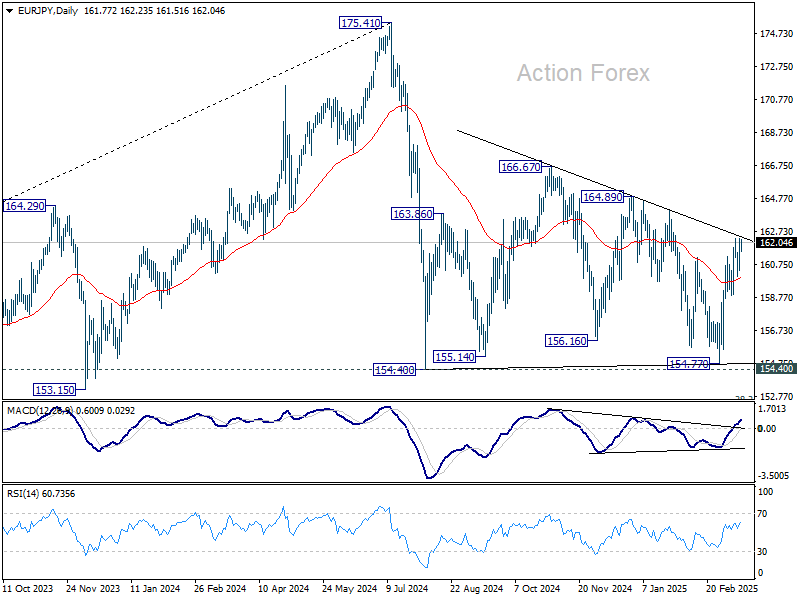
EUR/JPY Daily Outlook
Daily Pivots: (S1) 160.52; (P) 161.42; (R1) 162.58; More...
Intraday bias in EUR/JPY remains neutral and more consolidations could be seen. Further rally is expected as long as 158.87 support holds. On the upside, break of 162.34 will resume the rise from 154.77 to 164.89 resistance, as another rising leg in the consolidation pattern from 154.40.
In the bigger picture, price actions from 175.41 are seen as correction to rally from 114.42 (2020 low). Strong support should be seen from 38.2% retracement of 114.42 to 175.41 at 152.11 to contain downside. However, sustained break of 152.11 will bring deeper fall even still as a correction.
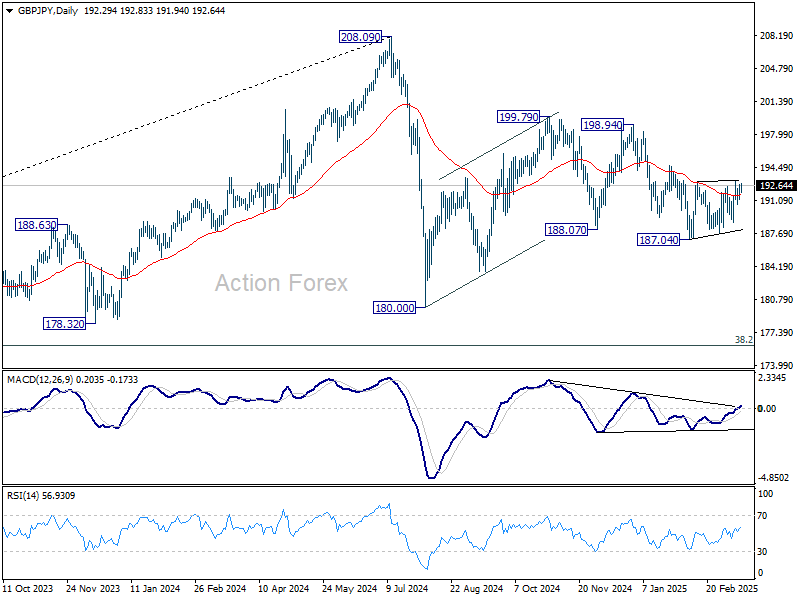
GBP/JPY Daily Outlook
Daily Pivots: (S1) 191.39; (P) 192.07; (R1) 192.90; More...
Range trading continues in GBP/JPY and intraday bias remains neutral. On the upside, firm break of 193.09 will resume the rebound from 187.04 to 194.73 resistance, and then 198.94. On the downside, firm break of 187.04 will extend the fall from 199.79 towards 180.00 support. Overall, corrective pattern from 180.00 might still be extending.
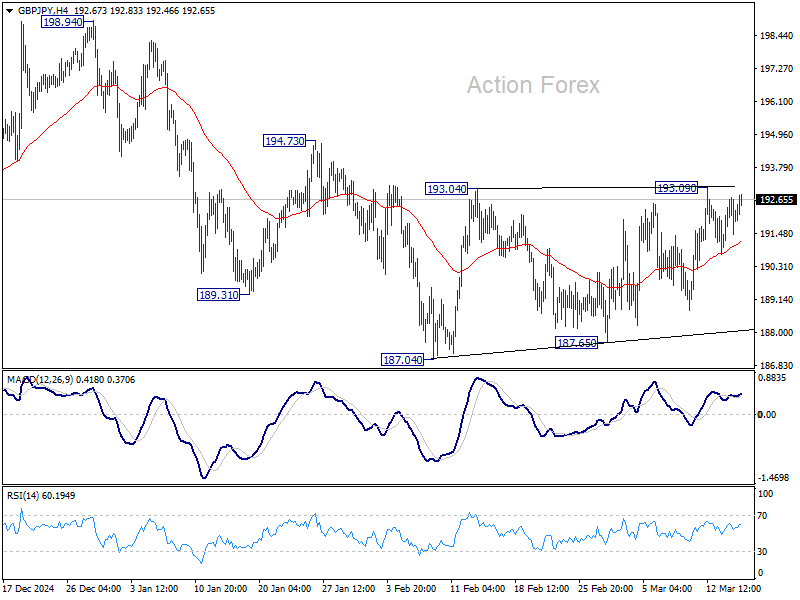
In the bigger picture, price actions from 208.09 are seen as a correction to rally from 123.94 (2020 low). Strong support should be seen from 38.2% retracement of 123.94 to 208.09 at 175.94 to contain downside. However, sustained break of 152.11 will bring deeper fall even still as a correction.
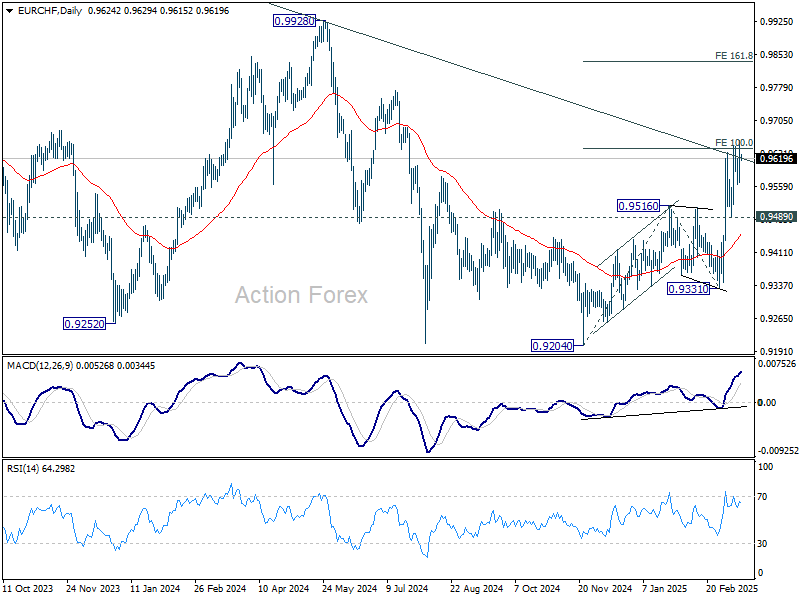
EUR/CHF Daily Outlook
Daily Pivots: (S1) 0.9580; (P) 0.9621; (R1) 0.9673; More....
Intraday bias in EUR/CHF remains neutral for the moment, and further rise is expected as long as 0.9489 support holds. Sustained trading above 100% projection of 0.9204 to 0.9516 from 0.9331 at 0.9643 will pave the way to 161.8% projection at 0.9836 next.
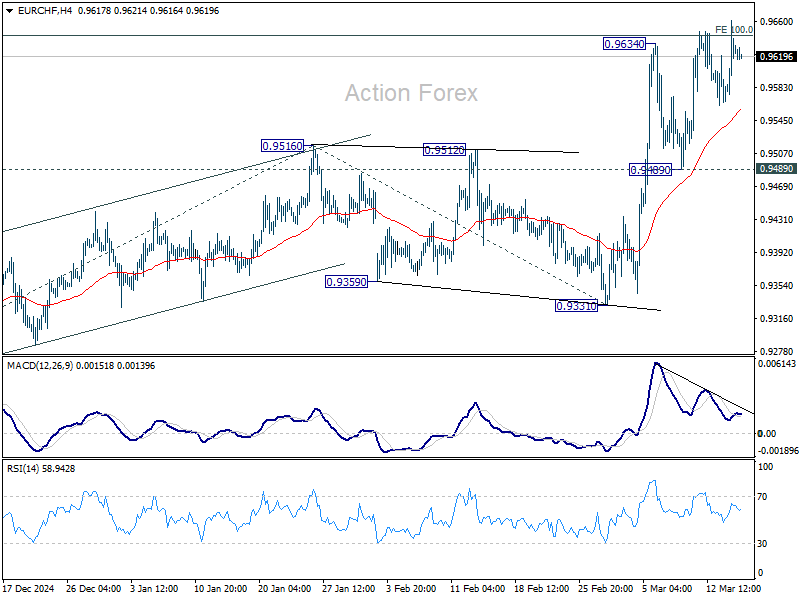
In the bigger picture, prior strong break of 55 W EMA (now at 0.9487) is a medium term bullish sign. Sustained break trading above long-term falling channel resistance (at around 0.9620) would suggest that the downtrend from 1.2004 (2018 high) has bottomed at 0.9204. Stronger rally should then be see to 0.9928 key resistance at least.
EUR/USD Daily Outlook
Daily Pivots: (S1) 1.0836; (P) 1.0874; (R1) 1.0918; More...
Intraday bias in EUR/USD remains neutral as consolidations continues below 1.0946. In case of another fall, downside should be contained by 38.2% retracement of 1.0358 to 1.0946 at 1.0721 to bring rebound. On the upside, break of 1.0946 will resume the rally from 1.0176 to retest 1.1274 key resistance.
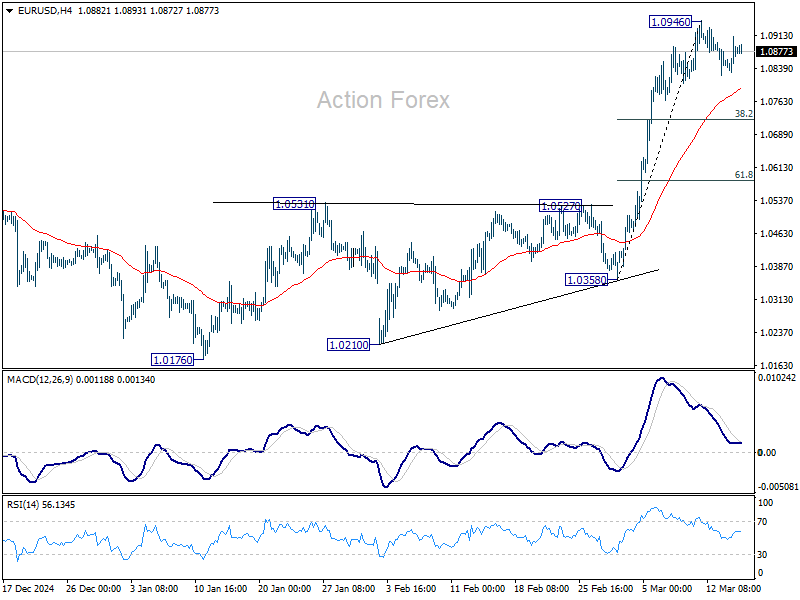
In the bigger picture, prior strong break of 55 W EMA (now at 1.0675) suggests that fall from 1.1274 (2024 high) has completed as a three wave correction to 1.0176. Rise from 0.9534 is still intact, and might be ready to resume. Decisive break of 1.1274 will target 100% projection of 0.9534 to 1.1274 from 1.0176 at 1.1916. Also, that will send EUR/USD through a multi-decade channel resistance will carries larger bullish implication. This will now be the favored case as long as 1.0531 resistance turned support holds.