Sample Category Title
USD/CAD Weekly Outlook
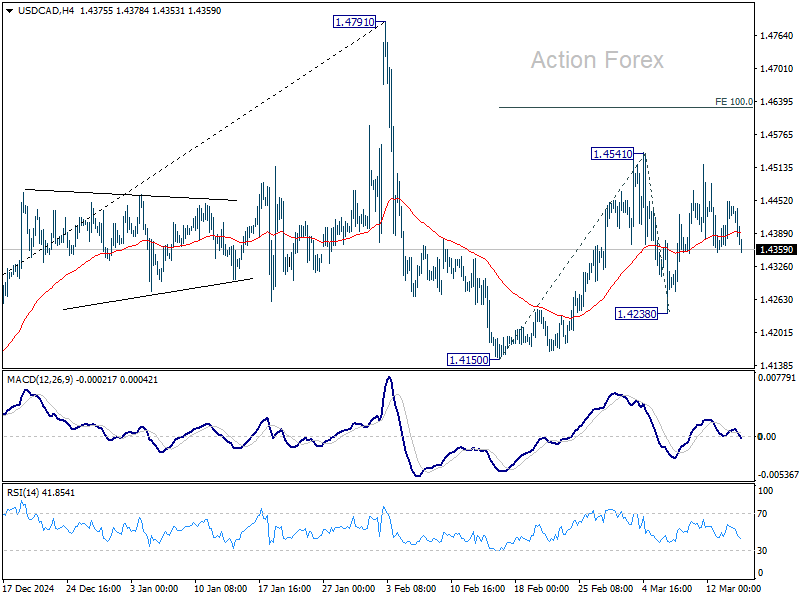
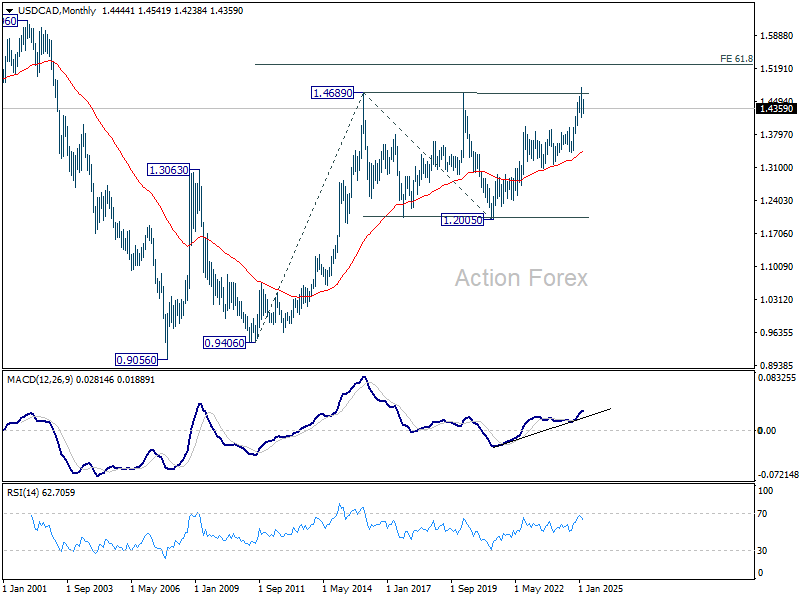
USD/CAD stayed in range trading below 1.4541 last week and outlook is unchanged. Initial bias remains neutral this week first. Price actions from 1.4150 are seen as the second leg of the corrective pattern from 1.4791 high. On the upside, break of 1.4541 will target 100% projection of 1.4150 to 1.4541 from 1.4238 at 1.4629. On the downside, however, break of 1.4238 support will argue that the third leg has already started. Intraday bias will be back on the downside for 1.4150 and below.
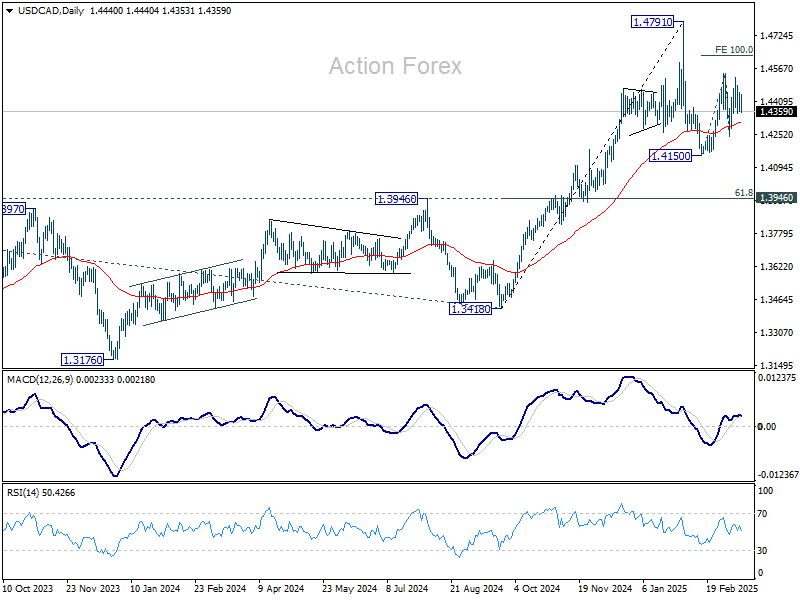
In the bigger picture, long term up trend is tentatively seen as resuming with prior breach of 1.4667/89 key resistance zone (2020/2015 highs). Next target is 100% projection of 1.2401 to 1.3976 from 1.3418 at 1.4993. This will remain the favored case as long as 1.3976 resistance turned support holds (2022 high), even in case of deep pullback.
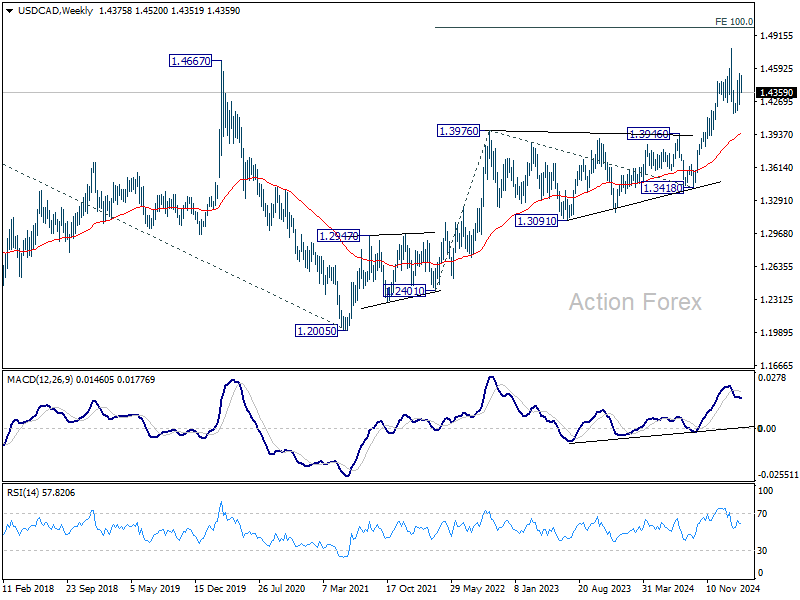
In the longer term picture, up trend from 0.9506 (2007 low) is in progress and possibly resuming. Next target is 61.8% projections of 0.9406 to 1.4689 from 1.2005 at 1.5270. While rejection by 1.4689 will delay the bullish case, further rally will remain in favor as long as 55 M EMA (1.3463) holds.
GBP/JPY Weekly Outlook
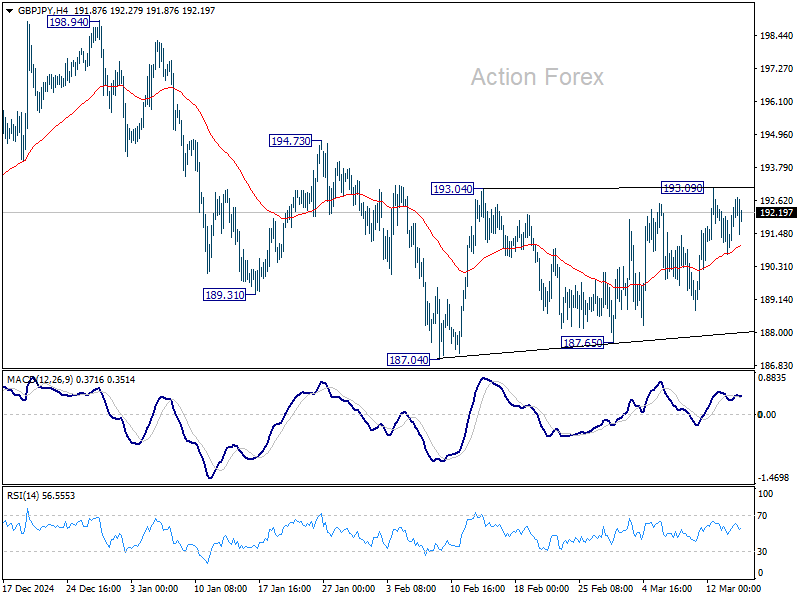
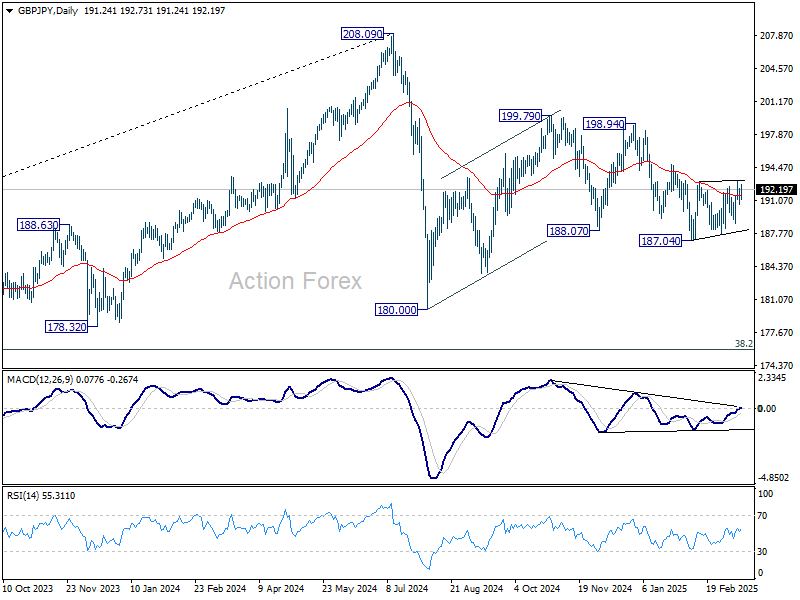
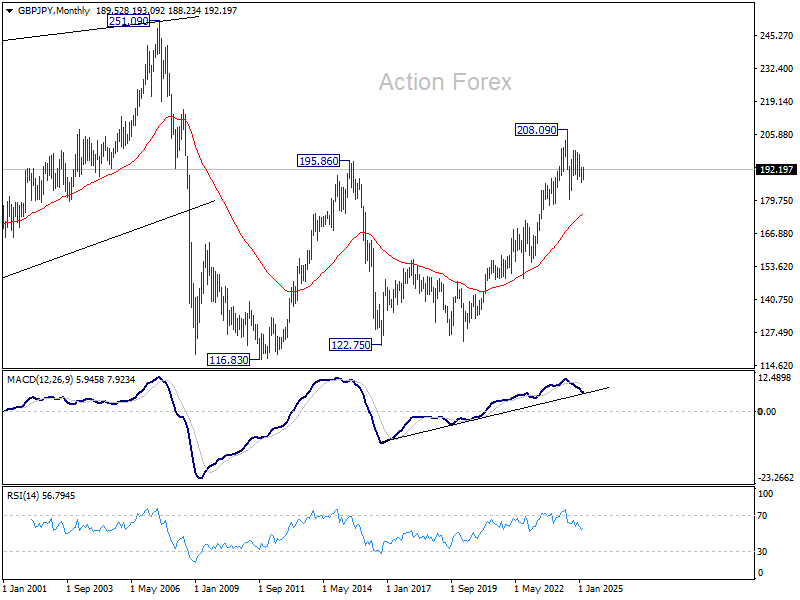
Sideway trading continued in GBP/JPY above 187.04 last week. Initial bias remains neutral this week first. On the upside, firm break of 193.09 will resume the rebound from 187.04 to 194.73 resistance, and then 198.94. On the downside, firm break of 187.04 will extend the fall from 199.79 towards 180.00 support. Overall, corrective pattern from 180.00 might still be extending.
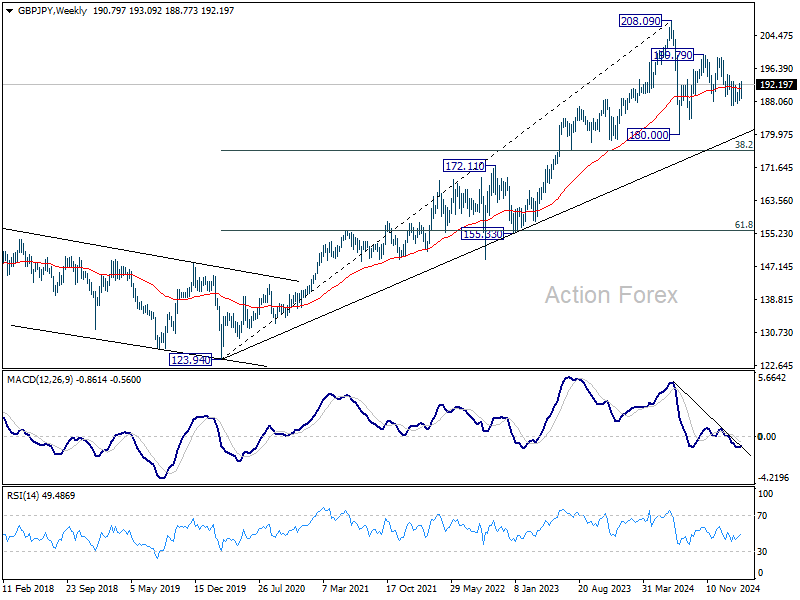
In the bigger picture, price actions from 208.09 are seen as a correction to rally from 123.94 (2020 low). Strong support should be seen from 38.2% retracement of 123.94 to 208.09 at 175.94 to contain downside. However, sustained break of 152.11 will bring deeper fall even still as a correction.
In the longer term picture, while a medium term top was formed at 208.09 (2024 high), it's still early to conclude that the up trend from 122.75 (2016 low) has completed. But GBP/JPY is at least in a medium term corrective phase, with risk of correction to 55 M EMA (now at 174.62).
EUR/JPY Weekly Outlook
EUR/JPY edged higher to 162.34 last week but retreated since then. Initial bias remains neutral this week and more consolidations could be seen. But further rally is expected as long as 158.87 support holds. On the upside, break of 162.34 will resume the rise from 154.77 to 164.89 resistance, as another rising leg in the consolidation pattern from 154.40.

In the bigger picture, price actions from 175.41 are seen as correction to rally from 114.42 (2020 low). Strong support should be seen from 38.2% retracement of 114.42 to 175.41 at 152.11 to contain downside. However, sustained break of 152.11 will bring deeper fall even still as a correction.

In the long term picture, while 175.41 is at least a medium term top, it's still early to conclude that up trend from 94.11 (2012 low) has completed. A medium term corrective phase is in progress with risk of deeper fall back to 55 M EMA (now at 148.45).


EUR/GBP Weekly Outlook
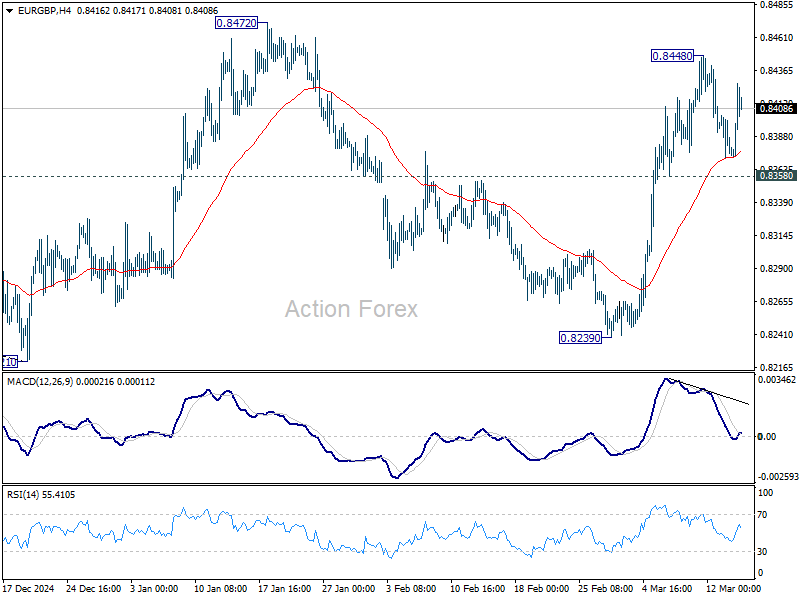
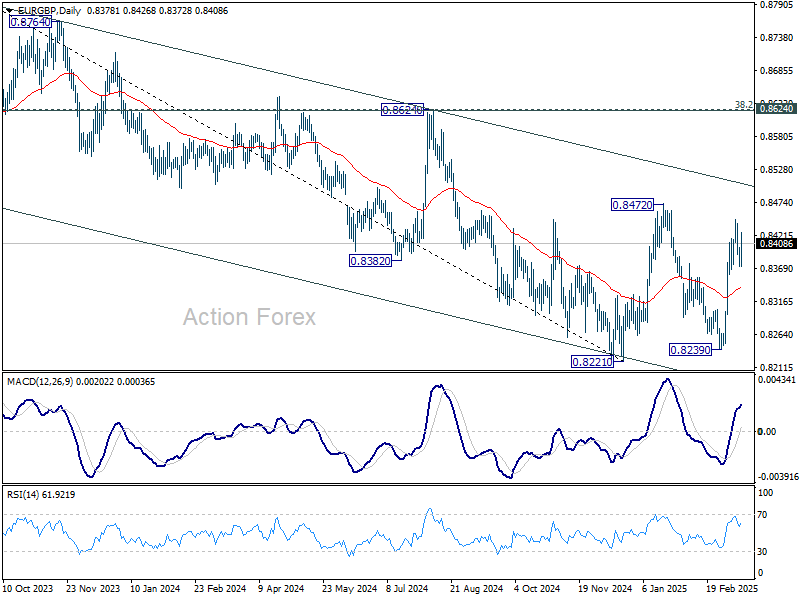
EUR/GBP edged higher to 0.8448 last week but retreated since then. Initial bias stays neutral this week for consolidations. Further rally is expected as long as 0.8358 minor support holds. On the upside, break of 0.8448 will target 0.8472 resistance first. Firm break there will resume whole rebound from 0.8221 to medium term falling channel resistance (now at 0.8508). Nevertheless, break of 0.8358 will suggest that rise from 0.8239 has completed and turn bias back to the downside instead.
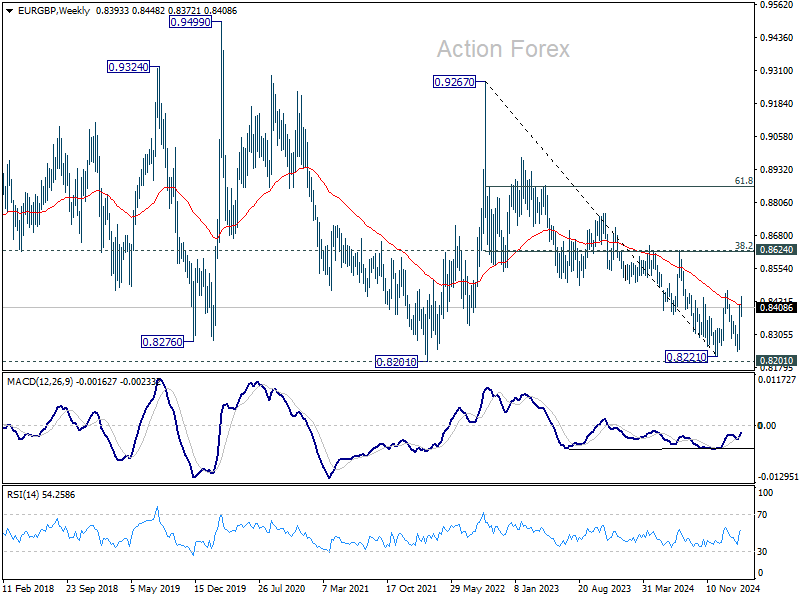
In the bigger picture, EUR/GBP is still bounded inside medium term falling channel. While rebound from 0.8221 might extend higher, it could still develop into a corrective pattern. Overall outlook will be neutral at best and down trend from 0.9267 (2022 high) could extend, at least until decisive break of channel resistance (now at 0.8508).
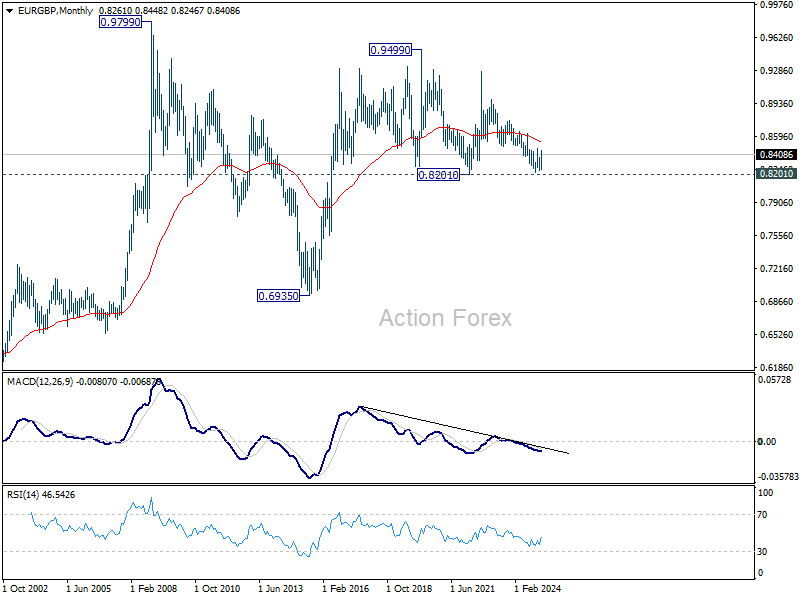
In the long term picture, price action from 0.9499 (2020 high) is seen as part of the long term range pattern from 0.9799 (2008 high). Range trading should continue between 0.8201 and 0.9499, until there is clear signal of imminent breakout.
EUR/AUD Weekly Outlook
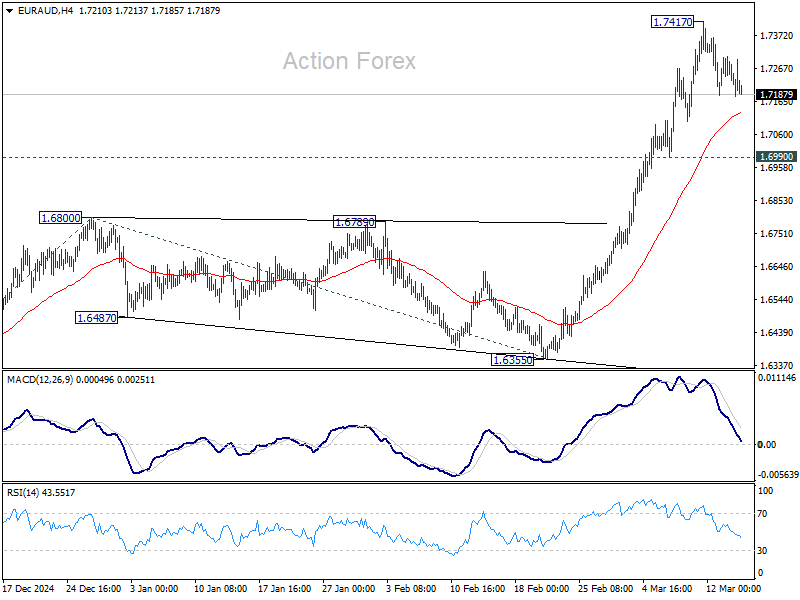
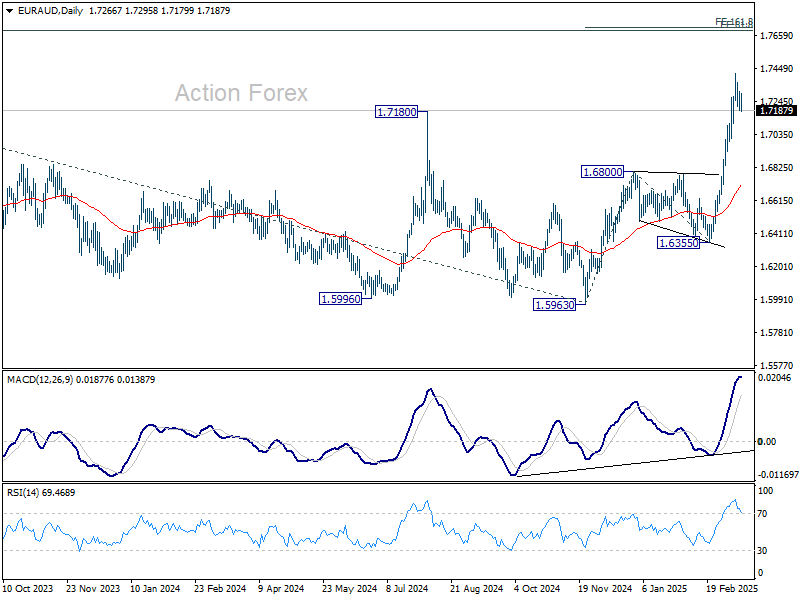
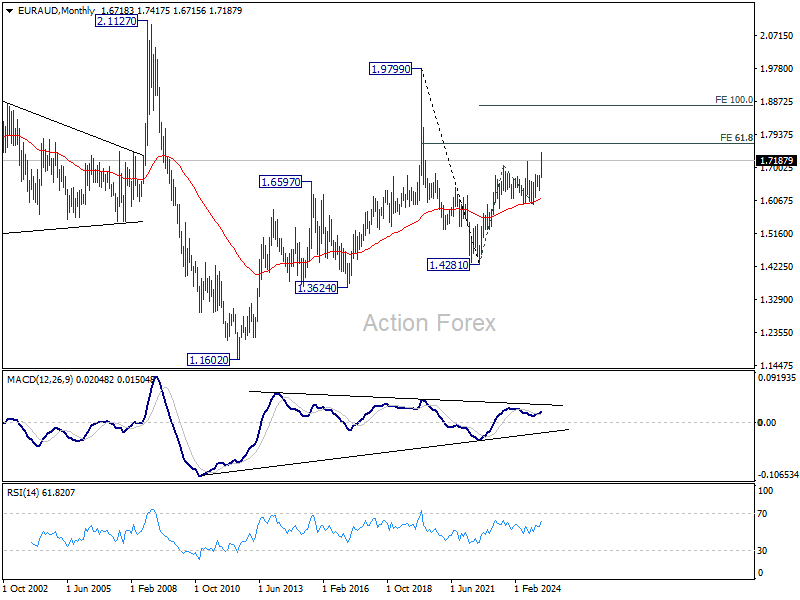
EUR/AUD edged higher to 1.7417 last week but retreated since then. Initial bias stays neutral this week for more consolidations first. Downside of retreat should be contained by 0.6990 support to bring rebound. On the upside, break of 1.7417 will resume rise from 1.6335 to 161.8% projection of 1.5963 to 1.6800 from 1.6355 at 1.7709 next.
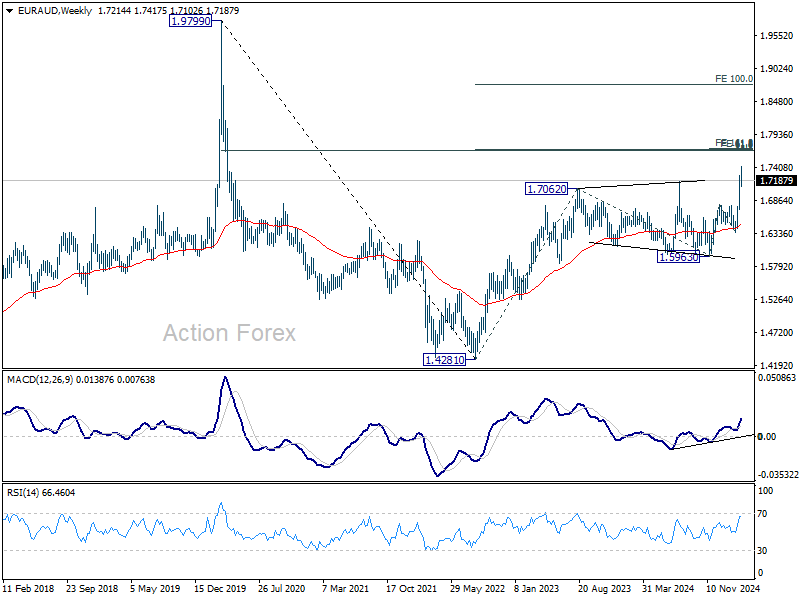
In the bigger picture, the breach of 1.7180 key resistance (2024 high) suggests that up trend from 1.4281 (2022 low) is resuming. Sustained trading above 1.7180 will confirm and target 61.8% projection of 1.4281 to 1.7062 from 1.5963 at 1.7682, which is also close to 61.8% retracement of 1.9799 (2020 high) to 1.4281 at 1.7691. For now, this will remain the favored case as long as 1.6800 resistance turned support holds, even in case of deep pullback.
In the longer term picture, rise from 1.4281 is seen as the second leg of the pattern from 1.9799 (2020 high), which is part of the pattern from 2.1127 (2008 high). As long as 55 M EMA (now at 1.6137) holds, this second leg could still extend higher. However, sustained trading below 55 M EMA will open up the bearish case for extending the decline through 1.4281 low.
EUR/CHF Weekly Outlook
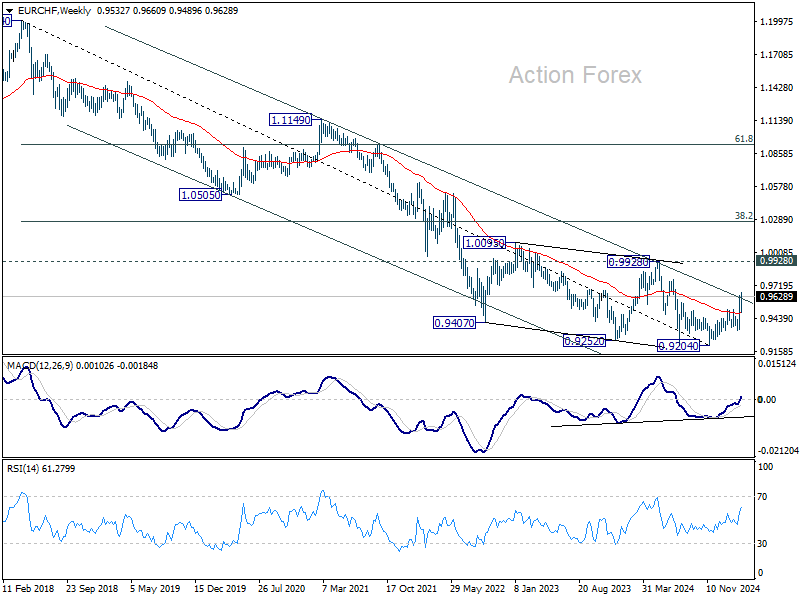
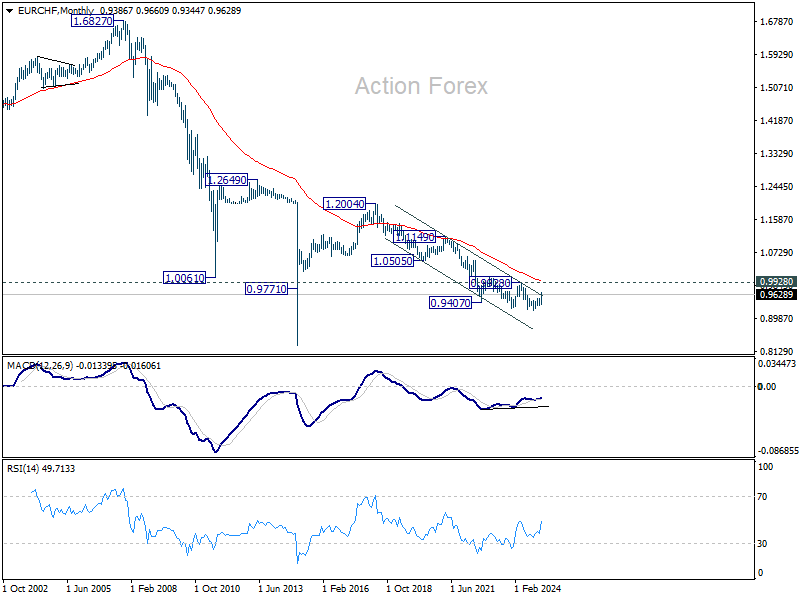
EUR/CHF gyrated higher last week after brief retreat, but lacked momentum to push through 100% projection of 0.9204 to 0.9516 from 0.9331 at 0.9643 decisively. Initial bias stays neutral this week first. Further rise is expected as long as 0.9489 support holds. Sustained trading above 0.9643 will pave the way to 161.8% projection at 0.9836 next.
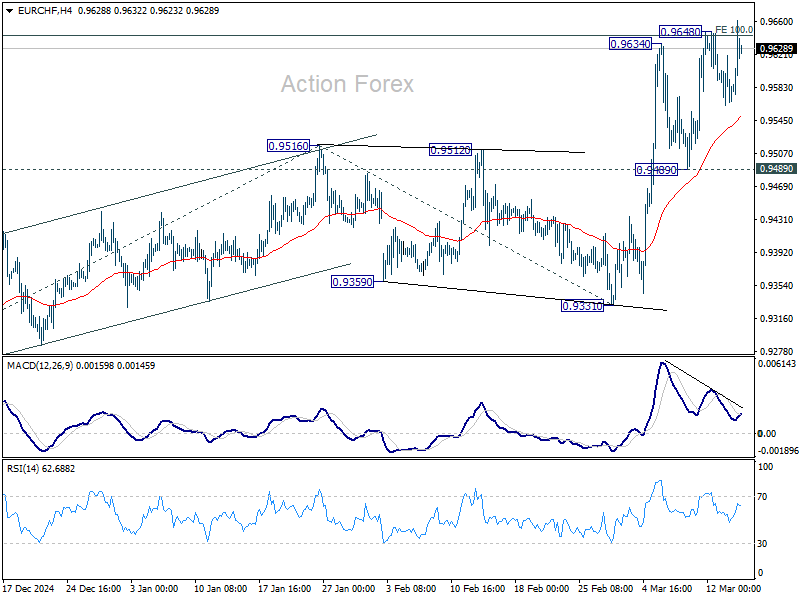
In the bigger picture, prior strong break of 55 W EMA (now at 0.9487) is a medium term bullish sign. Sustained break trading above long-term falling channel resistance (at around 0.9620) would suggest that the downtrend from 1.2004 (2018 high) has bottomed at 0.9204. Stronger rally should then be see to 0.9928 key resistance at least.
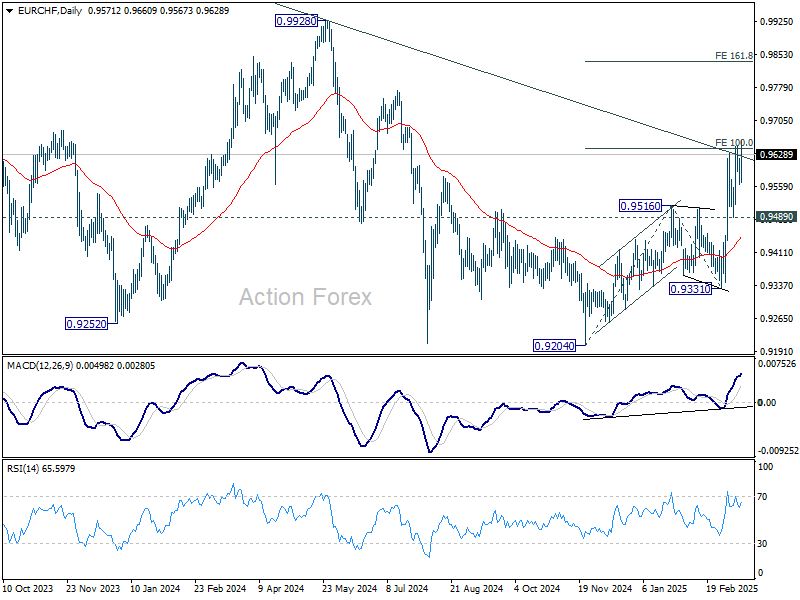
In the long term picture, bullish signs are emerging. However, the important hurdle at 0.9928 resistance, which is close to 55 M EMA (now at 0.9960), is needed to be taken out decisively before considering long term trend reversal. Otherwise, outlook is neutral at best.
Summary 3/17 – 3/21
Monday, Mar 17, 2025
| GMT | Ccy | Events | Consensus | Previous |
|---|---|---|---|---|
| 21:30 | NZD | Business NZ PSI Feb | 50.4 | |
| 00:01 | GBP | Rightmove House Price Index M/M Mar | 0.50% | |
| 02:00 | CNY | Industrial Production Y/Y Feb | 5.30% | 6.20% |
| 02:00 | CNY | Retail Sales Y/Y Feb | 3.80% | 3.70% |
| 02:00 | CNY | Fixed Asset Investment YTD Y/Y Feb | 3.20% | 3.20% |
| 12:15 | CAD | Housing Starts Y/Y Feb | 249K | 240K |
| 12:30 | USD | Empire State Manufacturing Index Mar | -1.9 | 5.7 |
| 12:30 | USD | Retail Sales M/M Feb | 0.70% | -0.90% |
| 12:30 | USD | Retail Sales ex Autos M/M Feb | 0.50% | -0.40% |
| 14:00 | USD | NAHB Housing Market Index Mar | 43 | 42 |
| GMT | Ccy | Events | |
|---|---|---|---|
| 21:30 | NZD | Business NZ PSI Feb | |
| Forecast: | Previous: 50.4 | ||
| 00:01 | GBP | Rightmove House Price Index M/M Mar | |
| Forecast: | Previous: 0.50% | ||
| 02:00 | CNY | Industrial Production Y/Y Feb | |
| Forecast: 5.30% | Previous: 6.20% | ||
| 02:00 | CNY | Retail Sales Y/Y Feb | |
| Forecast: 3.80% | Previous: 3.70% | ||
| 02:00 | CNY | Fixed Asset Investment YTD Y/Y Feb | |
| Forecast: 3.20% | Previous: 3.20% | ||
| 12:15 | CAD | Housing Starts Y/Y Feb | |
| Forecast: 249K | Previous: 240K | ||
| 12:30 | USD | Empire State Manufacturing Index Mar | |
| Forecast: -1.9 | Previous: 5.7 | ||
| 12:30 | USD | Retail Sales M/M Feb | |
| Forecast: 0.70% | Previous: -0.90% | ||
| 12:30 | USD | Retail Sales ex Autos M/M Feb | |
| Forecast: 0.50% | Previous: -0.40% | ||
| 14:00 | USD | NAHB Housing Market Index Mar | |
| Forecast: 43 | Previous: 42 | ||
Tuesday, Mar 18, 2025
| GMT | Ccy | Events | Consensus | Previous |
|---|---|---|---|---|
| 04:30 | JPY | Tertiary Industry Index M/M Jan | -0.10% | 0.10% |
| 08:00 | CHF | SECO Economic Forecasts | ||
| 10:00 | EUR | Eurozone Trade Balance (EUR) Jan | 14.1B | 14.6B |
| 10:00 | EUR | Germany ZEW Economic Sentiment Mar | 35 | 26 |
| 10:00 | EUR | Germany ZEW Current Situation Mar | -88.5 | |
| 10:00 | EUR | Eurozone ZEW Economic Sentiment Mar | 39.6 | 24.2 |
| 12:30 | CAD | CPI M/M Feb | 0.60% | 0.10% |
| 12:30 | CAD | CPI Y/Y Feb | 2.10% | 1.90% |
| 12:30 | CAD | CPI Median Y/Y Feb | 2.70% | |
| 12:30 | CAD | CPI Trimmed Y/Y Feb | 2.70% | |
| 12:30 | CAD | CPI Common Y/Y Feb | 2.20% | |
| 12:30 | USD | Building Permits Feb | 1.45M | 1.47M |
| 12:30 | USD | Housing Starts Feb | 1.38M | 1.37M |
| 12:30 | USD | Import Price Index M/M Feb | -0.10% | 0.30% |
| 13:15 | USD | Industrial Production M/M Feb | 0.20% | 0.50% |
| 13:15 | USD | Capacity Utilization Feb | 77.80% | 77.80% |
| 20:00 | NZD | Westpac Consumer Survey Q1 | 97.5 | |
| 21:45 | NZD | Current Account (NZD) Q4 | -6.64B | -10.58B |
| 23:50 | JPY | Trade Balance (JPY) Feb | 0.51T | -0.86T |
| 23:30 | AUD | Westpac Leading Index M/M Feb | 0.13% |
| GMT | Ccy | Events | |
|---|---|---|---|
| 04:30 | JPY | Tertiary Industry Index M/M Jan | |
| Forecast: -0.10% | Previous: 0.10% | ||
| 08:00 | CHF | SECO Economic Forecasts | |
| Forecast: | Previous: | ||
| 10:00 | EUR | Eurozone Trade Balance (EUR) Jan | |
| Forecast: 14.1B | Previous: 14.6B | ||
| 10:00 | EUR | Germany ZEW Economic Sentiment Mar | |
| Forecast: 35 | Previous: 26 | ||
| 10:00 | EUR | Germany ZEW Current Situation Mar | |
| Forecast: | Previous: -88.5 | ||
| 10:00 | EUR | Eurozone ZEW Economic Sentiment Mar | |
| Forecast: 39.6 | Previous: 24.2 | ||
| 12:30 | CAD | CPI M/M Feb | |
| Forecast: 0.60% | Previous: 0.10% | ||
| 12:30 | CAD | CPI Y/Y Feb | |
| Forecast: 2.10% | Previous: 1.90% | ||
| 12:30 | CAD | CPI Median Y/Y Feb | |
| Forecast: | Previous: 2.70% | ||
| 12:30 | CAD | CPI Trimmed Y/Y Feb | |
| Forecast: | Previous: 2.70% | ||
| 12:30 | CAD | CPI Common Y/Y Feb | |
| Forecast: | Previous: 2.20% | ||
| 12:30 | USD | Building Permits Feb | |
| Forecast: 1.45M | Previous: 1.47M | ||
| 12:30 | USD | Housing Starts Feb | |
| Forecast: 1.38M | Previous: 1.37M | ||
| 12:30 | USD | Import Price Index M/M Feb | |
| Forecast: -0.10% | Previous: 0.30% | ||
| 13:15 | USD | Industrial Production M/M Feb | |
| Forecast: 0.20% | Previous: 0.50% | ||
| 13:15 | USD | Capacity Utilization Feb | |
| Forecast: 77.80% | Previous: 77.80% | ||
| 20:00 | NZD | Westpac Consumer Survey Q1 | |
| Forecast: | Previous: 97.5 | ||
| 21:45 | NZD | Current Account (NZD) Q4 | |
| Forecast: -6.64B | Previous: -10.58B | ||
| 23:50 | JPY | Trade Balance (JPY) Feb | |
| Forecast: 0.51T | Previous: -0.86T | ||
| 23:30 | AUD | Westpac Leading Index M/M Feb | |
| Forecast: | Previous: 0.13% | ||
Wednesday, Mar 19, 2025
| GMT | Ccy | Events | Consensus | Previous |
|---|---|---|---|---|
| JPY | BoJ Interest Rate Decision | 0.50% | 0.50% | |
| 04:30 | JPY | Industrial Production M/M Jan F | -1.10% | -1.10% |
| 10:00 | EUR | Eurozone CPI Core Y/Y Feb F | 2.60% | 2.60% |
| 10:00 | EUR | Eurozone CPI Y/Y Feb F | 2.40% | 2.40% |
| 14:30 | USD | Crude Oil Inventories | 1.4M | |
| 18:00 | USD | Fed Interest Rate Decision | 4.50% | 4.50% |
| 18:30 | USD | FOMC Press Conference | ||
| 21:45 | NZD | GDP Q/Q Q4 | 0.40% | -1.00% |
| GMT | Ccy | Events | |
|---|---|---|---|
| JPY | BoJ Interest Rate Decision | ||
| Forecast: 0.50% | Previous: 0.50% | ||
| 04:30 | JPY | Industrial Production M/M Jan F | |
| Forecast: -1.10% | Previous: -1.10% | ||
| 10:00 | EUR | Eurozone CPI Core Y/Y Feb F | |
| Forecast: 2.60% | Previous: 2.60% | ||
| 10:00 | EUR | Eurozone CPI Y/Y Feb F | |
| Forecast: 2.40% | Previous: 2.40% | ||
| 14:30 | USD | Crude Oil Inventories | |
| Forecast: | Previous: 1.4M | ||
| 18:00 | USD | Fed Interest Rate Decision | |
| Forecast: 4.50% | Previous: 4.50% | ||
| 18:30 | USD | FOMC Press Conference | |
| Forecast: | Previous: | ||
| 21:45 | NZD | GDP Q/Q Q4 | |
| Forecast: 0.40% | Previous: -1.00% | ||
Thursday, Mar 20, 2025
| GMT | Ccy | Events | Consensus | Previous |
|---|---|---|---|---|
| 00:30 | AUD | Employment Change Feb | 30K | 44K |
| 00:30 | AUD | Unemployment Rate Feb | 4.10% | 4.10% |
| 01:00 | CNY | 1-Y Loan Prime Rate | 3.10% | 3.10% |
| 01:00 | CNY | 5-Y Loan Prime Rate | 3.60% | 3.60% |
| 07:00 | CHF | Trade Balance (CHF) Feb | 5.01B | 6.12B |
| 07:00 | EUR | GermanyPPI M/M Feb | 0.20% | -0.10% |
| 07:00 | EUR | GermanyPPI Y/Y Feb | 0.50% | |
| 07:00 | GBP | Claimant Count Change Feb | 7.9K | 22K |
| 07:00 | GBP | ILO Unemployment Rate (3M) Jan | 4.50% | 4.40% |
| 07:00 | GBP | Average Earnings Including Bonus 3M/Y Jan | 5.90% | 6.00% |
| 07:00 | GBP | Average Earnings Excluding Bonus 3M/Y Jan | 5.90% | |
| 08:30 | CHF | SNB Interest Rate Decision | 0.25% | 0.50% |
| 09:00 | CHF | SNB Press Conference | ||
| 09:00 | EUR | ECB Economic Bulletin | ||
| 11:00 | GBP | BoE Interest Rate Decision | 4.50% | 4.50% |
| 12:30 | CAD | Industrial Product Price M/M Feb | 1.60% | |
| 12:30 | CAD | Raw Material Price Index M/M Feb | 3.70% | |
| 12:30 | USD | Current Account (USD) Q4 | -337B | -311B |
| 12:30 | USD | Initial Jobless Claims (Mar 14) | 222K | 220K |
| 12:30 | USD | Philadelphia Fed Survey Mar | 12.1 | 18.1 |
| 14:00 | USD | Existing Home Sales Feb | 3.92M | 4.08M |
| 14:30 | USD | Natural Gas Storage | -62B | |
| 21:45 | NZD | Trade Balance NZD M/M Feb | -235M | -486M |
| 23:50 | JPY | National CPI Y/Y Feb | 4% | |
| 23:50 | JPY | National CPI CoreY/Y Feb | 2.90% | 3.20% |
| 23:50 | JPY | National CPI Core-Core Y/Y Feb | 2.50% |
| GMT | Ccy | Events | |
|---|---|---|---|
| 00:30 | AUD | Employment Change Feb | |
| Forecast: 30K | Previous: 44K | ||
| 00:30 | AUD | Unemployment Rate Feb | |
| Forecast: 4.10% | Previous: 4.10% | ||
| 01:00 | CNY | 1-Y Loan Prime Rate | |
| Forecast: 3.10% | Previous: 3.10% | ||
| 01:00 | CNY | 5-Y Loan Prime Rate | |
| Forecast: 3.60% | Previous: 3.60% | ||
| 07:00 | CHF | Trade Balance (CHF) Feb | |
| Forecast: 5.01B | Previous: 6.12B | ||
| 07:00 | EUR | GermanyPPI M/M Feb | |
| Forecast: 0.20% | Previous: -0.10% | ||
| 07:00 | EUR | GermanyPPI Y/Y Feb | |
| Forecast: | Previous: 0.50% | ||
| 07:00 | GBP | Claimant Count Change Feb | |
| Forecast: 7.9K | Previous: 22K | ||
| 07:00 | GBP | ILO Unemployment Rate (3M) Jan | |
| Forecast: 4.50% | Previous: 4.40% | ||
| 07:00 | GBP | Average Earnings Including Bonus 3M/Y Jan | |
| Forecast: 5.90% | Previous: 6.00% | ||
| 07:00 | GBP | Average Earnings Excluding Bonus 3M/Y Jan | |
| Forecast: | Previous: 5.90% | ||
| 08:30 | CHF | SNB Interest Rate Decision | |
| Forecast: 0.25% | Previous: 0.50% | ||
| 09:00 | CHF | SNB Press Conference | |
| Forecast: | Previous: | ||
| 09:00 | EUR | ECB Economic Bulletin | |
| Forecast: | Previous: | ||
| 11:00 | GBP | BoE Interest Rate Decision | |
| Forecast: 4.50% | Previous: 4.50% | ||
| 12:30 | CAD | Industrial Product Price M/M Feb | |
| Forecast: | Previous: 1.60% | ||
| 12:30 | CAD | Raw Material Price Index M/M Feb | |
| Forecast: | Previous: 3.70% | ||
| 12:30 | USD | Current Account (USD) Q4 | |
| Forecast: -337B | Previous: -311B | ||
| 12:30 | USD | Initial Jobless Claims (Mar 14) | |
| Forecast: 222K | Previous: 220K | ||
| 12:30 | USD | Philadelphia Fed Survey Mar | |
| Forecast: 12.1 | Previous: 18.1 | ||
| 14:00 | USD | Existing Home Sales Feb | |
| Forecast: 3.92M | Previous: 4.08M | ||
| 14:30 | USD | Natural Gas Storage | |
| Forecast: | Previous: -62B | ||
| 21:45 | NZD | Trade Balance NZD M/M Feb | |
| Forecast: -235M | Previous: -486M | ||
| 23:50 | JPY | National CPI Y/Y Feb | |
| Forecast: | Previous: 4% | ||
| 23:50 | JPY | National CPI CoreY/Y Feb | |
| Forecast: 2.90% | Previous: 3.20% | ||
| 23:50 | JPY | National CPI Core-Core Y/Y Feb | |
| Forecast: | Previous: 2.50% | ||
Friday, Mar 21, 2025
| GMT | Ccy | Events | Consensus | Previous |
|---|---|---|---|---|
| 00:01 | GBP | GfK Consumer Confidence Mar | -21 | -20 |
| 07:00 | GBP | Public Sector Net Borrowing (GBP) Feb | -10.9B | -15.4B |
| 09:00 | EUR | Eurozone Current Account (EUR) Jan | 38.4B | |
| 12:30 | CAD | New Housing Price Index M/M Feb | 0.00% | -0.10% |
| 12:30 | CAD | Retail Sales M/M Jan | -0.40% | 2.50% |
| 12:30 | CAD | Retail Sales ex Autos M/M Jan | 0.00% | 2.70% |
| 15:00 | EUR | Eurozone Consumer Confidence Mar P | -12.8 | -13.6 |
| GMT | Ccy | Events | |
|---|---|---|---|
| 00:01 | GBP | GfK Consumer Confidence Mar | |
| Forecast: -21 | Previous: -20 | ||
| 07:00 | GBP | Public Sector Net Borrowing (GBP) Feb | |
| Forecast: -10.9B | Previous: -15.4B | ||
| 09:00 | EUR | Eurozone Current Account (EUR) Jan | |
| Forecast: | Previous: 38.4B | ||
| 12:30 | CAD | New Housing Price Index M/M Feb | |
| Forecast: 0.00% | Previous: -0.10% | ||
| 12:30 | CAD | Retail Sales M/M Jan | |
| Forecast: -0.40% | Previous: 2.50% | ||
| 12:30 | CAD | Retail Sales ex Autos M/M Jan | |
| Forecast: 0.00% | Previous: 2.70% | ||
| 15:00 | EUR | Eurozone Consumer Confidence Mar P | |
| Forecast: -12.8 | Previous: -13.6 | ||
The Weekly Bottom Line: Markets Tumble as Continued Trade Fights Reignite Recession Concerns
Canadian Highlights
- Markets were on edge this week as the U.S. followed through on its 25% tariffs on steel and aluminum imports.
- Trade tensions haven’t fully translated into economic data yet. Canadian household wealth rose for the fifth consecutive quarter while debt servicing costs fell to the lowest level since 2022.
- The Bank of Canada cut its policy rate by 25 basis points to 2.75% this week, but Governor Tiff Macklem warned that monetary policy can’t fully offset a trade war.
U.S. Highlights
- All three major indexes briefly entered correction territory this week as the trade fight continued to escalate. The sentiment has partially recovered by Friday boosted by the news that the government shutdown was averted.
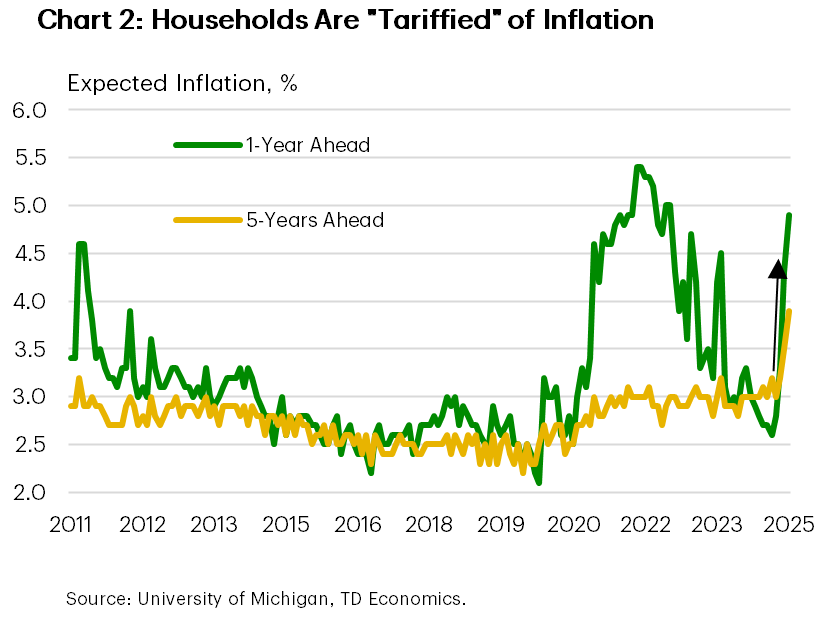
- Consumer and business confidence continued to slide amid high trade uncertainty, while inflation expectations continued to spike.
- Continued policy and inflation uncertainty will keep the Federal Reserve on the sideline at its meeting next week until some time this summer.
Canada – Bank of Canada Cuts But Can’t Fight a Trade War
Markets were on edge this week. The S&P/TSX fell about 1.5% for the week and is now down 5% from its January peak. Long-term bond yields initially dipped as recession fears grew amid escalating trade tensions, but rebounded later in the week, closing a few basis points higher. The Canadian dollar remained under pressure, ending the week unchanged at 69 cents U.S.
The so-called “golden era” promised by President Trump is giving way to a “period of transition”, marked by heightened market volatility as trade policies shift. On Wednesday, the U.S. administration imposed 25% tariffs on Canadian steel and aluminum imports.
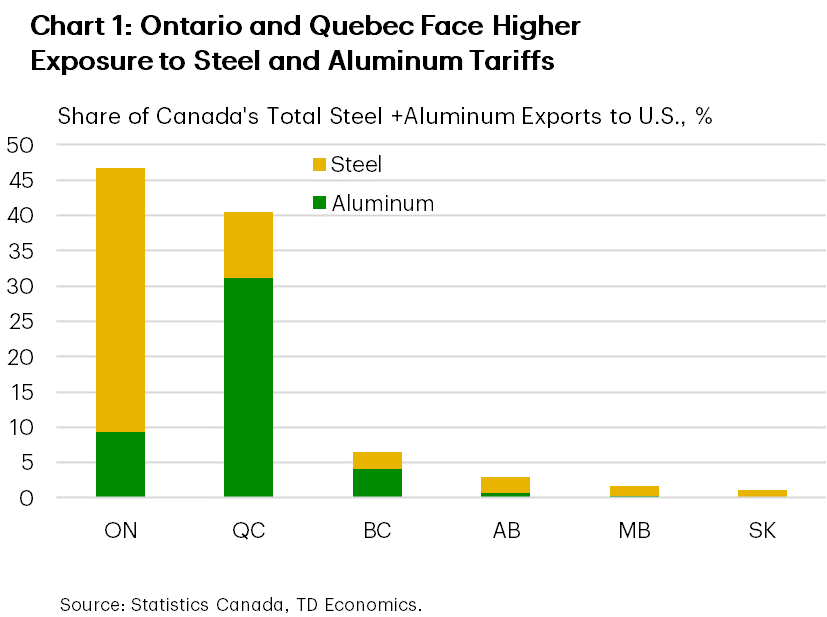
While steel and aluminum exports make up only about 6% of Canada’s total merchandise exports, the regional impact is more significant. Quebec produces most of Canada’s aluminum exports, while Ontario supplies the bulk of its steel exports to the U.S. (Chart 1). In response, Canada implemented new counter-tariffs on Thursday, adding to the $30 billion in U.S. imports already subject to duties as of last week.
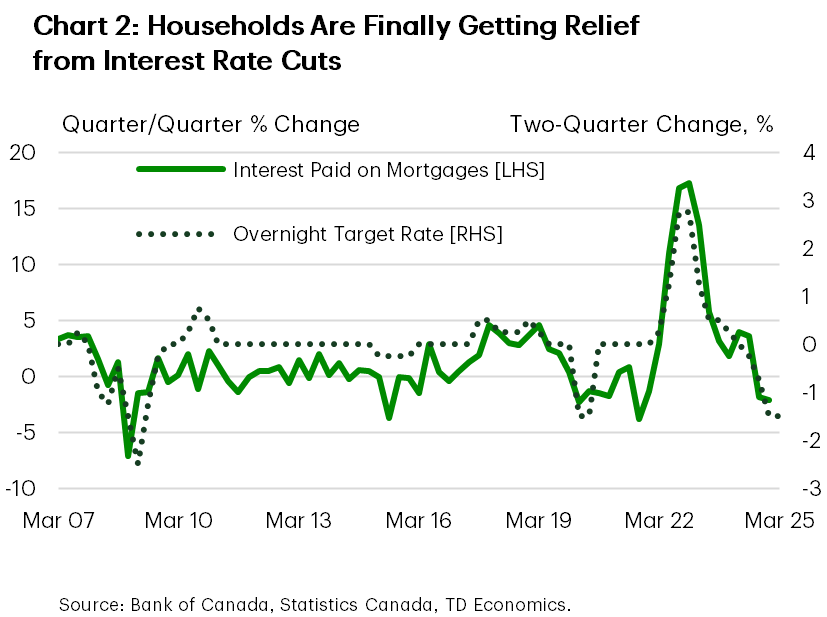
So far, tough trade rhetoric hasn’t fully translated into economic data. This week’s report on Canadian household balance sheet showed that wealth increased for the fifth consecutive quarter, supported by gains in financial and real estate assets. Importantly, households’ debt service ratio fell to its lowest level since 2022, reflecting the cumulative impact Bank of Canada rate cuts, which are now translating into lower aggregate interest payments (Chart 2). In turn, this should provide households with some financial relief, potentially supporting consumer spending.
However, uncertainty is weighing on sentiment. Preliminary results from the Bank of Canada’s business and consumer surveys suggest households are becoming more cautious with spending, while businesses – particularly in the manufacturing sector – are revising down their sales outlooks. Our latest TD debit and credit card spending data, set for release on March 17th, indicate that consumers are shifting toward precautionary savings and are cutting back on discretionary purchases. Still, given a solid hand-off into 2025, we anticipate one more quarter of above-trend growth in Q1 2025.
Beyond that, the outlook becomes murkier. The Bank of Canada cut its policy rate by 25 basis points to 2.75% this week, but Governor Tiff Macklem warned of “a new crisis” where “monetary policy cannot offset the impacts of a trade war”. This is because sustained tariffs risk lifting inflation, threatening the BoC’s hard-won 2% target. This limits how far the BoC can cut rates to support demand. As long as the pressure on tariffs remains in place, the BoC should keep its dovish bias, and we expect two more quarter-point cuts to take the overnight rate to 2.25% by June. Although markets are currently pricing in only a 50% chance of a cut next month.
U.S. – Markets Tumble as Continued Trade Fights Reignite Recession Concerns
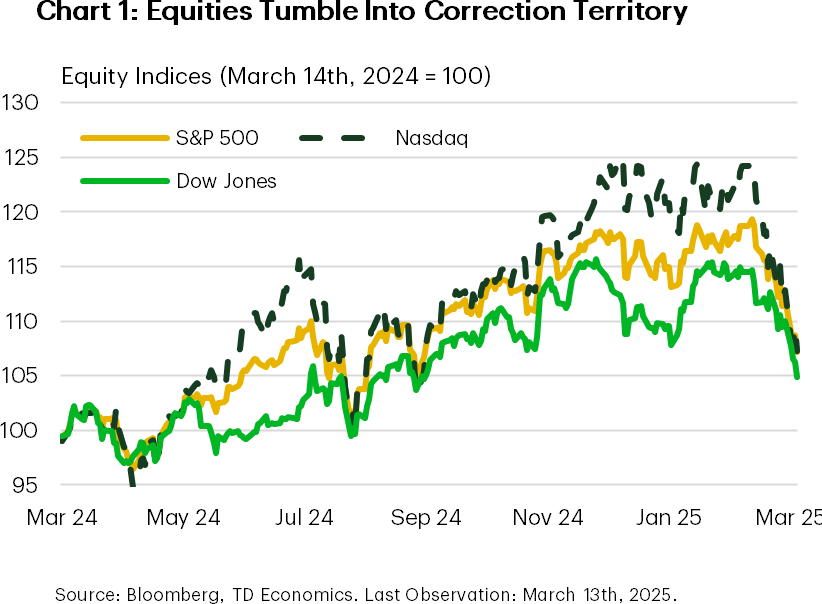
This has been another one of those “everything, everywhere, all at once” weeks. Investors were caught between a rock and a hard place, forced to navigate both a trade dispute and the threat of a potential government shutdown. Trade risks remain a major concern, reigniting fears of a recession and intensifying the selloff in financial markets. All three major indexes briefly entered correction territory, before retracting a bit on Friday as Senate Democrats appear to back the Republican’s stopgap spending bill that will keep the government funded through September 30th (Chart 1).
Tariff threats continued to dominate headlines this week, with the administration’s 25% steel and aluminum tariffs coming into effect on Wednesday, prompting retaliation from Canada, the E.U. and China. The E.U. imposed tariffs on $26 million of U.S. imports, while Canada imposed a 25% tariff on $30 billion worth of U.S. goods. In addition, China announced a 15% tariff on some key American farm products, such as pork, chicken, and soybeans, following the U.S.’s decision to raise the tariff rate on all Chinese imports by an additional 10% on March 4th – bringing the effective tariff rate on China to around 30%.
The recent ratcheting up of trade tensions has fueled concerns that tariffs could weight more meaningfully on growth this year and put further upward pressure on inflation. This week’s CPI report showed that inflationary pressures eased in February, with headline inflation slowing to 2.8% year-over-year down from 3% in January. While welcome, this reprieve may be short-lived as the latest numbers would have only captured the initial 10% tariff on China that came into effect on February 4th.
Business surveys indicate that inflation expectations and pricing intentions have risen, suggesting that price pressures are building in the supply chain. If tariffs remain in place, companies will eventually need to raise prices or absorb higher costs themselves. Some smaller businesses have already started raising prices. This week’s NFIB Small Business Confidence Survey showed a 10-point jump in the share of businesses increasing average selling prices.
Household confidence has also been weakening rapidly, driven not only by the recent stock market selloff but also by expectations of higher inflation in the months ahead. Indeed, the March reading of University of Michigan’s survey of consumer confidence shows that after declines in the prior two months, consumer confidence continued to nosedive this March – falling to the lowest level since November 2022. Year-ahead inflation expectations surged from 4.3% last month to 4.9% in March, marking the highest reading since November 2022 (Chart 2).
Given the current storm of uncertainty, the Federal Reserve is likely to remain on hold at its next meeting next week. With inflation expectations becoming more unhinged, we expect the Fed to remain on the sidelines until some time this summer, at which point slowing economic growth will likely prompt the need for additional support in the form of lower interest rates.
Weekly Economic & Financial Commentary: Steel Yourself for a Section 232 Revival
Summary
United States: Hard to Get a Clear View on Restless Waters
- Amid rising uncertainty, lagging indicators show activity was stable before the tariff storm. The number of job openings was slightly higher than anticipated at the end of January, and both the CPI and PPI came in softer than expected in February. Yet, we expect a mixture of weaker hiring and stronger inflation by midyear, which would present a challenge to the FOMC. We now look for the Committee to cut 75 bps, bringing the fed funds rate target range to 3.50%-3.75% by year-end.
- Next week: Retail Sales (Mon.), Industrial Production (Tue.), FOMC (Wed.)
International: Mix of Economic News and Data from Global Economies
- This week saw a variety of economic developments and data releases from G10 and emerging economies. The Bank of Canada lowered its policy rate by 25 bps this week to 2.75% and provided accompanying commentary that was somewhat mixed, but overall somewhat dovish-leaning, in our view. The U.K. economy unexpectedly shrank in January, early results from the spring wage negotiations in Japan look encouraging and Norway saw an upside inflation surprise. Brazil's monthly inflation data, while not coming in as a surprise, continued to point to elevated price pressures.
- Next week: China Industrial Production and Retail Sales (Mon.), Bank of Japan Policy Rate (Wed.), Brazilian Central Bank Selic Rate (Wed.)
Credit Market Insights: Why Have Mortgage Rates Remained Elevated?
- Amid high mortgage rates, purchasing and refinancing applications remain suppressed from their earlier peaks. Even with the Federal Reserve's easing cycle being under way, mortgage rates remain high with upward pressure from the 10-year Treasury and mortgage spread.
Topic of the Week: Steel Yourself for a Section 232 Revival
- This week, the 25% tariffs on steel and aluminum imports announced by the Trump administration last month went into effect. All imports of certain steel articles and derivative steel articles are subject to the 25% tariffs under Section 232, essentially eliminating the carve-outs to the original Section 232 tariffs enacted during President Trump's first term (with a few changes).
Fed Expected to Keep Interest Rates on Hold, Canadian Price Growth to Move Higher
The balance of risk around the U.S.’s growth may be shifting, but government data still shows a strong economy and that will likely lead the U.S. Federal Reserve to stand pat on interest rates on Wednesday.
At the recent U.S. Monetary Policy Conference in Chicago, Chair Jerome Powell said that “despite elevated levels of uncertainty, the U.S. economy continues to be in a good place.”
Our own forecasts for U.S. GDP growth for 2025 have been marked lower on signs that an 11-quarter run of steady growth may have paused in Q1. The U.S. economy is less sensitive to international trade risks than many of its close trading partners (like Canada), but some sectors, particularly manufacturing, will be negatively impacted by tariff increases.
Still, labour markets look firm. The Trump administration’s DOGE cuts will likely nudge the unemployment rate higher in coming months but we expect it to remain historically low. A slower month-over- month increase in the consumer price index (CPI) in February confirmed that a spike in prices in January was more a reflection of technical seasonal adjustment issues than a change in trend, but inflation is still running above the Fed’s 2% objective.
Our base case assumption is that an outperforming U.S. economy and above-target inflation will keep the Fed from cutting the fed funds target range this year. But, the balance of risks around that call have been shifting with market expectations for additional cuts already showing up significantly in lower term bond yields.
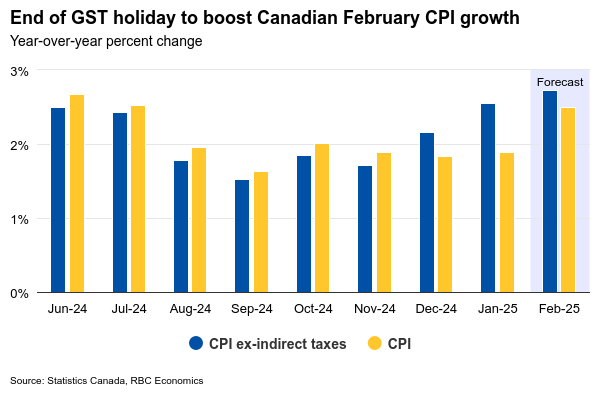
In Canada, the focus will be on February CPI data—in addition to international trade headlines. We expect to see a rise in year-over-year price growth to 2.5% with the GST tax holiday that mechanically depressed prices in December and January, ending in mid-February. That would end a string of six straight readings at or below the Bank of Canada’s 2% inflation target.
Indeed, evidence was building that a faster-than-expected re-acceleration in Canadian growth late last year and into early 2025 was also putting a floor under inflation. The BoC’s preferred “median” and “trim” core measures (which exclude the impact of changes in indirect taxes) picked up 2.7% year-over-year on average in January, and we expect it likely edged higher again in February. But, concerns that intensifying international trade risks will weigh on the economy are overshadowing stronger recent growth data. We continue to expect further BoC interest rate cuts down to 2.25% this summer.
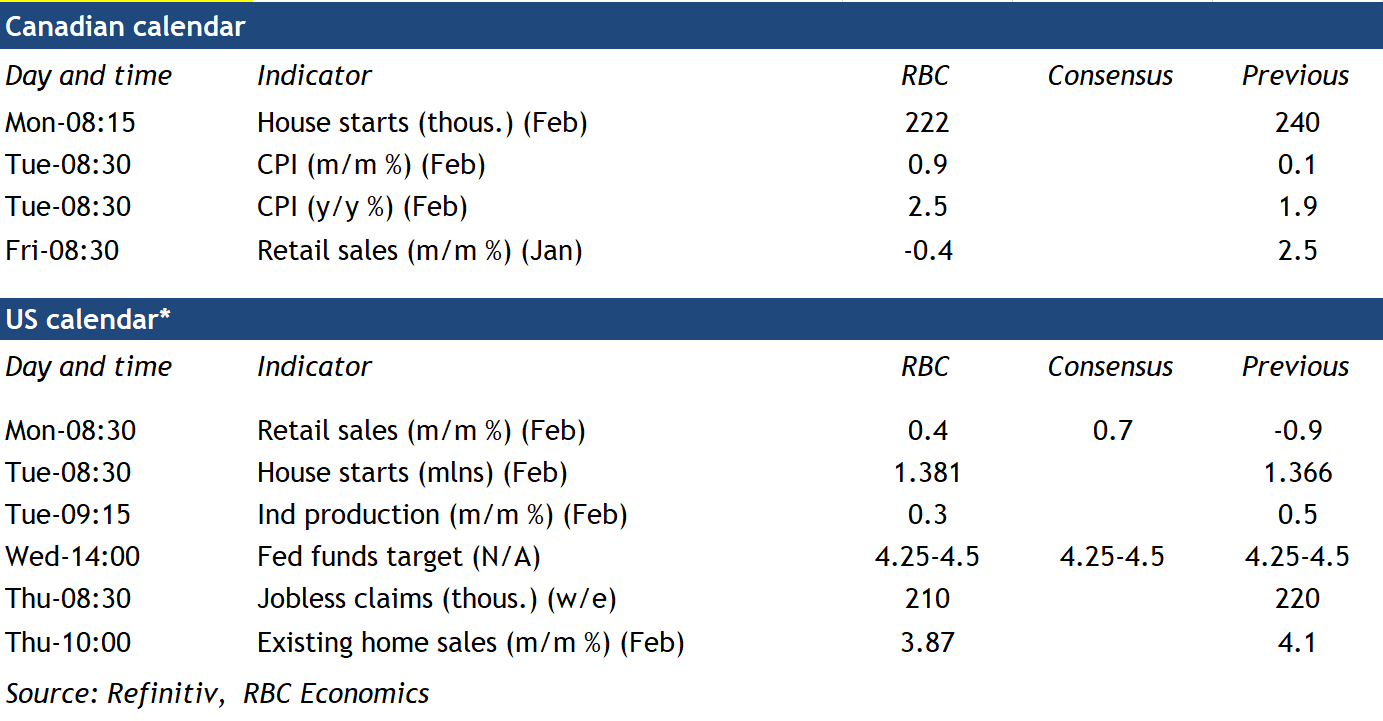
Week ahead data watch
Canadian retail sales are expected to contract by 0.4% in January, following robust growth in the previous month. This decline is primarily attributed to a significant 9% reduction in unit auto sales, partially offset by higher sales at gas stations due to price increases.
Canadian housing starts are forecasted to decrease to 222,000 units in February from 240,000 in January. February's construction activity was notably hampered by severe winter storms.
U.S. retail sales are expected to rise 0.4% in February, partially recovering from January's contraction. This growth is largely fueled by stronger auto sales and increased gas station sales.
U.S. industrial production is anticipated to expand by 0.3%, mainly driven by extended manufacturing hours that have boosted output across the sector.