
Sample Category Title
AUD/USD Daily Report
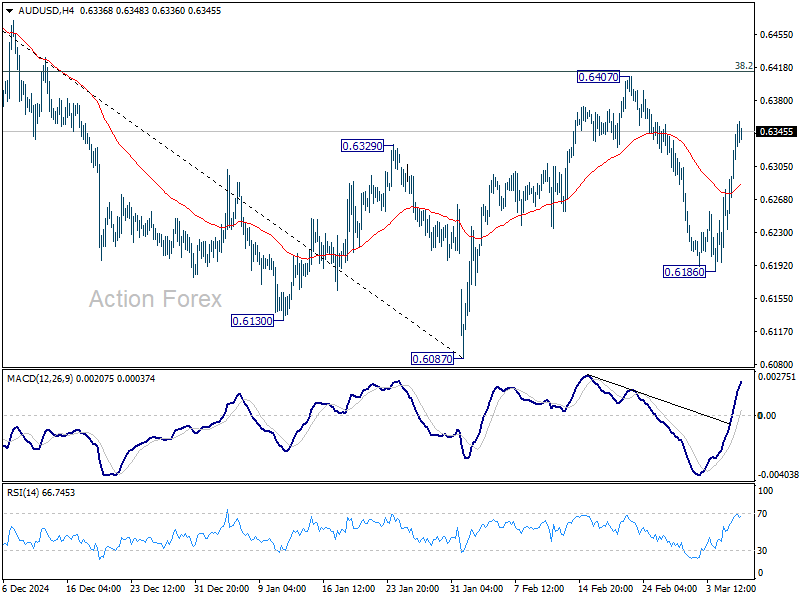
Daily Pivots: (S1) 0.6265; (P) 0.6304; (R1) 0.6374; More...
Intraday bias in AUD/USD remains neutral as range trading continues. On the downside, below 0.6186 will resume the fall from 0.6407 to retest 0.6087 low. However, sustained trading above 38.2% retracement of 0.6941 to 0.6087 at 0.6413 will raise the chance of near term bullish reversal, and target 61.8% retracement at 0.6615 next.
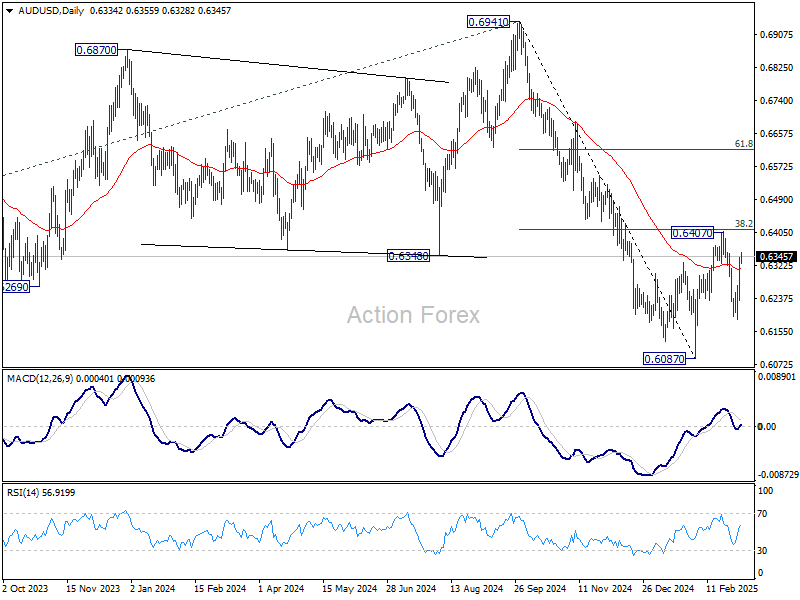
In the bigger picture, fall from 0.6941 (2024 high) is seen as part of the down trend from 0.8006 (2021 high). Next medium term target is 61.8% projection of 0.8006 to 0.6169 from 0.6941 at 0.5806. In any case, outlook will stay bearish as long as 55 W EMA (now at 0.6494) holds.
USD/JPY Daily Outlook
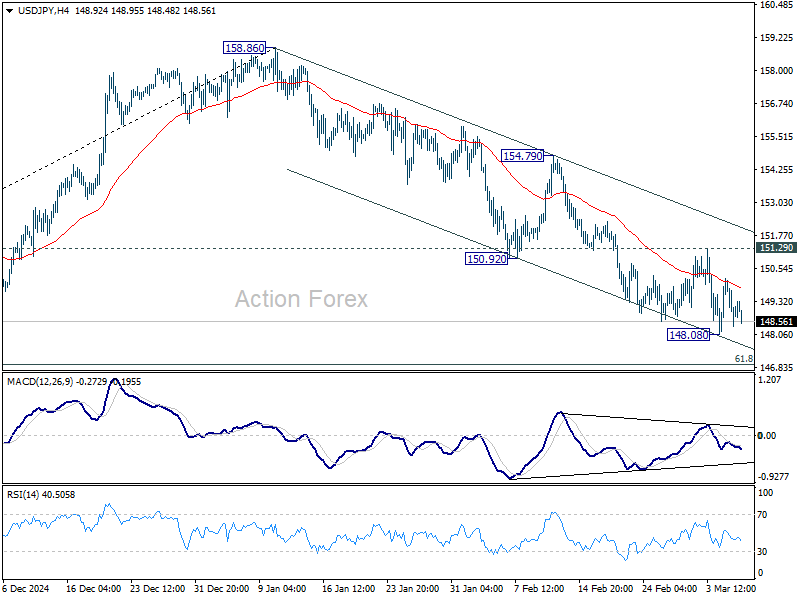
Daily Pivots: (S1) 148.12; (P) 149.15; (R1) 149.91; More...
Intraday bias in USD/JPY remains neutral for consolidations above 148.08. With 151.29 resistance intact, fall from 158.86 is expected to continue as the third leg of the corrective pattern from 171.96 high. Below 148.08 will target 61.8% retracement of 139.57 to 158.86 at 146.32. Sustained break there will pave the way back to 139.57 low. However, break of 151.29 will turn bias back to the upside for stronger recovery first.
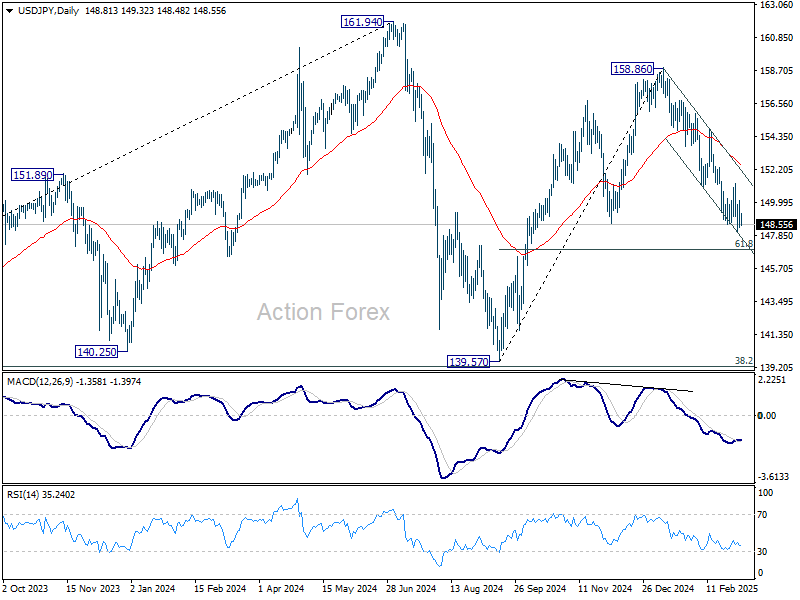
In the bigger picture, price actions from 161.94 are seen as a corrective pattern to rise from 102.58 (2021 low). In case of another fall, strong support should be seen from 38.2% retracement of 102.58 to 161.94 at 139.26 to bring rebound. However, sustained break of 139.26 would open up deeper medium term decline to 61.8% retracement at 125.25.
USD/CHF Daily Outlook
Daily Pivots: (S1) 0.8871; (P) 0.8893; (R1) 0.8930; More…
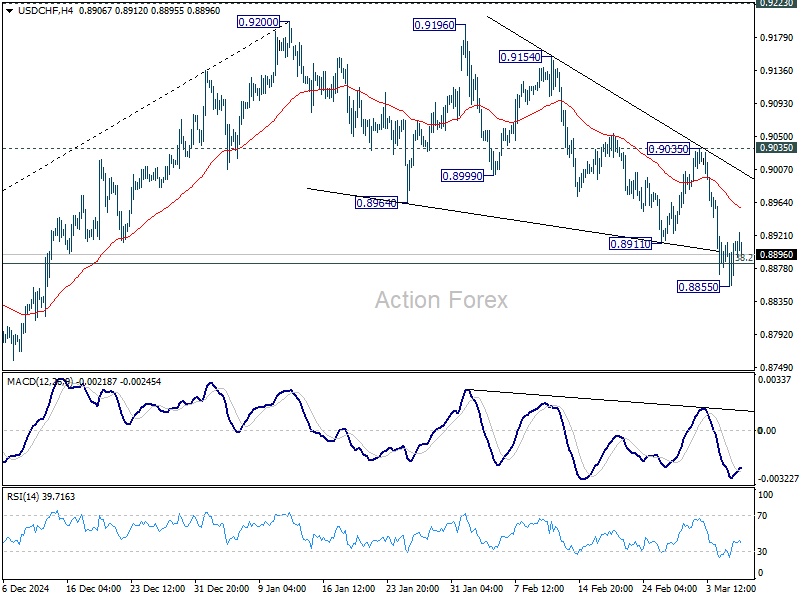
Intraday bias in USD/CHF is turned neutral with current recovery. Strong rebound from 38.2% retracement of 0.8374 to 0.9200 at 0.8884, followed by break of 0.9035 resistance, will retain near term bullishness, and bring retest of 0.9200/23 resistance zone. However, firm break of 0.8444 will confirm rejection by 0.9223 resistance and turn near term outlook bearish for 61.8% retracement at 0.8690.
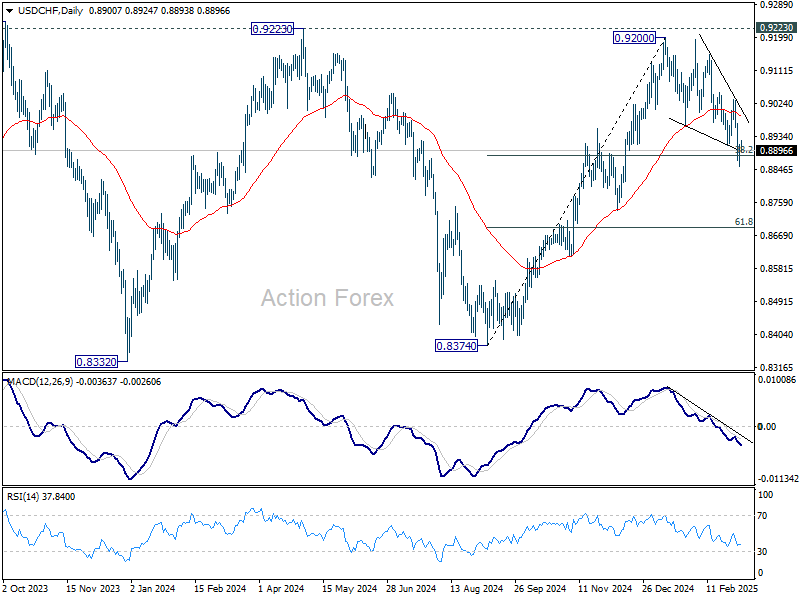
In the bigger picture, decisive break of 0.9223 resistance will argue that whole down trend from 1.0342 (2017 high) has completed with three waves down to 0.8332 (2023 low). Outlook will be turned bullish for 1.0146 resistance next. Nevertheless, rejection by 0.9223 will retain medium term bearishness for another decline through 0.8332 at a later stage.
GBP/USD Daily Outlook
Daily Pivots: (S1) 1.2808; (P) 1.2855; (R1) 1.2941; More...
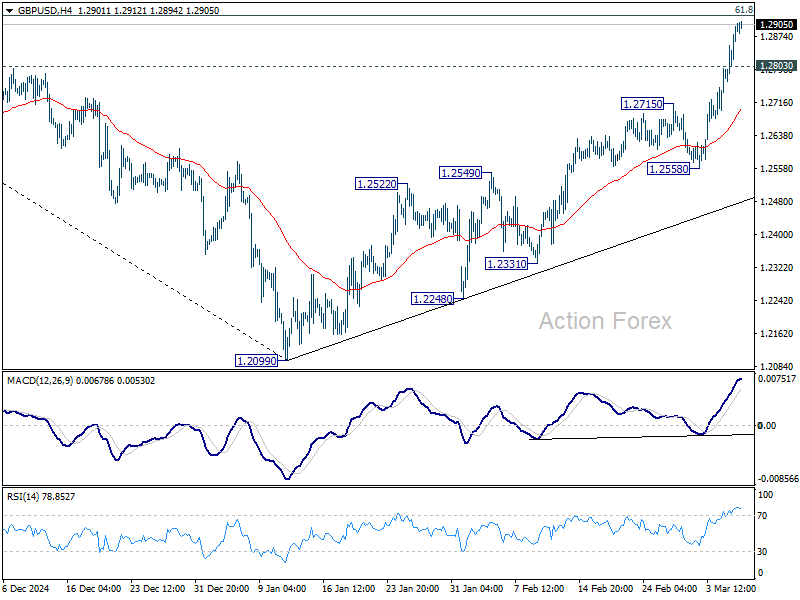
Intraday bias in GBP/USD remains on the upside for the moment, as rise from 1.2099 continues today. Sustained break of 61.8% retracement of 1.3433 to 1.2099 at 1.2923 will pave the way back to 1.3433 high. On the downside, below 1.2803 minor support will turn intraday bias neutral and bring consolidations. But downside should be contained well above 1.2558 support to bring another rally.
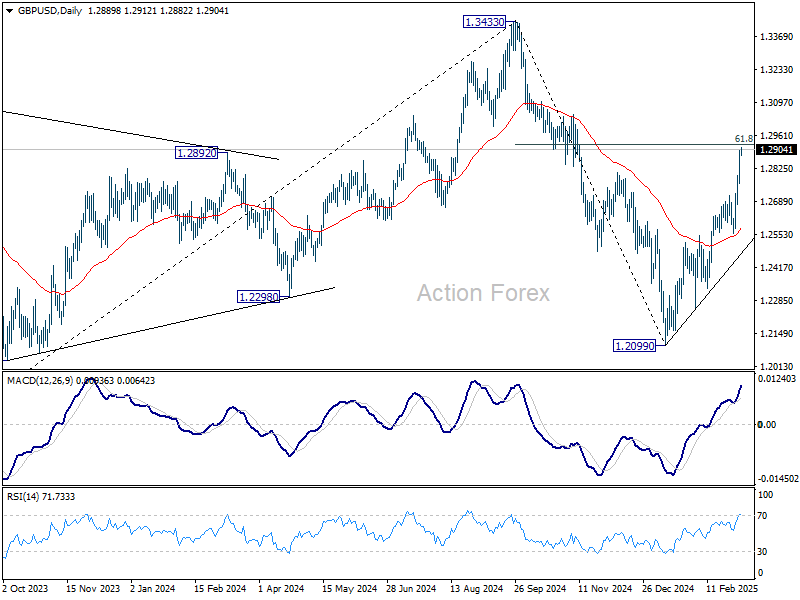
In the bigger picture, fall from 1.3433 (2024 high) should have completed at 1.2099 as a corrective move. Up trend from 1.3051 (2022 low) is still in progress but it's too early to say that it's resuming. Corrective pattern from 1.3433 could extend with one more down leg. But after all, eventual upside breakout is expected at a later stage.
EUR/USD Daily Outlook
Daily Pivots: (S1) 1.0662; (P) 1.0729; (R1) 1.0857; More...
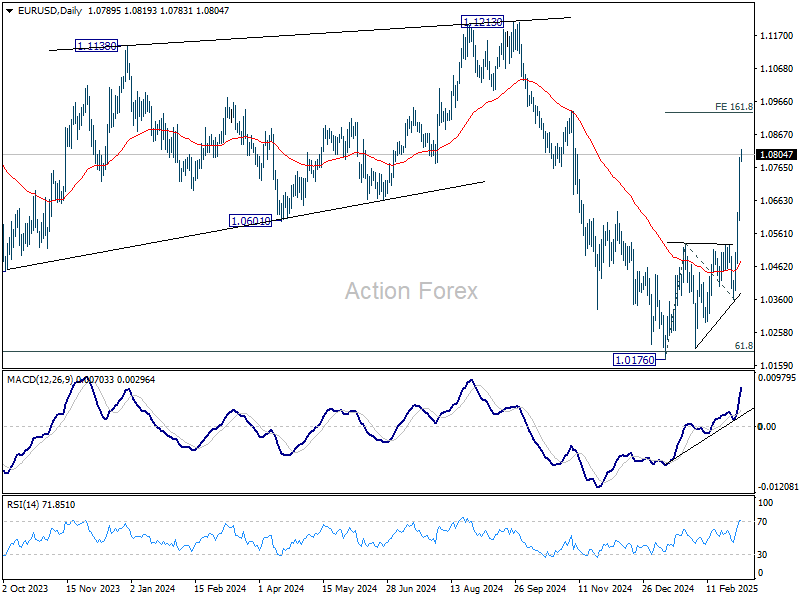
Intraday bias in EUR/USD remains on the upside as current rally from 1.0176 is still in progress. Next target is 161.8% projection of 1.0176 to 1.0531 from 1.0358 at 1.0932 On the downside, below 1.0721 minor support will turn intraday bias neutral and bring consolidations first, before staging another rise.
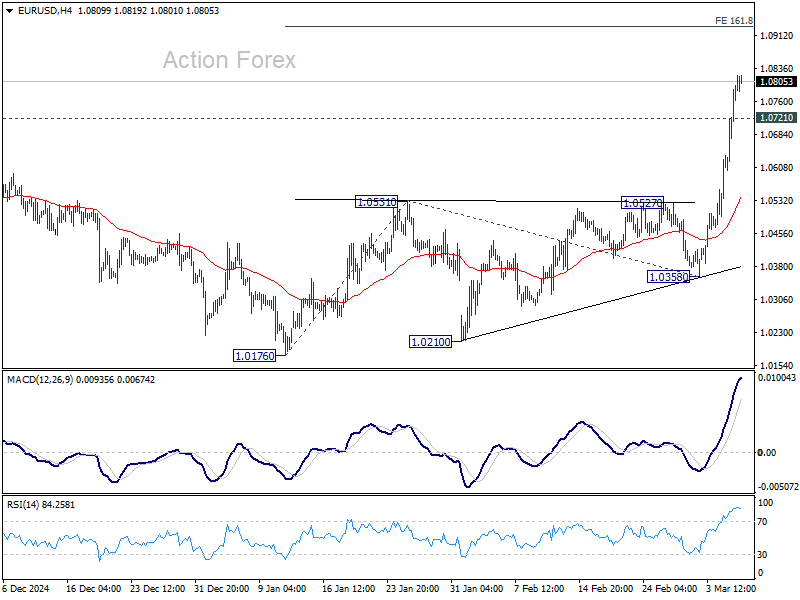
In the bigger picture, the strong break of 55 W EMA (now at 1.0668) suggests that fall from 1.1274 (2024 high) has completed as a three wave correction to 1.0176. That came after drawing support from 0.9534 (2022 low) to 1.1274 at 1.0199. Rise from 0.9534 is still intact, and might be ready to resume through 1.1274. This will now be the favored case as long as 1.0531 resistance turned support holds.
Tariff Pause for Automakers Soothes Markets, Euro Stands Tall Ahead of ECB Cut
Risk sentiment is mildly positive in Asian session today, as investors digest the latest developments in US trade policy and Chinese economic measures. Markets welcomed the news that the US has granted a one-month exemption for imports from Mexico and Canada for auto makers. The decision came after US President Donald Trump met with executives from Ford, General Motors, and Stellantis, who urged him to delay the levies to avoid disruptions in the industry.
Meanwhile, Hong Kong stocks surged to a three-month high, with optimism fueled by hints from China's National People’s Congress about looser monetary policies, along with expectations for further stimulus. Adding to the bullish momentum, tech giant Alibaba saw its stock soar after unveiling a new AI model, which it claims is competitive with DeepSeek, a major player in the artificial intelligence race. The rally in Chinese markets is adding to overall risk appetite in Asia, though uncertainties remain around US-China trade tensions.
In the currency markets, Euro continues to lead gains for the week as investors anticipate today’s ECB policy decision. The central bank is widely expected to deliver a 25-basis-point rate cut, but the outlook for further easing is more uncertain than ever. A trade war with the US is adding downside risks to growth, while Europe's major economies are making historic shifts in fiscal policy, particularly in Germany, where new spending initiatives could support economic expansion. These conflicting factors make it challenging to predict ECB’s path beyond today’s meeting.
ECB President Christine Lagarde’s press conference is unlikely to provide strong forward guidance, as policymakers will want to maintain flexibility amid rising geopolitical and trade uncertainties. However, despite the upcoming rate cut, Euro's rally looks well-supported in the near term, particularly as markets focus on Europe’s growing fiscal momentum and rearmament plans.
Sterling is the second strongest performer, followed by New Zealand Dollar. In contrast, Dollar remains at the bottom of the performance ladder, looking increasingly vulnerable ahead of tomorrow’s Non-Farm Payrolls report. Canadian Dollar is the second-worst performer of the week and Japanese Yen is also under pressure. Swiss Franc and Australian Dollar are positioned in the middle of the pack.
In Asia, at the time of writing, Nikkei is up 0.82%. Hong Kong HSI is up 3.03%. China Shanghai SSE is up 0.78%. Singapore Strait Times is up 0.72%. Japan 10-year JGB yield is up 0.053 at 1.499, hitting a 16-year high. Overnight, DOW rose 1.14%. S&P 500 rose 1.12%. NASDAQ rose 1.46%. 10-year yield rose 0.055 to 4.265.
ECB to cut rates, but trade war and fiscal shifts cloud outlook
ECB is widely expected to continue its “regular, gradual” easing cycle today, reducing the deposit rate by 25bps to 2.50%. Markets are still pricing in two more cuts this year, but the path forward has become murkier in light of recent geopolitical and economic shifts. Also, interest rates are approaching neutral levels, making further easing a more delicate decision.
On one hand, trade tensions with the US loom large, and the fallout from fresh tariffs and retaliatory measures could weigh on Eurozone’s already fragile economic recovery. On the other hand, the announcement of transformational fiscal changes in both Germany and at the European Commission level—aimed at boosting defense and infrastructure spending—could have a significant long-term impact on growth, partially offsetting the headwinds from a trade war.
ECB’s new economic projections, to be released alongside today’s decision, are expected to show weaker growth and marginally higher inflation. However, data collection for these forecasts took place weeks ago, rendering them less reflective of the rapidly evolving environment. Thus, their usefulness for predicting medium-term policy moves may be limited, with markets keeping an even closer eye on the ECB’s forward guidance instead.
Euro has been exceptionally strong this week, with recent optimism boosted by developments in European fiscal policy. It's rally is unlikely to be deter by today's ECB outcome.
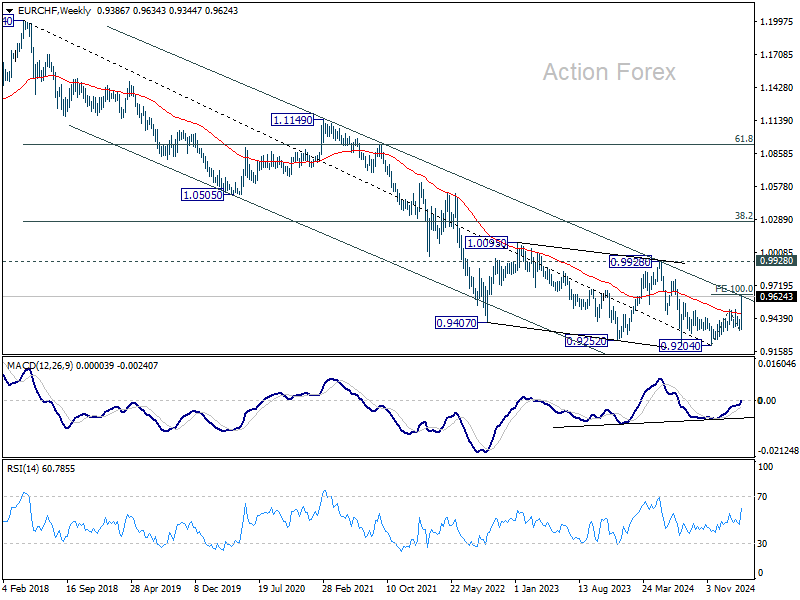
Technically, EUR/CHF has surged aggressively, now pressing long-term falling channel resistance (at around 0.9620), after decisively breaking above 55 W EMA. Sustained break above this resistance would suggest that the downtrend from 1.2004 (2018 high) has finally bottomed at 0.9204.
Sustained trading above the channel resistance will be argue that whole down trend from 1.2004 (2018 high) has completed at 0.9204, on bullish convergence condition in W MACD.
In this bullish case, further rise should be seen to 0.9928 structural resistance at least, with prospect of stronger rally, even still as a medium term corrective move.
Fed's Beige Book: Modest growth, rising price pressures, and tariff concerns
Fed’s Beige Book report indicated that "economic activity rose slightly" since mid-January, with mixed regional performances. While four Districts saw modest or moderate growth, six reported no change, and two experienced slight contractions.
Consumer spending was generally lower, with essential goods seeing steady demand but discretionary spending weakening, particularly among lower-income consumers. However, business expectations remained "slightly optimistic" for the coming months.
On the labor front, employment "nudged slightly higher" overall, though wage growth slowed modestly compared to the previous report.
While price pressures remained moderate, several Districts noted an uptick in the pace of increase, particularly in manufacturing and construction. Many firms struggled to pass higher input costs onto customers, but expectations of tariffs on imports were already prompting preemptive price hikes in some sectors.
On the data front
Swiss unemployment rate, UK PMI construction and Eurozone retail sales will be released in European session. Later in the day, Canada will release trade balance and Ivey PMI. US will publish jobless claims, trade balance, and non-farm productivity.
EUR/USD Daily Outlook
Daily Pivots: (S1) 1.0662; (P) 1.0729; (R1) 1.0857; More...
Intraday bias in EUR/USD remains on the upside as current rally from 1.0176 is still in progress. Next target is 161.8% projection of 1.0176 to 1.0531 from 1.0358 at 1.0932 On the downside, below 1.0721 minor support will turn intraday bias neutral and bring consolidations first, before staging another rise.
In the bigger picture, the strong break of 55 W EMA (now at 1.0668) suggests that fall from 1.1274 (2024 high) has completed as a three wave correction to 1.0176. That came after drawing support from 0.9534 (2022 low) to 1.1274 at 1.0199. Rise from 0.9534 is still intact, and might be ready to resume through 1.1274. This will now be the favored case as long as 1.0531 resistance turned support holds.
Elliott Wave View Dollar Index (DXY) Nesting Impulsively Lower
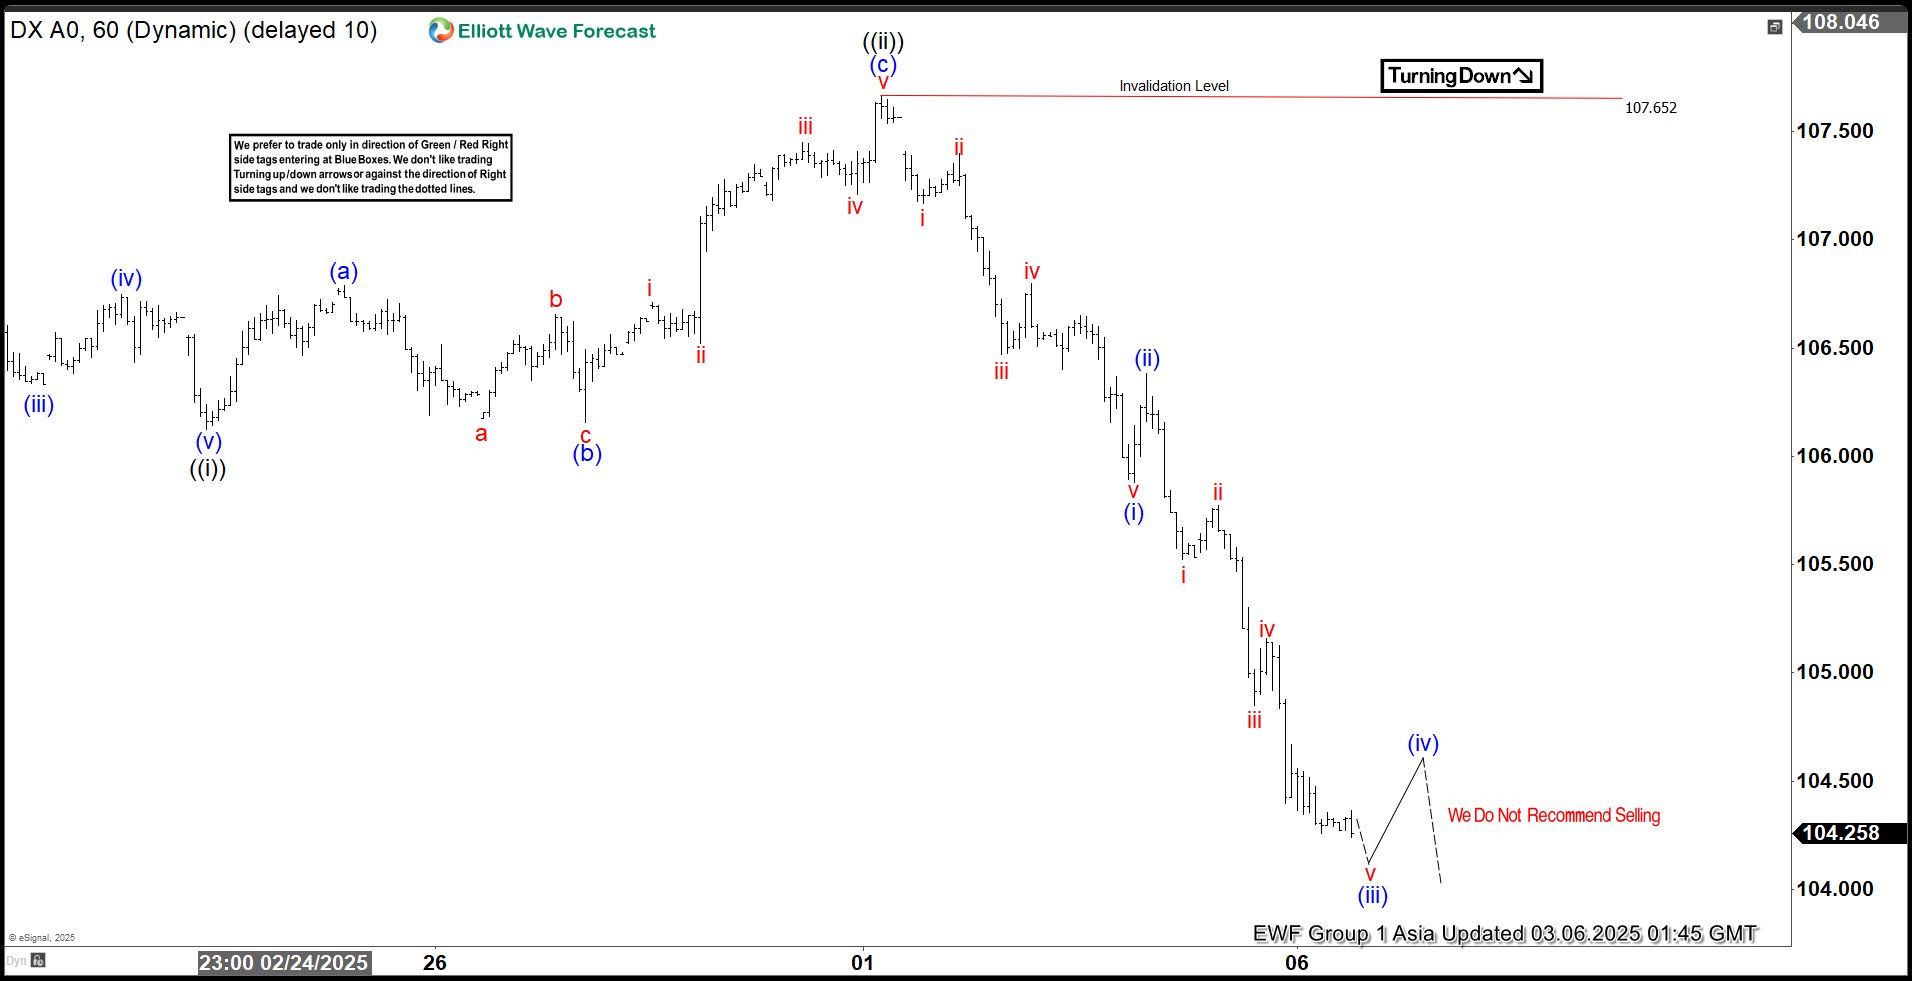
Short Term Elliott Wave View in Dollar Index (DXY) suggests the decline from 1.13.2025 peak is taking the form of an impulse with extension (nesting). Down from there, wave 1 ended at 106.97 and rally in wave 2 ended at 109.88. The ETF extended lower in wave 3 which is unfolding in 5 waves in lesser degree. Down from wave 2, wave ((i)) ended at 106.12 as the 1 hour chart below shows. Rally in wave ((ii)) unfolded as a zigzag Elliott Wave structure. Up from wave ((i)), wave (a) ended at 106.79 and pullback in wave (b) ended at 106.16. Rally in wave (c) ended at 107.65 which completed wave ((ii)) in higher degree.
The ETF extended lower in wave ((iii)). Down from wave ((ii)), wave (i) ended at 105.87 and wave (ii) rally ended at 106.38. The ETF extended lower in wave (iii). Expect wave (iv) rally to fail for further downside to complete wave (v) of ((iii)). Potential target lower is 100% – 161.8% Fibonacci extension of wave ((i)). This area comes at 101.59 – 103.9 where wave (v) of ((iii)) should end. Near term, as far as pivot at 107.65 high stays intact, expect rally to fail in 3, 7, or 11 swing for further downside.
Dollar Index (DXY) 60 Minutes Elliott Wave Chart
DXY Video
https://www.youtube.com/watch?v=kwxh9gnRUR4
ECB to cut rates, but trade war and fiscal shifts cloud outlook
ECB is widely expected to continue its “regular, gradual” easing cycle today, reducing the deposit rate by 25bps to 2.50%. Markets are still pricing in two more cuts this year, but the path forward has become murkier in light of recent geopolitical and economic shifts. Also, interest rates are approaching neutral levels, making further easing a more delicate decision.
On one hand, trade tensions with the US loom large, and the fallout from fresh tariffs and retaliatory measures could weigh on Eurozone’s already fragile economic recovery. On the other hand, the announcement of transformational fiscal changes in both Germany and at the European Commission level—aimed at boosting defense and infrastructure spending—could have a significant long-term impact on growth, partially offsetting the headwinds from a trade war.
ECB’s new economic projections, to be released alongside today’s decision, are expected to show weaker growth and marginally higher inflation. However, data collection for these forecasts took place weeks ago, rendering them less reflective of the rapidly evolving environment. Thus, their usefulness for predicting medium-term policy moves may be limited, with markets keeping an even closer eye on the ECB’s forward guidance instead.
Euro has been exceptionally strong this week, with recent optimism boosted by developments in European fiscal policy. It's rally is unlikely to be deter by today's ECB outcome.
Technically, EUR/CHF has surged aggressively, now pressing long-term falling channel resistance (at around 0.9620), after decisively breaking above 55 W EMA. Sustained break above this resistance would suggest that the downtrend from 1.2004 (2018 high) has finally bottomed at 0.9204.
Sustained trading above the channel resistance will be argue that whole down trend from 1.2004 (2018 high) has completed at 0.9204, on bullish convergence condition in W MACD.
In this bullish case, further rise should be seen to 0.9928 structural resistance at least, with prospect of stronger rally, even still as a medium term corrective move.
Fed’s Beige Book: Modest growth, rising price pressures, and tariff concerns
Fed’s Beige Book report indicated that "economic activity rose slightly" since mid-January, with mixed regional performances. While four Districts saw modest or moderate growth, six reported no change, and two experienced slight contractions.
Consumer spending was generally lower, with essential goods seeing steady demand but discretionary spending weakening, particularly among lower-income consumers. However, business expectations remained "slightly optimistic" for the coming months.
On the labor front, employment "nudged slightly higher" overall, though wage growth slowed modestly compared to the previous report.
While price pressures remained moderate, several Districts noted an uptick in the pace of increase, particularly in manufacturing and construction. Many firms struggled to pass higher input costs onto customers, but expectations of tariffs on imports were already prompting preemptive price hikes in some sectors.
What is the Impact of Tariffs on the U.S. Economy?
The effective U.S. tariff rate is now at its highest level since the 1940s after U.S. President Donald Trump signed an executive order to impose 25% tariffs on Canada and Mexico on March 4. A new order was also signed for China, increasing tariffs to 20% from 10%.
In our previous notes (here, here, and here), we estimated the potential shock to the North American economy resulting from a prolonged trade war. If these tariffs are kept in place in the months ahead, we expect to see slowing growth, an uptick in inflation, and a hit to consumer and business confidence. As we continue to monitor the situation, we have put together a list of frequently asked questions about the impact of these tariffs on the U.S. economy.
1. How important is U.S. trade with Canada, Mexico, and China?
Canada, Mexico, and China combined account for 40% of U.S. trade. These regions make up a sizeable share of essential imports for energy products and groceries, alongside automobiles and intermediate products necessary for U.S. manufacturing. American consumers rely on these imports since consumer demand exceeds domestic production for many goods. The implementation of tariffs is likely to have a significant near-term impact on the U.S. economy, because the U.S. is not able to immediately ramp up oil production, grow more produce or increase production capacity for many goods.
2. Will there be a recession and how will this impact U.S. growth?
We are not expecting the impact of tariffs to cause a recession in the U.S. However, if tariffs are left in place for three months or more, we will likely see no growth for the U.S. economy in 2025. We do expect Canada to fall into a recession in this scenario. For now, we don’t know how long the tariffs will last, especially since they are not solely economically motivated. But, if the current political climate is any indication, trade disruption will continue to be a key theme throughout the year and will add to uncertainty. That uncertainty will continue to weigh on investment activity as businesses struggle to make decisions amid a noisy and volatile backdrop.
3. Which sectors will be hit the hardest?
North America’s manufacturing sector is highly integrated and would, therefore, be hit the hardest from tariffs on imports with key trading partners. The auto manufacturing sector is, particularly, exposed. U.S. intermediate products account for a significant share of imported goods from Canada and Mexico as it crosses the border through multiple stages of auto production. Agriculture is another sector that would be significantly impacted since Canada, Mexico, and China account for roughly half of U.S. agricultural imports. China accounts for close to $100 billion of U.S. non-durable imports including chemicals, pharmaceuticals, paper products, and textiles.
4. How easy is it for the U.S. to “reshore” the most impacted sectors?
Reshoring is not as simple as it sounds. In fact, in the short term, reshoring is very difficult as significant levels of capital investment take years to plan and execute. The ability to produce goods domestically requires investment in land, factories, and machinery equipment and those decisions are challenging in a high-interest-rate environment. In the medium term, new supply chains would need to be established, adding to operating costs. In the longer term, the U.S. is facing labor supply constraints, limiting the production capacity of any new factories. The aging population is resulting in a record number of retirements. In particular, 26% of workers in manufacturing are over age 55. Added to this, the decline in immigration and notable geographic and skills mismatches in the manufacturing sector suggests reshoring activity may need to be capital intensive and could result in limited job creation.
5. How might tariffs show up in U.S. inflation measures?
Tariffs will very likely result in higher prices for U.S. consumers. Since it is difficult to substitute away from many imports from key trading partners, we expect to see the cost of tariffs passed on to domestic producers (as measured by the Producer Price Index), and ultimately, consumers (as measured by the Consumer Price Index). This would likely create sticky inflation above 3% through year-end. Prices for essentials will likely increase the most including groceries and energy. Goods prices will face upward pressure, removing much of the deflationary forces seen over the past year. We estimate that inflation could increase by 50 bps by year-end if tariffs are enforced beyond 3 months.
6. How will tariffs impact U.S. consumers?
Tariffs will impact all U.S. consumers, but the burden will be heavier for low-and-middle-income earners, who devote a greater share of their take-home pay to purchasing essentials. In the aftermath of the pandemic when inflation surged, the 25% uptick in energy prices felt more like 30% for America’s lower-and-middle income households. Tariff-driven price increases will add to the pressure these households are still contending with and will erode consumer confidence further.
7. How much revenue could tariffs generate for the U.S.?
Based on 2024 import data from Canada, Mexico, and China, the announced tariffs could boost total U.S. tariff revenues by about $300 billion, assuming demand remains unchanged. This would amount to roughly one-third of the annual cost of Trump’s proposed extension to the Tax Cuts and Jobs Act. However, this doesn’t take into account the fact that demand for imports from regions affected by tariffs is likely to shrink as producers attempt to source products from non-tariffed countries. This could be particularly acute for consumer-related sectors as U.S. consumers continue to be squeezed by inflation and look to reduce their demand for goods with rising prices. The ultimate boost to revenue is likely to be smaller than the $300 billion noted above, considering reduced demand and potential substitution effects.
8. How easy or difficult is it to substitute away from tariffed imports?
Many of the imported goods are not easily substituted in the U.S. economy. For example, Canada, Mexico, and China account for 60% of aluminum, lumber, and energy product imports. Energy infrastructure takes years to develop, and the U.S. is highly dependent on Canada for electricity imports (specifically in the Northeast) in addition to crude oil due to geographic proximity. Moreover, nearly one-third of fruits and vegetables consumed in by Americans are imported from Canada, Mexico, and China. Agricultural production is constrained by environmental factors, and the U.S. would need to import from other regions. Distance adds to logistical challenges, which would likely add to shipping costs.
9. How might the U.S. Federal Reserve respond?
The Fed is in a tough position since the U.S. will likely face both higher inflation and weaker demand for U.S. products from abroad and domestic consumers grappling with higher prices. According to our U.S. Rates Strategist, Blake Gwinn, “The downside risks of additional cuts have significantly increased. The longer these tariffs remain in place, and the broader the trade war gets, the more likely it gets that we will be adding cuts back into our 2025 outlook.”