
Sample Category Title
USD/CAD Daily Outlook
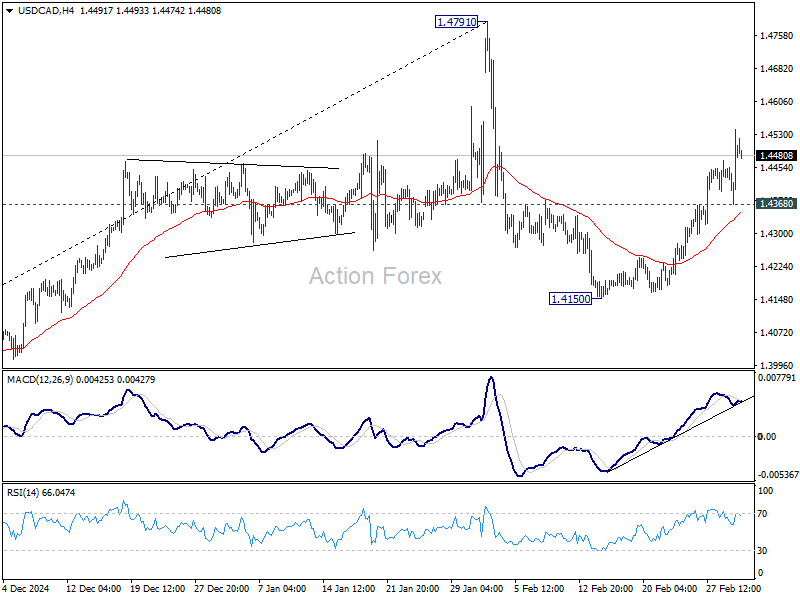
Daily Pivots: (S1) 1.4387; (P) 1.4465; (R1) 1.4559; More...
USD/CAD's rise from 1.4150 continues today and intraday bias stays on the upside. Further rally should be seen to retest 1.4791 high. Strong resistance might be seen there to limit upside on first attempt. But decisive break there will confirm resumption of larger up trend. On the downside, below 1.4368 minor support will turn intraday bias neutral again first.
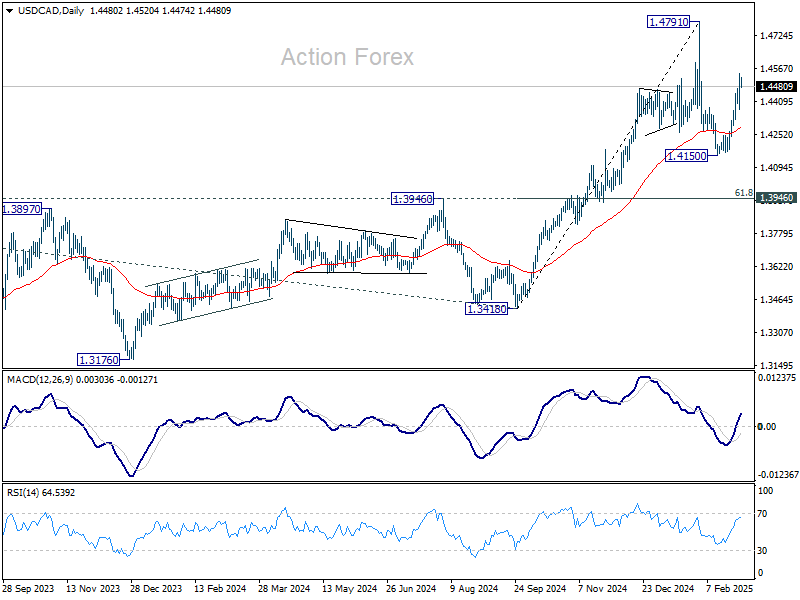
In the bigger picture, long term up trend is tentatively seen as resuming with prior breach of 1.4667/89 key resistance zone (2020/2015 highs). Next target is 100% projection of 1.2401 to 1.3976 from 1.3418 at 1.4993. This will remain the favored case as long as 1.3976 resistance turned support holds (2022 high), even in case of deep pullback.
AUD/USD Daily Report
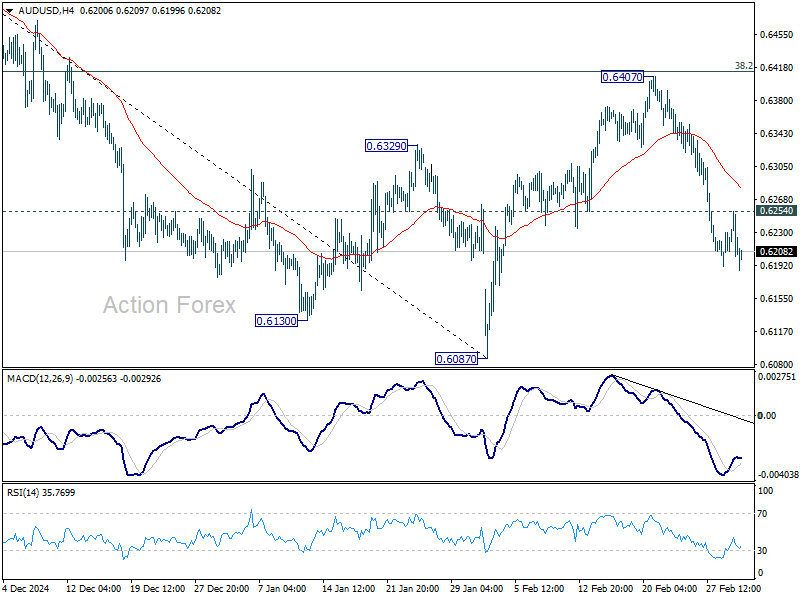
Daily Pivots: (S1) 0.6200; (P) 0.6228; (R1) 0.6251; More...
Intraday bias in AUD/USD remain son the downside with 0.6254 minor resistance intact. Corrective rebound from 0.6087 should have completed at 0.6407, ahead of 38.2% retracement of 0.6941 to 0.6087 at 0.6413. Deeper fall should be seen for retesting 0.6087 low. Firm break there will resume whole decline from 0.6941. On the upside, above 0.6254 minor resistance will turn bias to the upside for stronger recovery.
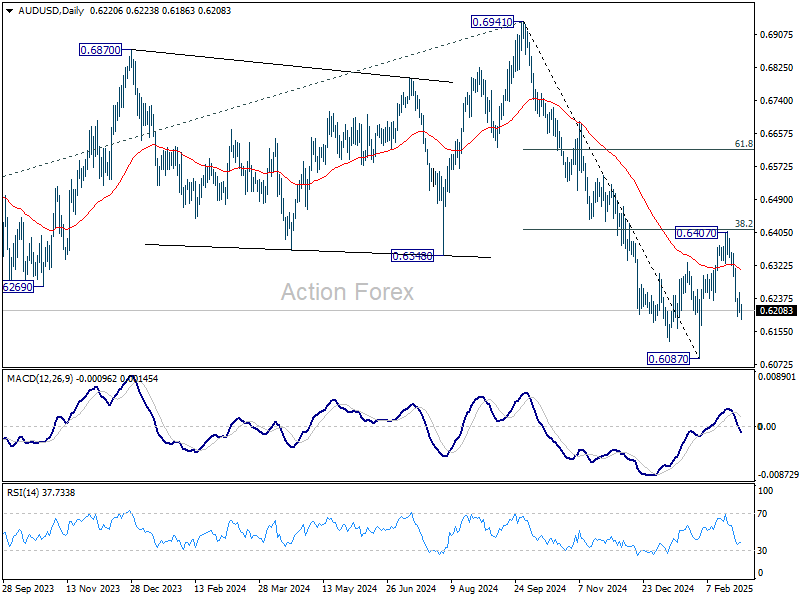
In the bigger picture, fall from 0.6941 (2024 high) is seen as part of the down trend from 0.8006 (2021 high). Next medium term target is 61.8% projection of 0.8006 to 0.6169 from 0.6941 at 0.5806. In any case, outlook will stay bearish as long as 55 W EMA (now at 0.6494) holds.
EUR/USD Daily Outlook
Daily Pivots: (S1) 1.0417; (P) 1.0461; (R1) 1.0532; More...
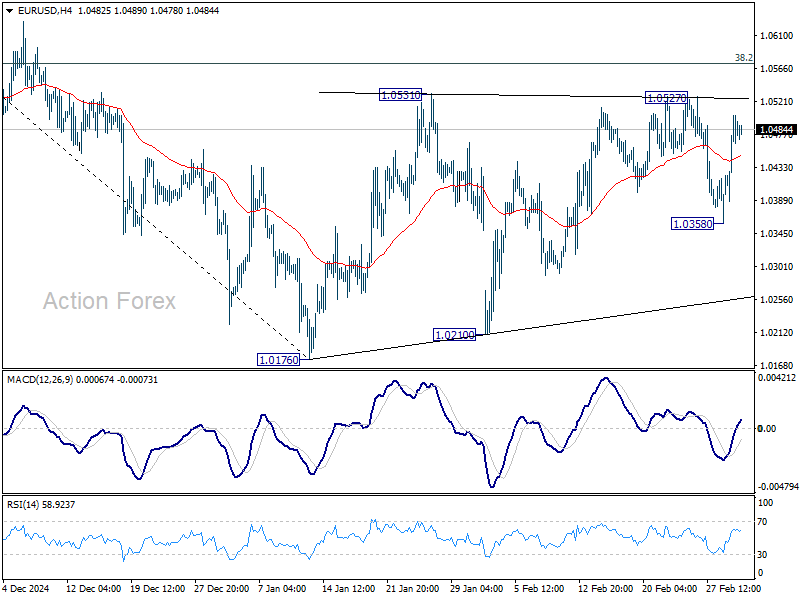
Intraday bias in EUR/USD stays neutral, and outlook remains bearish as long as 38.2% retracement of 1.1213 to 1.0176 at 1.0572 holds. Below 1.0358 will target 1.0176/0210 support zone first. Firm break there will resume whole fall from 1.1213, and carry larger bearish implications. However, sustained trading above 1.0572 will pave the way to 61.8% retracement at 1.0817.
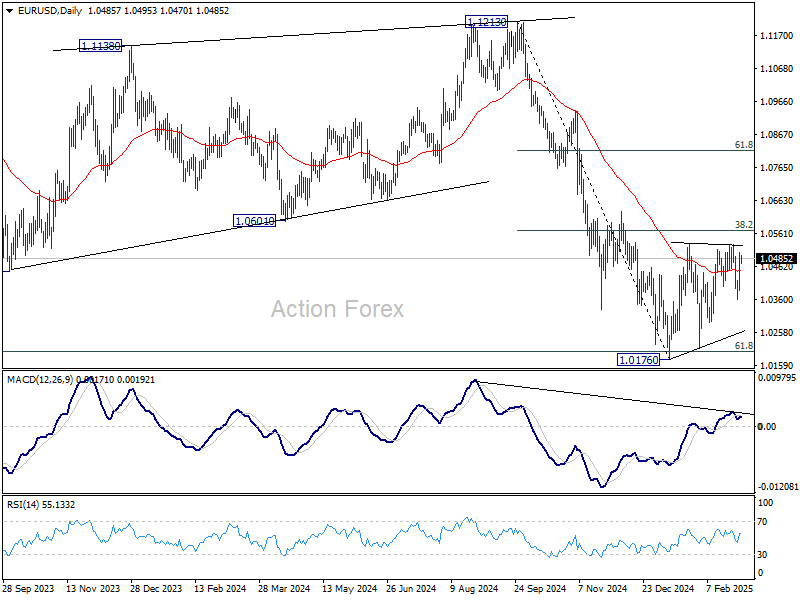
In the bigger picture, immediate focus is on 61.8 retracement of 0.9534 (2022 low) to 1.1274 (2024 high) at 1.0199. Sustained break there will solidify the case of medium term bearish trend reversal, and pave the way back to 0.9534. However, reversal from 1.0199 will argue that price actions from 1.1274 are merely a corrective pattern, and has already completed.
GBP/USD Daily Outlook
Daily Pivots: (S1) 1.2614; (P) 1.2669; (R1) 1.2757; More...
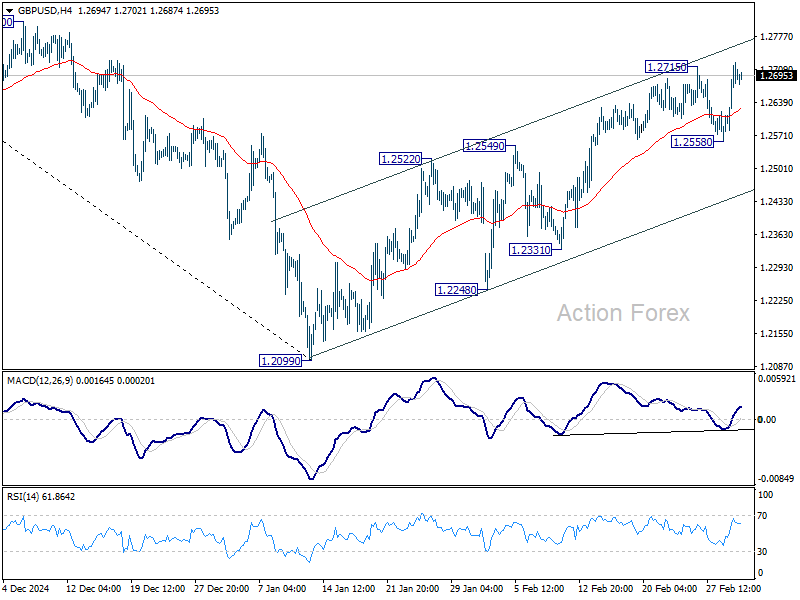
Intraday bias in GBP/USD is back on the upside with breach of 1.2715. Rise from 1.2099 is resuming for 1.2810 resistance. Firm break there will target 61.8% retracement of 1.3433 to 1.2099 at 1.2923. On the downside, break of 1.2558 will turn bias back to the downside for near term rising channel support (now at 1.2453).
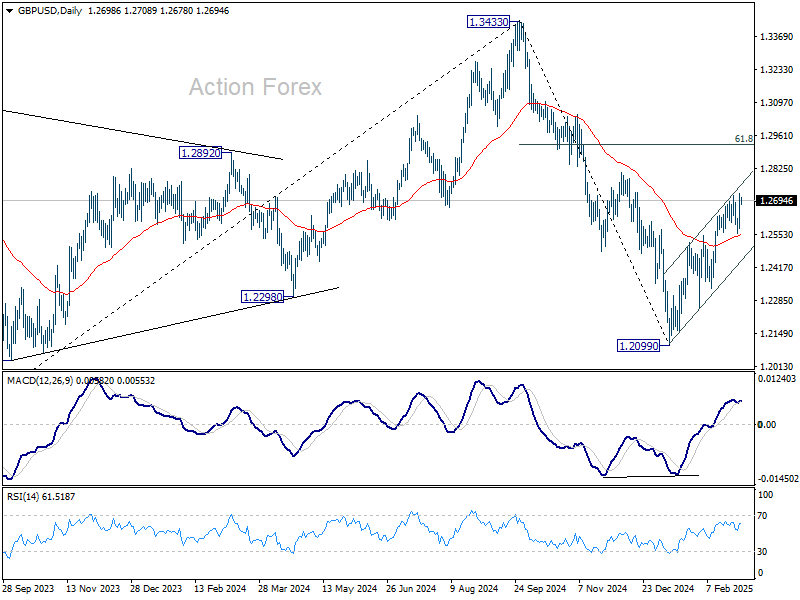
In the bigger picture, rise from 1.0351 (2022 low) should have already completed at 1.3433 (2024 high), and the trend has reversed. Further fall is now expected as long as 1.2810 resistance holds. Deeper decline should be seen to 61.8% retracement of 1.0351 to 1.3433 at 1.1528, even as a corrective move. However, firm break of 1.2810 will dampen this bearish view and bring retest of 1.3433 high instead.
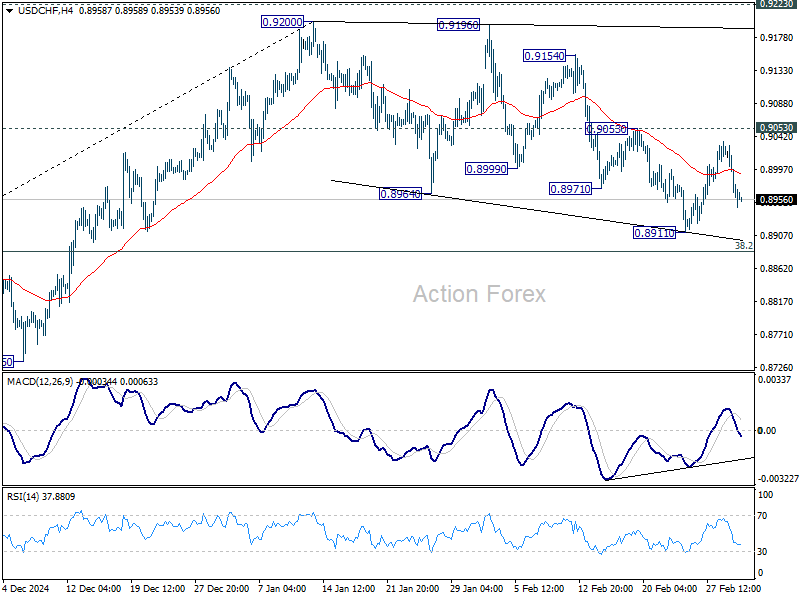
USD/CHF Daily Outlook
Daily Pivots: (S1) 0.8941; (P) 0.8987; (R1) 0.9013; More…
Intraday bias in USD/CHF remains neutral and outlook is unchanged. On the upside, firm break of 0.9053 resistance will suggest that corrective pattern from 0.9200 has already completed at 0.8911. Further rally should then be seen to retest 0.9200 resistance. In case of another fall, downside should be contained by 38.2% retracement of 0.8374 to 0.9200 at 0.8884 to bring rebound.
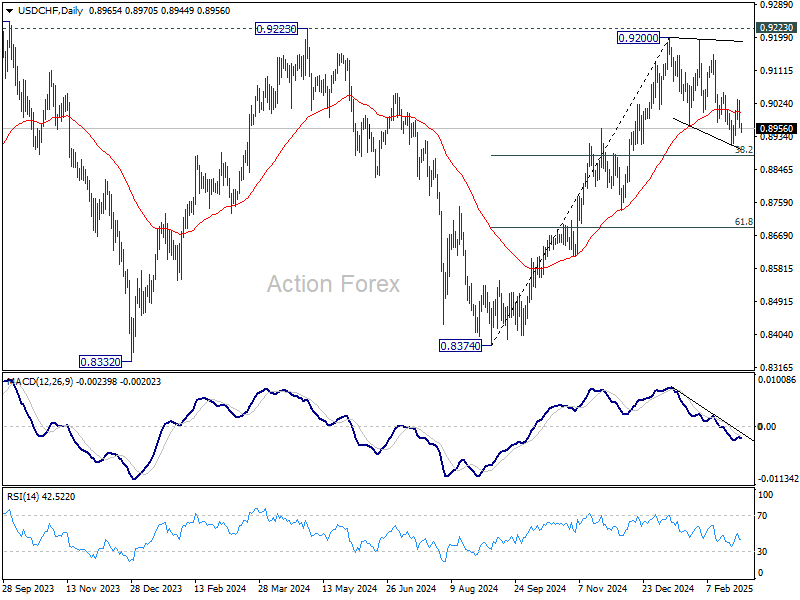
In the bigger picture, decisive break of 0.9223 resistance will argue that whole down trend from 1.0342 (2017 high) has completed with three waves down to 0.8332 (2023 low). Outlook will be turned bullish for 1.0146 resistance next. Nevertheless, rejection by 0.9223 will retain medium term bearishness for another decline through 0.8332 at a later stage.
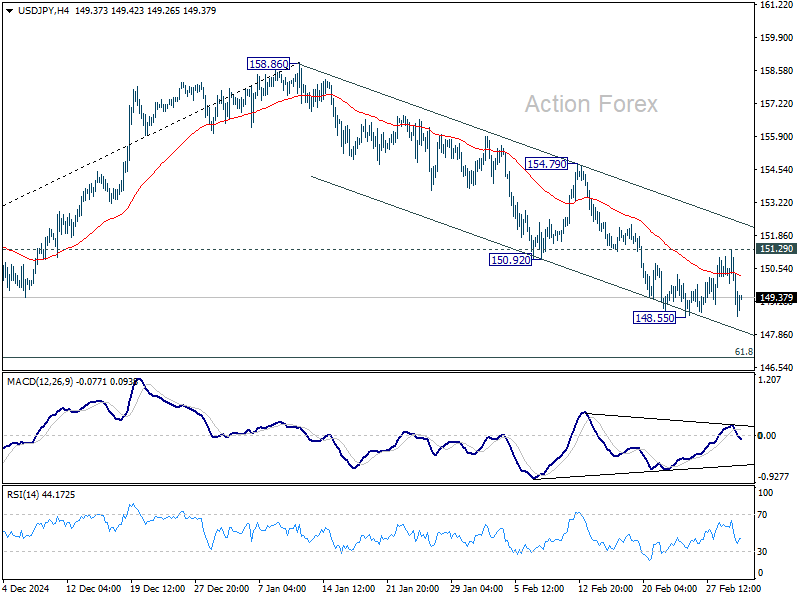
USD/JPY Daily Outlook
Daily Pivots: (S1) 148.63; (P) 149.97; (R1) 150.83; More...
Intraday bias in USD/JPY is turned neutral again as it quickly reversed after recovering to 151.29. Overall outlook is unchanged that the decline from 158.86 is seen as the third leg of the corrective pattern from 161.94 high. On the downside, below 148.55 will resume the fall and target 61.8% retracement of 139.57 to 158.86 at 146.32 next. On the upside, break of 151.29 will delay the bearish case, and bring more consolidations.
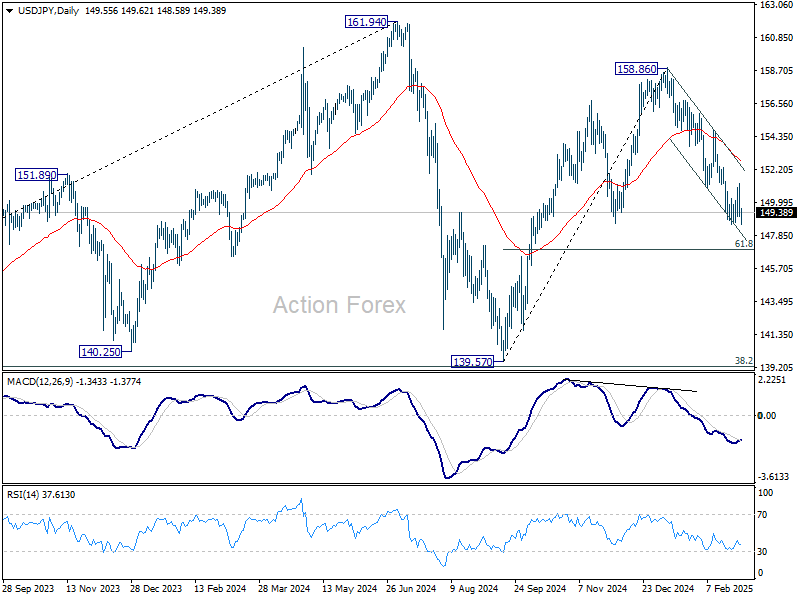
In the bigger picture, price actions from 161.94 are seen as a corrective pattern to rise from 102.58 (2021 low). In case of another fall, strong support should be seen from 38.2% retracement of 102.58 to 161.94 at 139.26 to bring rebound. However, sustained break of 139.26 would open up deeper medium term decline to 61.8% retracement at 125.25.
Yen Strengthens as Trade War 2.0 Formally Begins, Lifted Further by Trump’s Currency Warning
The latest round of US tariffs on Canada, Mexico, and China officially took effect today, marking the formal start of what many are calling "Trade War 2.0" under US President Donald Trump. Markets had been bracing for impact, and the steep selloff in US stocks overnight confirmed that investors are deeply concerned about the economic fallout. Treasury yields also tumbled, reflecting strong safe-haven flows as traders rushed into bonds amid rising uncertainty.
Despite the sharp risk-off move in the US, the reaction in Asian markets has been uneven. Japan's Nikkei is the only major index experiencing a significant selloff, while other regional markets remain relatively calm. This suggests that investors are still assessing the broader implications of the tariffs before making further adjustments to their positions.
In the currency markets, Yen is currently the strongest performer for the day, benefiting from both risk aversion and falling yields in the US and Europe. Yen's is facing additional upward pressure Trump directly accused Japan of currency manipulation. The US President stated that he had personally called Japanese leader to warn them against devaluing Yen, adding that if such actions continued, tariffs could be the next step to level the playing field for American manufacturers.
Japan wasted no time in responding, with Finance Minister Katsunobu Kato firmly rejecting the accusations. "We are not adopting a policy to weaken the Japanese currency. If you recall our foreign exchange market interventions in recent years, you can understand what I mean," Kato stated in a press conference. This exchange sets the stage for further tensions between Washington and Tokyo, as Japan seeks to defend its monetary policy while avoiding trade tensions with the US.
Elsewhere in the forex markets, the Australian Dollar is the worst performer of the day at this point. While RBA's minutes confirmed that there is no commitment to further rate cuts following last month’s policy reduction, Aussie has been dragged lower by broad risk aversion. Kiwi followed closely behind, and then Loonie.
On the other hand, the Swiss Franc is benefiting from the risk-off sentiment, positioning itself as the second-strongest currency after Yen. Dollar remains resilient, supported by safe-haven demand despite falling treasury yields. Meanwhile, the Euro and Sterling are mixed, still partially bolstered by optimism surrounding the European-led "Coalition of the Willing" and the region’s commitment to increased defense spending.
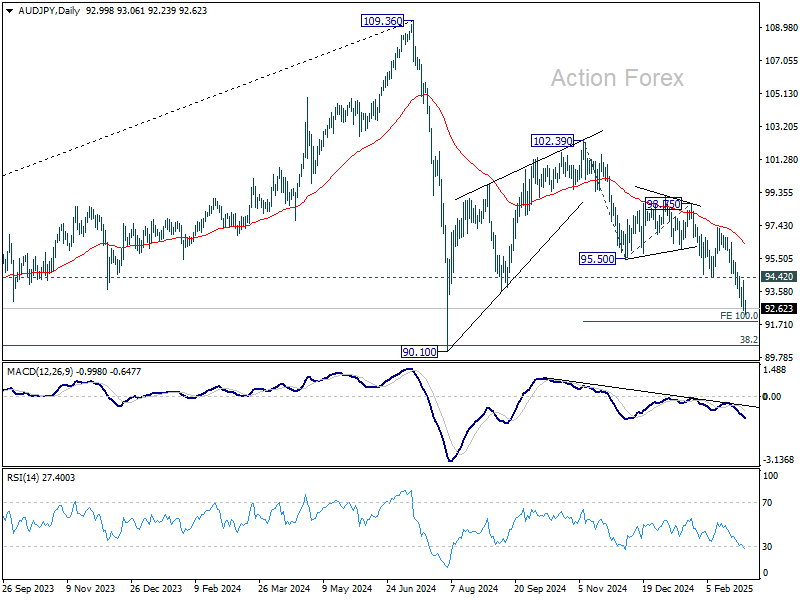
Technically, AUD/JPY's decline from 120.39 is in progress for 100% projection of 102.39 to 95.50 from 98.75 at 91.86, Such decline is currently seen as the second leg of the corrective pattern from 90.10 (2024 low). Hence, momentum should start to diminish below 91.86 while downside should be contained by 90.10 to bring reversal. Break of 94.42 support resistance will be the first sign of short term bottoming. However, sustained break of 90.10 will suggest that fall from 102.39 is indeed resuming the whole down trend from 109.36 (2024 high) as the third leg.
In Asia, at the time of writing, Nikkei is down -1.26%. Hong Kong HSI is down -0.26%. China Shanghai SSE is up 0.15%. Singapore Strait Times is down -0.33%. Japan 10-year JGB yield is up 0.010 at 1.419. Overnight, DOW fell -1.48%. S&P 500 fell -1.76%. NASDAQ fell -2.64%. 10-year yield fell -0.051 to 4.180.
S&P 500 sinks as US tariffs on Canada, Mexico, and China set to begin
US equities tumbled sharply on Monday, kicking off March with the biggest single-day decline in months, and the markets were rattled by the formal commencement of a US-led trade war.
The selloff started in the afternoon after US President Donald Trump reaffirmed that 25% tariffs on imports from Mexico and Canada would go into effect as scheduled on Tuesday. Hopes for a last-minute deal to avert the full imposition of tariffs were dashed. The Federal Register confirmed that the new duties would be officially imposed at 05:01 GMT.
Similarly, the additional 10% duty on Chinese goods was also slated to take effect at the same time, effectively raising the total tariff on thousands of Chinese products to 20%.
In quick response, Canada announced retaliatory measures, with Prime Minister Justin Trudeau confirming that CAD 155B worth of US goods would be hit with 25% tariffs if Trump's levies proceed as planned. China will impose an additional 15% tariff on US imports of chicken, wheat, corn, and cotton. Additionally, a 10% tariff will be applied to sorghum, soybeans, pork, beef, seafood, fruits, vegetables, and dairy. These measures are set to take effect on March 10.
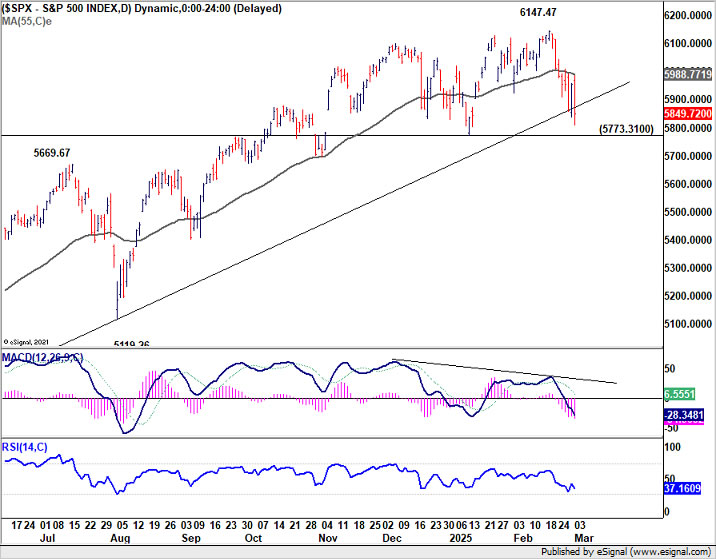
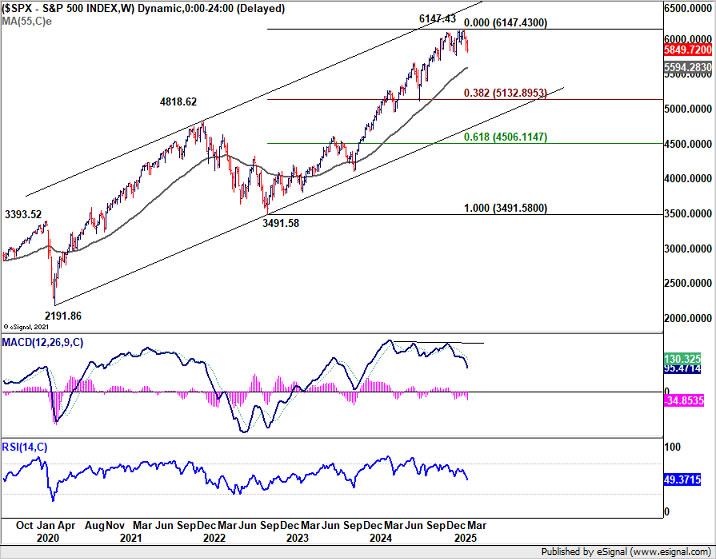
Technically, S&P 500's rejection by 55 D EMA (now at 5988.77) is a near term bearish sign. Immediate focus is on 5773.31 support this week. Considering bearish divergence condition in D MACD, firm break of 5773.31 should confirm medium term topping that 6147.47. That would set up deeper correction to 55 W EMA (now at 5594.28) at least.
RBA minutes: No commitment to further rate cuts
The minutes from RBA’s February meeting reinforced the central bank’s cautious approach to monetary easing, making it clear that the recent 25bps rate cut to 4.10% does "not commit them to further reductions" in subsequent meetings.
Policymakers acknowledged that inflation has been falling at a “somewhat faster pace than expected,” which helped ease concerns over upside risks. However, they stressed that the path to returning inflation to target while maintaining labor market gains is “not yet assured.” The Board ultimately deemed that the stronger case was to ease policy, given the downside risks to the economy.
Despite the decision to cut, RBA members debated the risks of "easing policy too soon", recognizing that a premature policy shift could lead to resurgence in inflation.
They noted that if inflation proved “more persistent than expected,” holding the cash rate at 4.1% for an “extended period” or even tightening policy would be warranted.
Australia retail sales rises 0.3% mom, driving by food-related spending
Australia's retail sales turnover rose 0.3% mom to AUD 37.08B in January, matched expectations.
Robert Ewing, ABS head of business statistics, said: "While the pick-up in retail spending since mid-2024 has been boosted by more discretionary spending, this month’s rise is mostly driven by food-related spending."
USD/JPY Daily Outlook
Daily Pivots: (S1) 148.63; (P) 149.97; (R1) 150.83; More...
Intraday bias in USD/JPY is turned neutral again as it quickly reversed after recovering to 151.29. Overall outlook is unchanged that the decline from 158.86 is seen as the third leg of the corrective pattern from 161.94 high. On the downside, below 148.55 will resume the fall and target 61.8% retracement of 139.57 to 158.86 at 146.32 next. On the upside, break of 151.29 will delay the bearish case, and bring more consolidations.
In the bigger picture, price actions from 161.94 are seen as a corrective pattern to rise from 102.58 (2021 low). In case of another fall, strong support should be seen from 38.2% retracement of 102.58 to 161.94 at 139.26 to bring rebound. However, sustained break of 139.26 would open up deeper medium term decline to 61.8% retracement at 125.25.
S&P 500 sinks as US tariffs on Canada, Mexico, and China set to begin
US equities tumbled sharply on Monday, kicking off March with the biggest single-day decline in months, and the markets were rattled by the formal commencement of a US-led trade war.
The selloff started in the afternoon after US President Donald Trump reaffirmed that 25% tariffs on imports from Mexico and Canada would go into effect as scheduled on Tuesday. Hopes for a last-minute deal to avert the full imposition of tariffs were dashed. The Federal Register confirmed that the new duties would be officially imposed at 05:01 GMT.
Similarly, the additional 10% duty on Chinese goods was also slated to take effect at the same time, effectively raising the total tariff on thousands of Chinese products to 20%.
In quick response, Canada announced retaliatory measures, with Prime Minister Justin Trudeau confirming that CAD 155B worth of US goods would be hit with 25% tariffs if Trump's levies proceed as planned. China’s commerce ministry also vowed countermeasures, calling the US tariffs "unreasonable and groundless, harmful to others."
Technically, S&P 500's rejection by 55 D EMA (now at 5988.77) is a near term bearish sign. Immediate focus is on 5773.31 support this week. Considering bearish divergence condition in D MACD, firm break of 5773.31 should confirm medium term topping that 6147.47. That would set up deeper correction to 55 W EMA (now at 5594.28) at least.
Australia retail sales rises 0.3% mom, driving by food-related spending
Australia's retail sales turnover rose 0.3% mom to AUD 37.08B in January, matched expectations.
Robert Ewing, ABS head of business statistics, said: "While the pick-up in retail spending since mid-2024 has been boosted by more discretionary spending, this month’s rise is mostly driven by food-related spending."

RBA minutes: No commitment to further rate cuts
The minutes from RBA’s February meeting reinforced the central bank’s cautious approach to monetary easing, making it clear that the recent 25bps rate cut to 4.10% does "not commit them to further reductions" in subsequent meetings.
Policymakers acknowledged that inflation has been falling at a “somewhat faster pace than expected,” which helped ease concerns over upside risks. However, they stressed that the path to returning inflation to target while maintaining labor market gains is “not yet assured.” The Board ultimately deemed that the stronger case was to ease policy, given the downside risks to the economy.
Despite the decision to cut, RBA members debated the risks of "easing policy too soon", recognizing that a premature policy shift could lead to resurgence in inflation.
They noted that if inflation proved “more persistent than expected,” holding the cash rate at 4.1% for an “extended period” or even tightening policy would be warranted.