
Sample Category Title
Nikkei 225 Outlook: Negative Sentiment Overshadows Positive Fundamentals
- Nikkei 225 broke below its 200-day moving average and a four-month range configuration.
- US President Trump’s trade war 2.0 against major trading partners triggered a negative feedback loop in Japanese equities due to potential disruption in semiconductor supply chains.
- Positive fundamentals in the Japanese economy are likely to support the major uptrend phase of the Nikkei 225.
- In the medium-term, negative sentiment may take a foothold in the Nikkei 225 with a risk of further corrective decline below 38,520 key medium-term resistance.
Last week, the Japanese benchmark stock index, Nikkei 225, broke below its four-month range support of 37,810 and recorded a weekly loss of 4.2%, its worst performance since early September 2024.
The recent dismal performance of Japanese equities has been driven by negative sentiment towards US President Trump’s upcoming tariffs threat to impose 25% duties on Canadian and Mexican goods as well as an extra 10% levy on Chinese imports with effect from Tuesday, 4 March.
Fundamentals are still on a firm footing
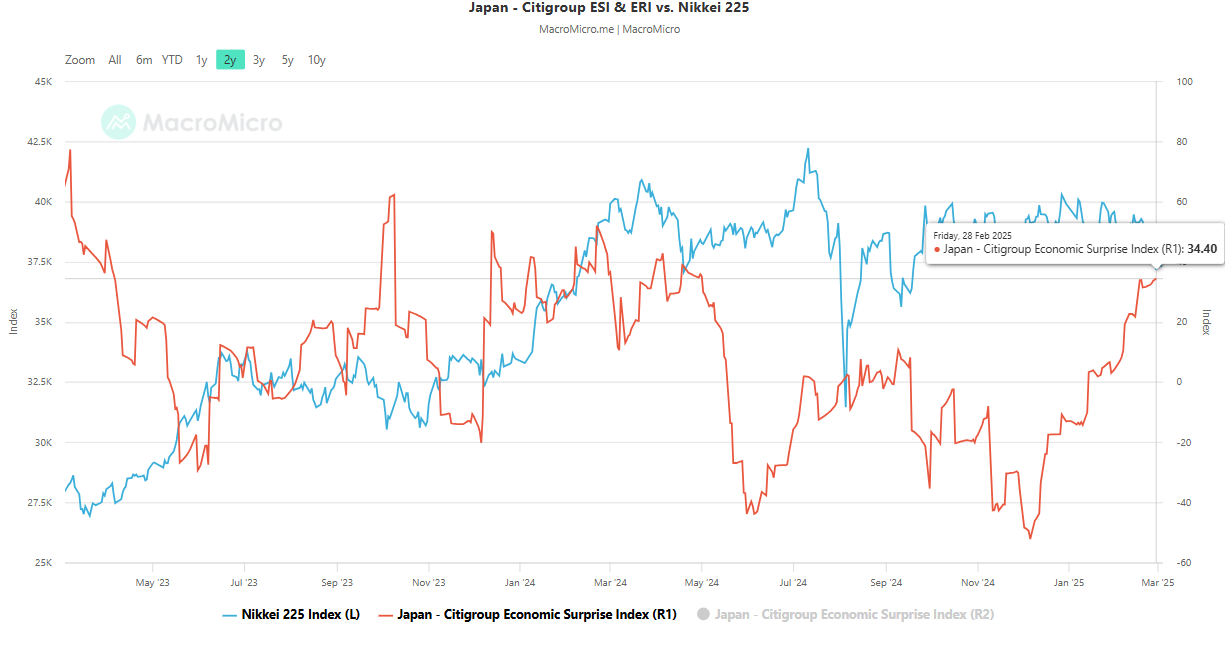
Fig 1: Citigroup Japan Economic Surprise Index as of 28 Feb 2025 (Source: MacroMicro, click to enlarge chart)
In contrast, several key leading economic indicators of the Japanese economy have exceeded expectations in December and January, such as wage growth, services PMI, inflation trend, and household spending.
The Citigroup Japan Economic Surprise Index can be used as a leading gauge to track the improvements of key economic data, which is the sum of the difference between the actual value of various data and their consensus forecast. If the index value is more than zero, it suggests that the overall economic condition in Japan is generally better than expected, and vice versa when the Index value falls below zero.
The Citigroup Japan Economic Surprise Index has trended upward steadily in the past two months since hitting a trough on 6 December 2024, with a value of -52.20 to 34.40 as of 28 February, its highest level in ten months. The upward trend represents an improvement in economic growth in Japan (see Fig 1).
An increase in buying interest from institutional and retail investors
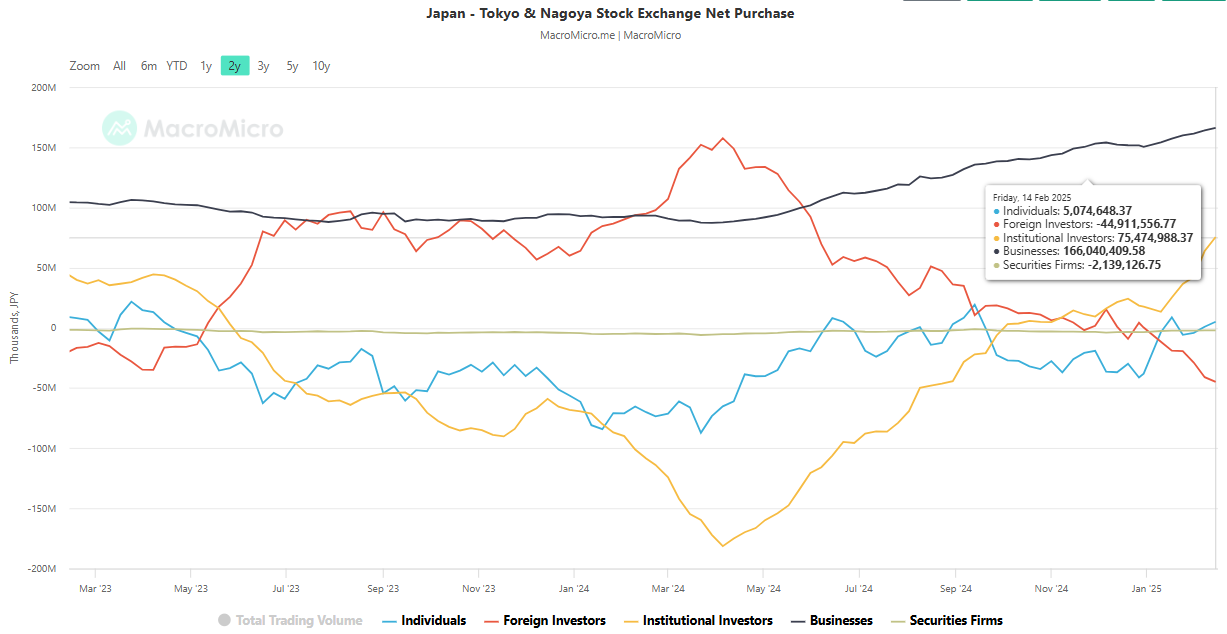
Fig 2: 52-week average net purchases of Japanese equities from various types of market participants as of 14 Feb 2025 (Source: MacroMicro, click to enlarge chart)
Based on data from the Tokyo and Nagoya stock exchanges, the 52-week average of net purchases of Japanese stocks from foreign investors has fallen significantly since early December 2024 to a net sold amount of -44,911,557 as of 14 February (see Fig 2).
On the flip side, the decrease in net purchases from foreign investors is offset by an increase in net purchases from institutional investors (from 16,088,440 to 75,474,988) and retail/individual investors (from -36,338,830 to 5,074,648).
Negative sentiment is taking centre stage in Nikkei 225
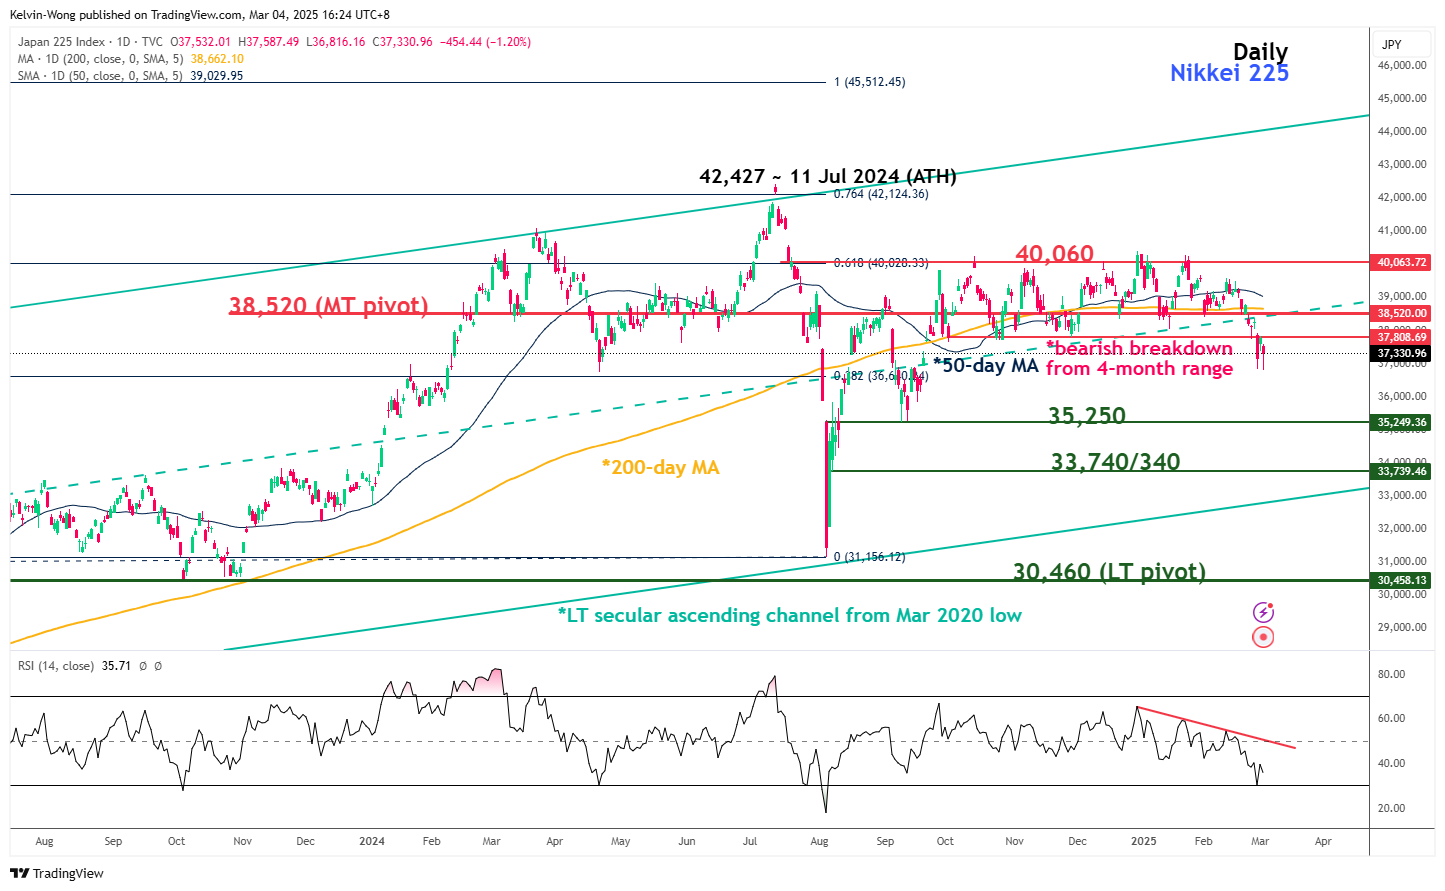
Fig 3: Nikkei 225 medium-term & major trends as of 4 Mar 2025 (Source: MacroMicro, click to enlarge chart)
The price actions of the Nikkei 225 are not moving in a similar positive trend of the improved fundamentals of the Japanese economy but instead moving in tandem with sentiment factors that have turned bearish since last Tuesday, 25 February.
The Nikkei 225 has broken below its 200-day moving average, now acting as key medium-term pivotal resistance at 38,520. In addition, the condition of the daily RSI momentum indicator remains bearish as it has not hit its oversold level (see Fig 3).
In the lens of the technical analysis, the Nikkei 225 has staged a medium-term bearish breakdown from a prior four-month range configuration that was in place since late September 2024.
Further potential weakness may be in store to expose the next medium-term supports at 35,250 and 33,740/340 (also the lower boundary of the long-term secular ascending channel from March 2020 low).
However, a clearance above 38,520 invalidates the bearish scenario for a retest at the 40,060 medium-term range resistance.
GBP/JPY Daily Outlook
Daily Pivots: (S1) 188.49; (P) 190.23; (R1) 191.65; More...
Range trading continues in GBP/JPY and intraday bias stays neutral. Further decline is in favor as long as 193.04 resistance holds. On the downside, firm break of 187.04 will extend the fall from 199.79 towards 180.00 support. That will also raise the chance that correction from 208.09 is resuming downward.
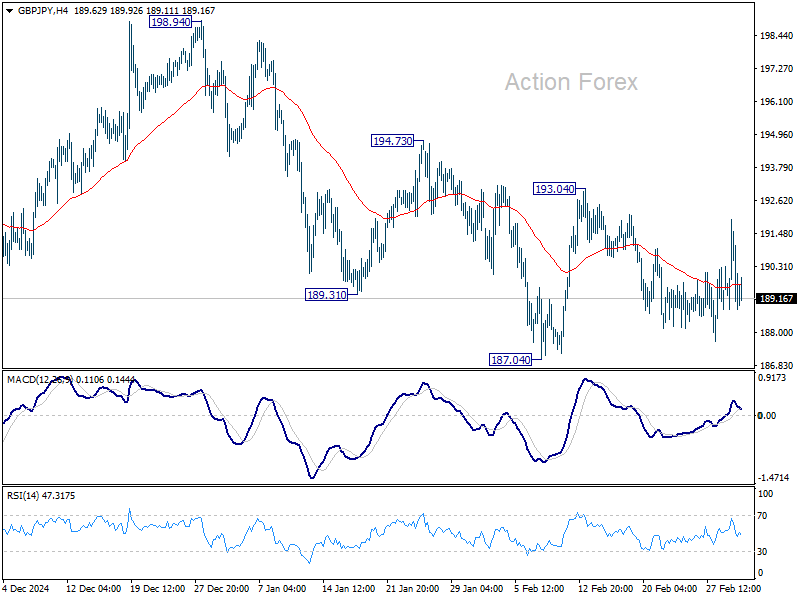
In the bigger picture, price actions from 208.09 are seen as a correction to rally from 123.94 (2020 low). Strong support should be seen from 38.2% retracement of 123.94 to 208.09 at 175.94 to contain downside. However, sustained break of 152.11 will bring deeper fall even still as a correction.

EUR/JPY Daily Outlook
Daily Pivots: (S1) 155.66; (P) 157.07; (R1) 158.21; More...
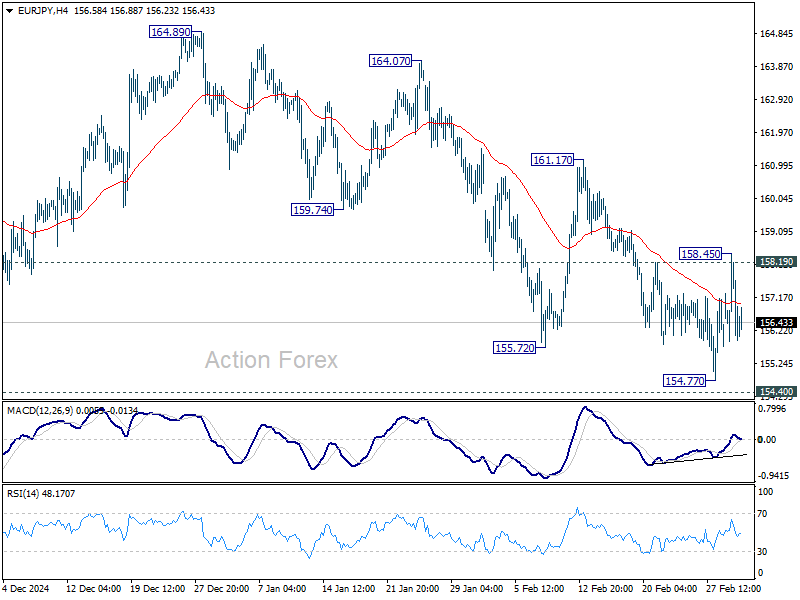
EUR/JPY reversed after recovery to 158.45 and intraday bias is turned neutral again. On the downside, firm break of 154.40/77 support zone will resume larger fall from 174.51. On the upside, above 158.45 will target 55 D EMA (now at 159.55). Sustained break there will argue that corrective pattern from 154.40 has started another rising leg, and target 161.17 resistance and above.
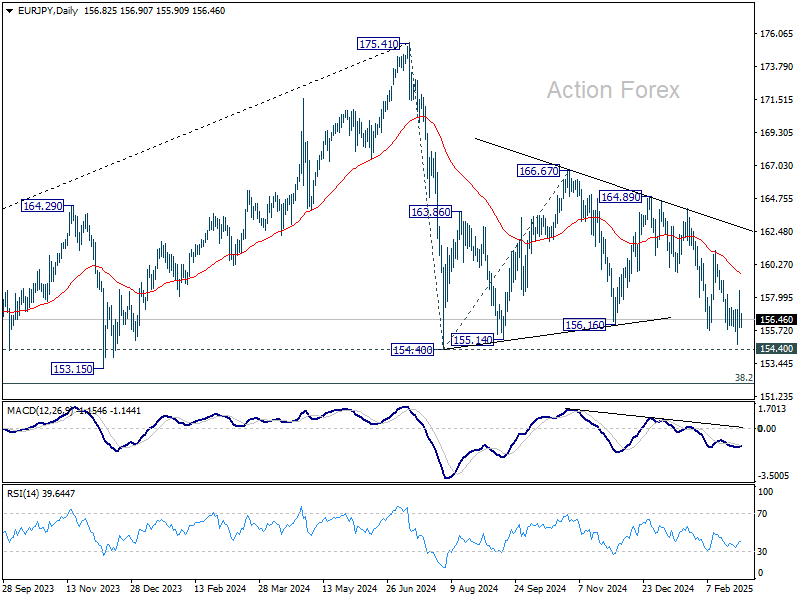
In the bigger picture, price actions from 175.41 are seen as correction to rally from 114.42 (2020 low). Strong support should be seen from 38.2% retracement of 114.42 to 175.41 at 152.11 to contain downside. However, sustained break of 152.11 will bring deeper fall even still as a correction. Next target will be 100% projection of 175.41 to 154.40 from 166.67 at 145.66.
EUR/GBP Daily Outlook
Daily Pivots: (S1) 0.8248; (P) 0.8258; (R1) 0.8268; More...
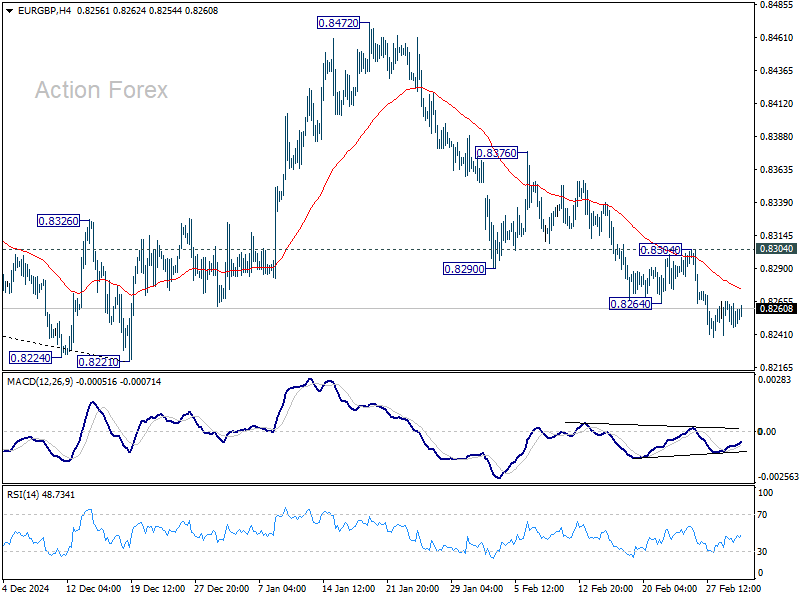
No change in EUR/GBP's outlook and further decline is expected with 0.8304 resistance intact. Fall from 0.8472 would target a test on 0.8201/21 key support zone. Decisive break there will carry larger bearish implications. Nevertheless, firm break of 0.8304 will indicate short term bottoming, and turn bias back to the upside for stronger rebound.
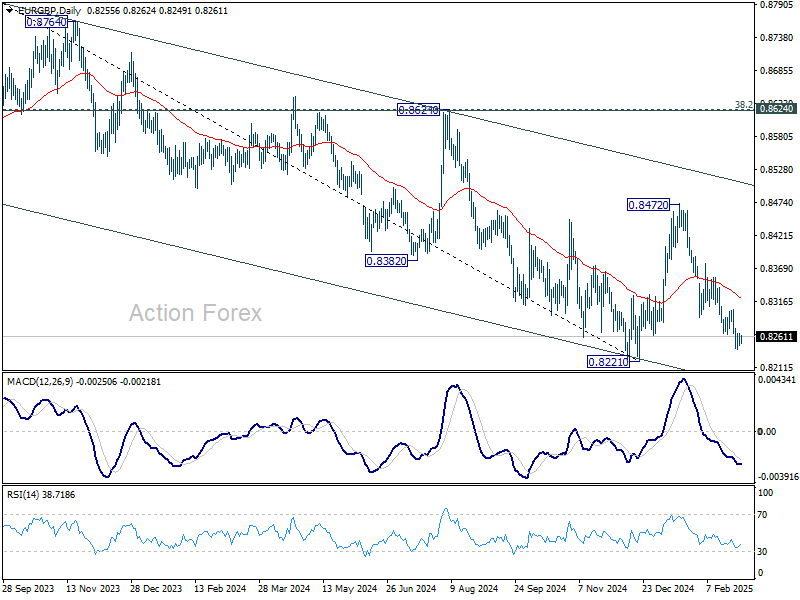
In the bigger picture, the medium term down trend remains intact with EUR/GBP staying well inside the falling channel. Prior rejection by 55 W EMA (now at 0.8414) also affirm bearishness. Decisive break of 0.8201/8221 support zone will resume whole down trend from 0.9449 (2020 high) and carry larger bearish implications.
EUR/AUD Daily Outlook
Daily Pivots: (S1) 1.6750; (P) 1.6816; (R1) 1.6913; More...
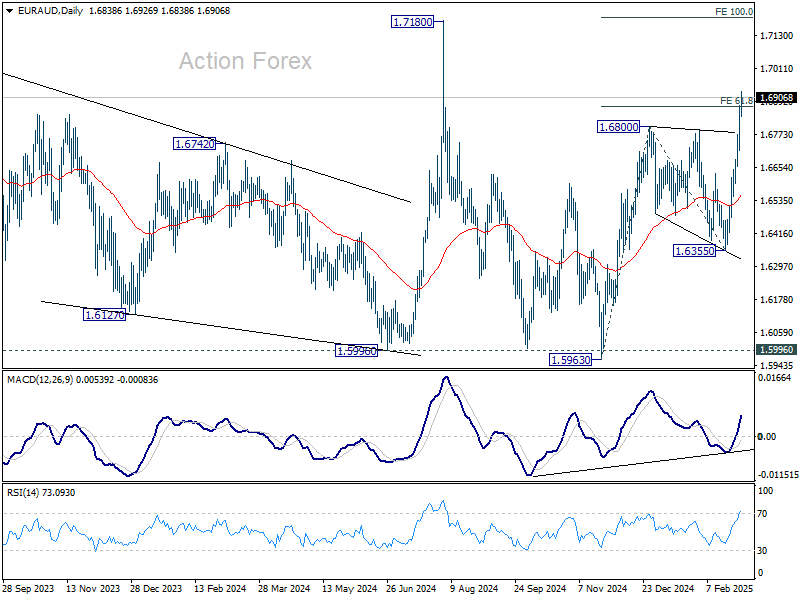
EUR/AUD's rally from 1.5963 continues today and intraday bias stays on the upside. Sustained trading above 61.8% projection of 1.5963 to 1.6800 from 1.6355 at 1.6872 could prompt upside acceleration to 100% projection at 1.7192, which is close to 1.7180 high. On the downside, below 1.6771 minor support will turn intraday bias neutral and bring consolidations, before staging another rally.
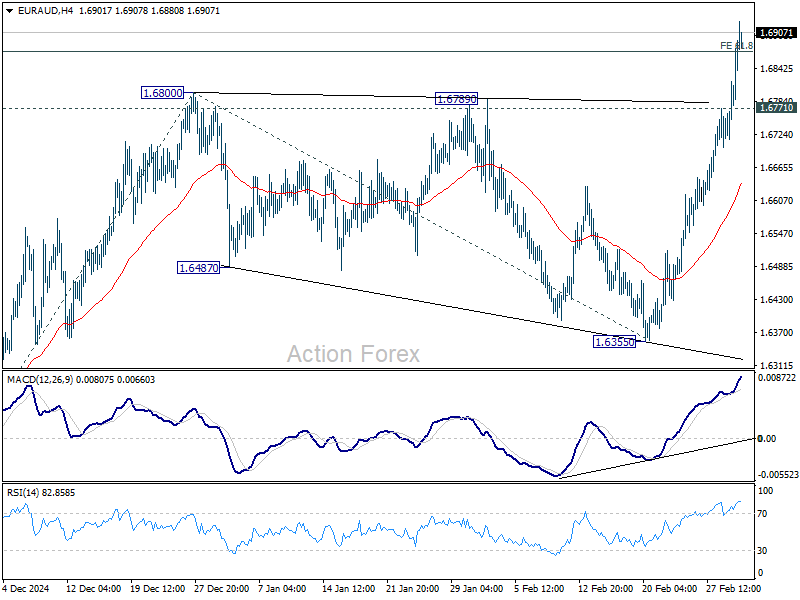
In the bigger picture, with 1.5996 key support (2024 low) intact, larger up trend from 1.4281 (2022 low) is still in favor to resume through 1.7180 at a later stage. Nevertheless, sustained break of 1.5996 will indicate that such up trend has completed and deeper decline would be seen.
EUR/CHF Daily Outlook
Daily Pivots: (S1) 0.9369; (P) 0.9403; (R1) 0.9439; More....
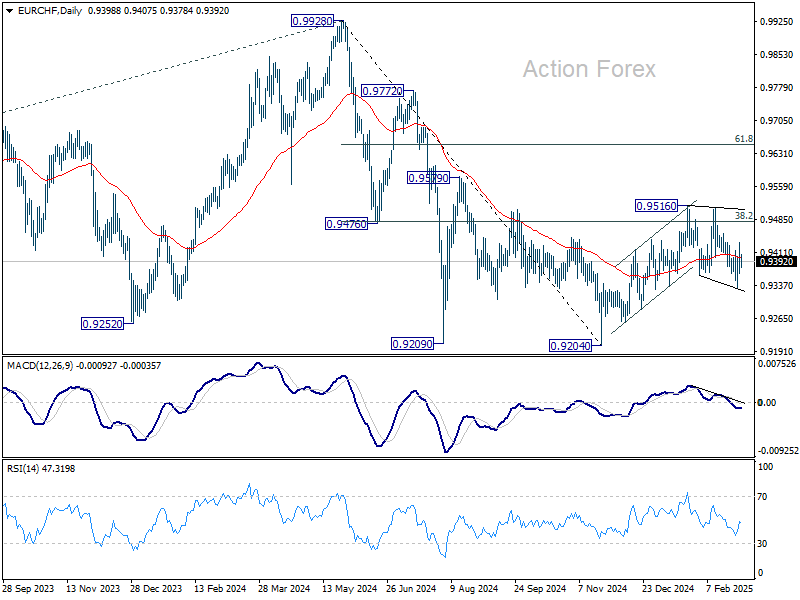
Intraday bias in EUR/CHF stays neutral at this point. On the upside, firm break of 0.95167 will resume the rebound from 0.9204 and next fibonacci level at 0.9651. Nevertheless, break of 0.9331 will resume the fall from 0.9516 to retest 0.9204 low.
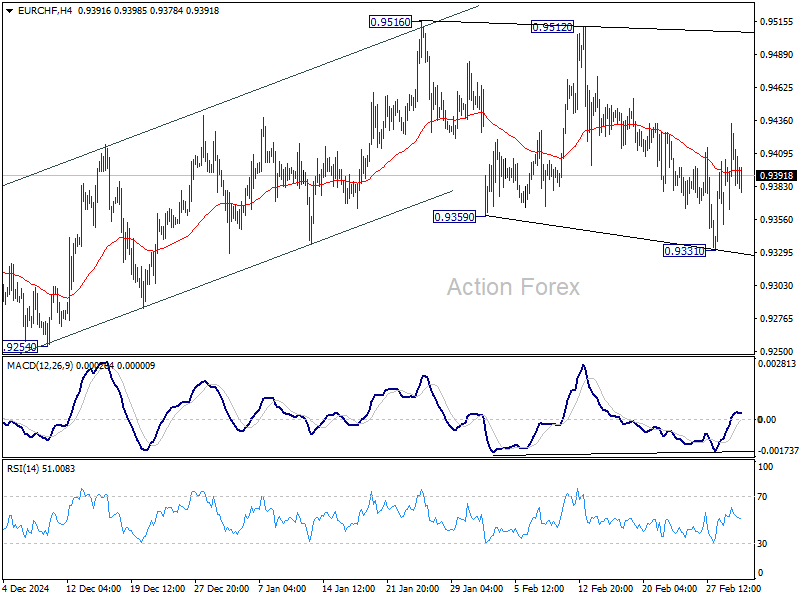
In the bigger picture, sustained trading above 38.2% retracement of 0.9928 to 0.9204 at 0.9481 should confirm that whole fall from 0.9928 (2024 high) has completed at 0.9204. Further rally should then be seen back to 61.8% retracement at 0.9651 and above. However, another rejection by 0.9481 will keep outlook bearish for extending larger down trend through 0.9204 at a later stage.
Trump’s First Address Before US Congress a Risky Wildcard
Markets
Not often was the different trading direction between US and European assets that outspoken as yesterday. Key European stock markets closed more than 1% higher with the Dax (+2.64%) outperforming. Intraday gains were topped off by deteriorating risk sentiment in the US. First, a rebalancing away from US to Europe has been going on since the start of the year. Adding to that was the expectation of a fast-track EU (defense) spending drift. Sunday’s safety summit in London addressed the collapsed US-Ukraine deal with Europe in a hurry to deliver military and financial support. The matter became even more urgent after US President Trump overnight froze all military aid to Ukraine. EC von der Leyen will propose options for new common financing mechanisms at Thursday’s EU Council. On a spending side-track, the outgoing German parliament is still planning to boost spending (defense & infrastructure) before the first meeting of the new parliament (end of March) in order to sidestep any potential blocking minorities. Whisper numbers reach up to almost €1tn. A final supportive (European) risk element came from discussions on the future of European Automotive Industry with the EC allowing companies more flexibility on CO2 targets and aiming to strengthen the competitive position. Today, Europe has a similar strategic dialogue on the future of the steel industry. Europe unleashing fiscal spending at stealth pace triggered a sell-off in European bonds with the very long end of the curve obviously underperforming. German yields added 4.4 bps (2-yr) to 9.9 bps (30-yr). The front end rose as well as higher-than-expected European February inflation numbers strengthening the case of an April pause after the ECB delivers a 25 bps rate cut (to 2.5%) on Thursday, dropping the “restrictive” label attached to its current monetary policy stance.
It was the complete opposite for US assets. US Treasuries outperformed with US yields losing another 4 to 6 bps. The belly of the curve outperformed the wings. The new upleg started following the release of the manufacturing ISM. The modest headline decline (50.3 from 50.9) hid awful details. New orders and employment slipped into contraction territory with price gauges accelerating. The ISM added to stagflationary worries with Trump’s policy mix at risk of backfiring against the US economy. Overnight, 25% tariffs against Mexico and Canada went into effect with Chinese tariffs rising from 10% to 20%. China immediately retaliated by imposing tariffs as high as 15% on US goods (mainly food and agriculture), banning exports to some defense companies and opening a complaint against the US at the WTO. The Canadian government also announced a package of counter-tariffs (25% on CAD30bn of goods with another CAD125bn coming in three weeks). Key US stock markets lost 1.5% (Dow) to 2.65% (Nasdaq). EUR/USD rallied from 1.0371 to 1.0487, readying a new test of first resistance at 1.0533 (YtD high). Today’s eco calendar is thin with President Trump’s first address before US Congress a risky wildcard tonight. Overnight moves suggest that it still pays to err on the side of caution with European stock markets set to open weak and yields handing back part of yesterday’s gains.
News & Views
S&P Global Ratings expects global government borrowing to hit a record $12.3tn this year. This 3% rise in sovereign bond issuance would bring the global total debt stock to a record as well, $76.9tn or 70.2% of GDP. For the US, S&P anticipates long-term issuance to creep higher to $4.9tn amid “wide fiscal deficits [seen above 6% by 2026], high interest spending and substantial debt refinancing requirement”. Global head of sovereigns at S&P Sifon-Arevalo said the largest economies keep relying on fiscal policy to “deal with crisis after crisis”, adding that this was fine and sustainable when you had the low borrowing costs from before the pandemic. But the rise in debt-servicing costs presents a much bigger problem, he said.
Oil prices tumbled yesterday to their lowest level since early December. Brent slipped $2 to $71.6 per barrel after OPEC+ said in a website statement it will go ahead with plans to revive some of the halted production. The decision to restore 138k barrels a day from April on was delayed several times due to unfavourable market circumstances (ie. too low oil prices). It was expected they would do so again this time around. US President Trump repeatedly called on the oil producing cartel to bring output back to push prices, and as such inflation, lower. The April production hike will be the first in a series to gradually restore a total of 2.2mln barrels by 2026. OPEC+ said this may be paused or reversed “subject to market conditions”, though.
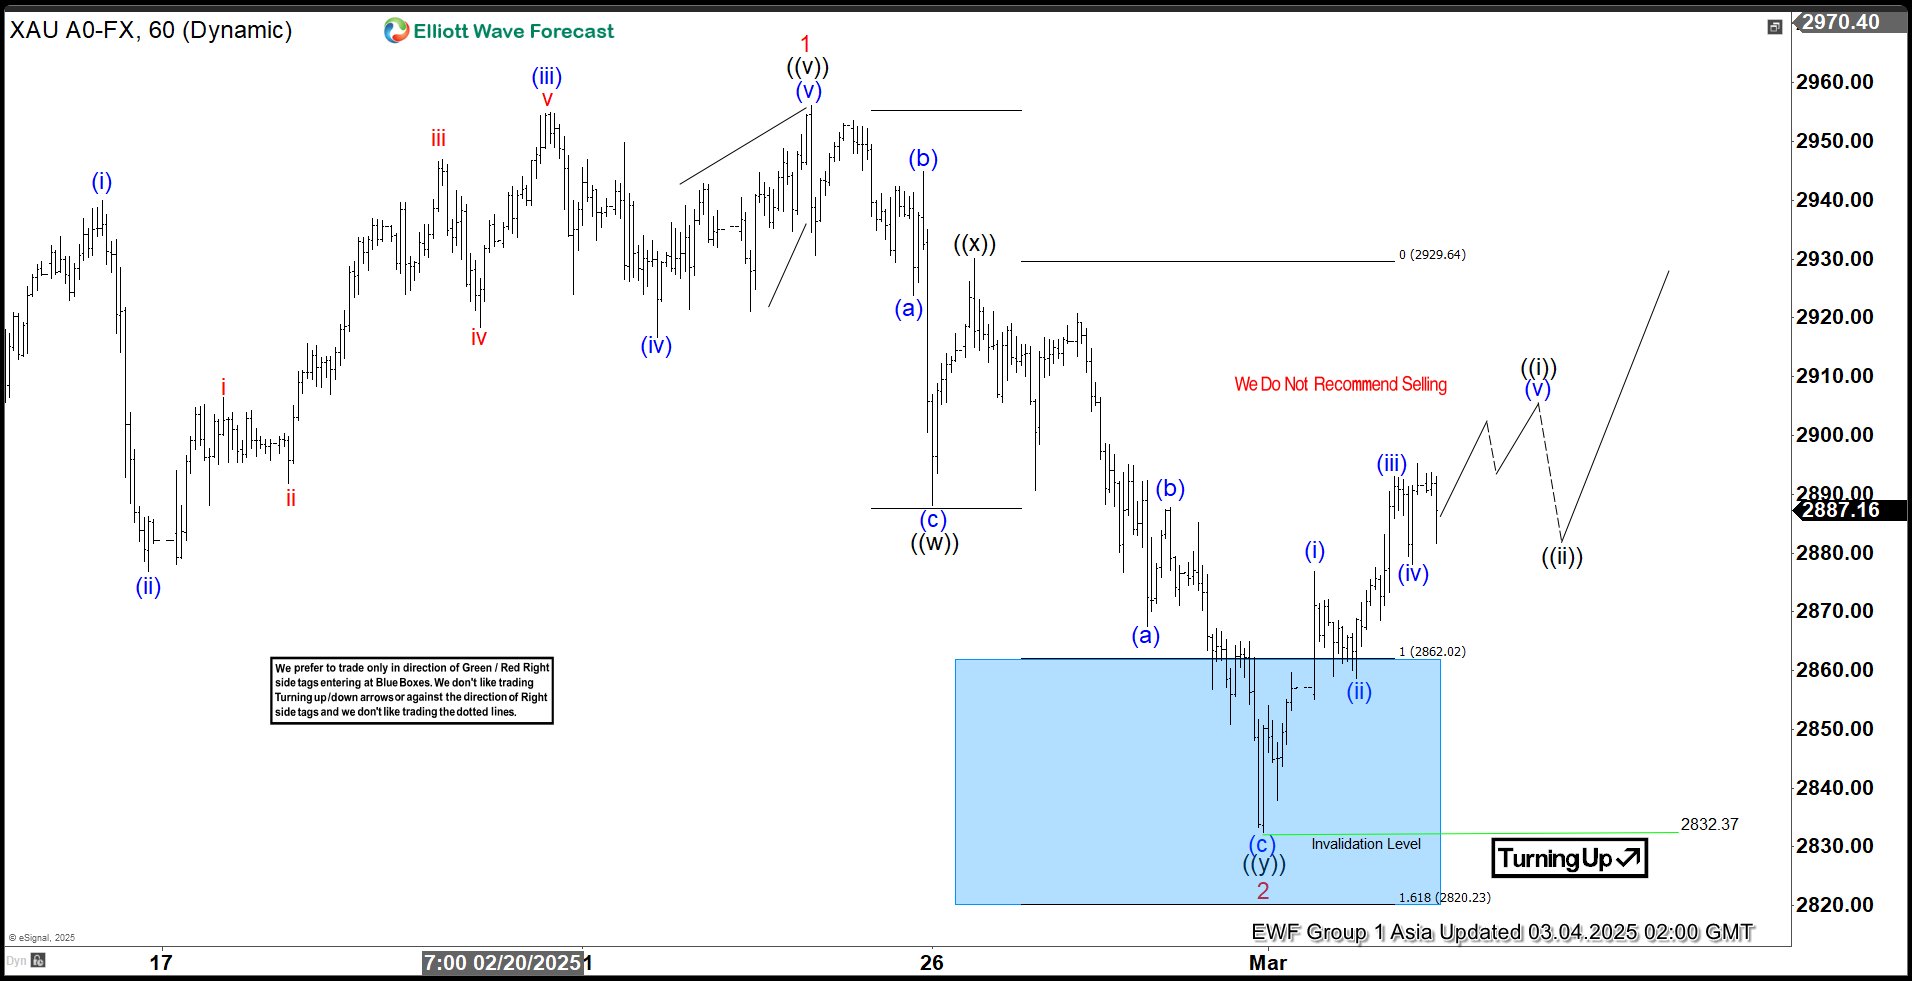
Elliott Wave View: Gold (XAUUSD) Turning Higher from Blue Box
Short Term Elliott Wave View in Gold (XAUUSD) suggests that cycle from 12.18.2024 low is in progress as a 5 waves impulse. Up from 12.18.2024 low, wave 1 ended at 2956.15 as the 1 hour chart below shows. Pullback in wave 2 unfolded as a double three Elliott Wave structure. Down from wave 1, wave (a) ended at 2923.8 and wave (b) ended at 2944.93. Wave (c) lower ended at 2888.09 which completed wave ((w)) in higher degree. Rally in wave ((x)) ended at 2930.11 and the metal has resumed lower.
Down from wave ((x)), wave (a) ended at 2867.57 and rally in wave (b) ended at 2887.68. Final leg wave (c) lower ended at 2832.37 which completed wave ((y)) of 2. The metal has turned higher in wave 3. Up from wave 2, wave (i) ended at 2876.9 and wave (ii) ended at 2858.74. Wave (iii) higher ended at 2893.07 and pullback in wave (iv) ended at 2878.11. Expect wave (v) of ((i)) to end soon, then it should pullback in wave ((ii)) to correct cycle from 2.28.2025 low before it resumes higher. Near term, as far as pivot at 2832.3 low stays intact, expect dips to find support in 3, 7, or 11 swing for further upside.
Gold (XAUUSD) 60 Minutes Elliott Wave Chart
XAUUSD Video
https://www.youtube.com/watch?v=4A1HLd38FFU
It’s No Longer a Threat, It’s Reality
Today marks a turning point in Donald Trump’s tariff policy. It is the day the tariff threat will materialize – unless there is a surprise U-turn – and hammer hopes that the aggressive tariff threats were not just a negotiation tactic. As a result, the Canadian and the Mexican imports will be hit by 25% levies, and the Chinese imports will be subject to 20% tariff. In addition, the US will impose tariffs on agricultural product imports starting from April 2nd and tariffs as highs as 25% are expected to hit the European imports in the foreseeable future.
Hence, markets are nervous since yesterday. The European stocks opened the week on a positive note as the clash between Trump and Zelensky forced the European countries to gather in a so-called ‘coalition of the willing’ to provide joint military support to Ukraine. Plus, EU Commission’s President Ursula von der Leyen said that they will relax the rules for carmakers for hitting CO2 emission targets originally set for this year and give the companies a 3-year window to align with the regulations. In practice, it means that if a carmaker doesn’t hit its carbon emission target this year, it will have two more years to do so, even if it means that it should increase efforts for the next two years. But above all, it means that when times are rough, even the Europeans could relax the rules and that nothing is written on a rock.
As such, the prospects of higher spending, hope that strict regulations could be relaxed and the expectation that the latter cocktail could boost growth in Europe further fuelled appetite in European equities on Monday. European defense stocks led the rally. The BAE systems jumped more than 14.50% to a record high, Rheinmetall bounced nearly 14%, Leonardo gained more than 16%, the French Dassault Aviation and Thales gained between 15 and 16%. Carmakers were also up, though gains there remained more reasonable. Volkswagen for example gained 2.30%. And overall, the Stoxx 600 reached a fresh record high, the DAX was up by more than 3% at some point and posted its best day since 2022, the euro bounced more than 1% against the US dollar and the USDSEK fell almost 2.50% as their military industry is seen as a major beneficiary of the rising European defense spending.
On the data front, yesterday’s CPI update came in slightly-higher-than expected by analysts but investors focused on the fact that inflation further eased toward the European Central Bank’s (ECB) 2% policy target rather than the fact that it eased less than expected. The further easing in inflation cementing the expectation that the ECB is heading towards an almost certain 25bp cut when it meets this Thursday.
Across the Atlantic, the picture was much less full of hope. The realization that the tariff threats will turn into reality hit sentiment, along with unideal ISM data showing that US manufacturing activity slowed more than expected in February while prices rose significantly faster than expected. And there is no magic, the tariffs are about the make the inflation headache worse in the US. Rising inflation expectations reduce the Federal Reserve’s (Fed) ability to ease policy to give support to slowing economy. And when the Fed is no longer there to save the market, bad news become bad news.
It’s crucial to note that market sentiment is now influenced less by the central bank policies and the level of yields, and more by growth expectations. As such, the US yields continue to fall not on dovish Fed expectations but on waning growth expectations. Atlanta Fed updated its US growth forecast for Q1 and now forecasts that the US economy will contract by 2.8% this quarter. As a result, investors are fleeing the highly valued US stocks. The S&P500 fell 1.76% yesterday, Nasdaq 100 tanked more than 2%. Nvidia tumbled almost 9% despite news that TSM will invest $100bn in US to diversify operations from the geopolitically sensitive Taiwan. The rotation trade from American to European equities is strongly in play and is increasingly backed by the waning US growth expectations and rising European growth bets.
Across Pacific, Chinese are dealing with Trump in their own way. They said that they will retaliate by imposing tariffs on US agricultural and food products. The CSI 300 index still slipped below its 50-DMA, but dipbuyers are joining in on expectation that the government could announce fresh support measures this week, while the AI optimism – though less sharp these days – could give leverage to nascent optimism.
In energy, crude oil fell 2% below the $70pb psychological mark – not necessarily on trade fears – but on news that OPEC+ will start restoring output production from April because Trump wants cheaper oil. OPEC will serve 138’000 more barrels per day to the market from next month and will gradually restore 2.2mbpd by 2026, abruptly ending the output cut policy of the past two years, whereas oil traders were expecting OPEC to continue to delay its production restoration plans as oil prices remained below ideal levels for Saudi Arabia. Prospects of higher output that will likely lead to output supply later this year is set to send the price of crude toward the $50/60 range in the first half. Cheers to that!
Geopolitical Ripples from Trump’s Tariffs and Aid Suspension
In focus today
In the euro area, focus turns to the unemployment rate for January. The labour market has continued to prove very resilient with record-low unemployment at 6.3%, which is also the expectation for January.
Economic and market news
What happened overnight
In Japan, the unemployment rate surprised to the topside, coming in at 2.5% in January (cons: 2.4%), up from 2.4% in December. Meanwhile, the jobs-to-applications ratio increased to 1.26 in November (cons: 1.25), up from 1.25 in the previous three months.
What happened yesterday
In the US, the ISM manufacturing index declined from 50.9 to 50.3 in February (cons: 50.7), suggesting that the rebound in production stalled in February. The message from today's ISM data is rather different compared to PMI figures, which were revised slightly higher from 51.6 to 52.7 in the final numbers out earlier today. Looking ahead, the risk related to tariffs on key trading partners could add to the ongoing rise in input prices, which could add to goods inflation depending on pricing power across producers.
In the euro area, HICP inflation declined to 2.4 % y/y in February from 2.5% (cons: 2.3%). Core inflation also fell slightly less than expected to 2.6 % y/y from 2.7% y/y (cons: 2.5%). The decline in core was due to services inflation, which declined due to the weaker momentum seen in the past months and base effects. It was overall another print that supports further rate cuts by the ECB but that also shows that upside risks from wage growth to services inflation remains as momentum continues to be too high. Yet, with falling wage growth we also expect services inflation to decline further, which in combination with low goods price increases should sedt core inflation below the 2% target from summer this year.
Furthermore, final manufacturing PMI for February was revised slightly up to 47.6 from the initial 47.3 in the flash release. We anticipate that the manufacturing PMI will continue to gradually increase and reach the 50-mark after the summer, supported by declining policy rates and increasing domestic demand.
In Sweden, PMI for the manufacturing sector came in strong, rising from 53.0 to 53.5, driven by a broad increase in production, orders, employment and delivery times. Only the delivery time sub-component declines, but overall, a solid print and average over the last six months is 52.9.
On the geopolitical front, US President Trump Donald Trump confirmed the imposition of 25% tariffs on all imports from Canada and Mexico, effective today, 4 March, which intensified market concerns and sent financial markets reeling. Furthermore, Trump signed an executive order raising additional tariffs on Chinese imports from 10% to 20%, also effective today. In a joint meeting with TSMC, the Taiwanese semiconductor company, Trump also announced a plan for the world's largest contract chip maker to invest USD 100bn in building five additional chip facilities in the US in the coming years.
Additionally, the US announced the suspension of its military aid to Ukraine to pressure President Zelenskiy to settle a deal with Russia amid tensions with President Trump. This move could advantage Russian forces and challenges European allies to increase support for Kyiv. The announcement comes after a day in equities when Europe's defence sector experienced a significant rally, with substantial share price increases as investors anticipated increased military spending by European governments.
Equities: Equities rallied and sold off yesterday. The most intriguing aspect to consider is whether it is more interesting to observe European equities rallying despite the known risk of tariffs and yesterday's deadline, or to see US stocks being sold off throughout the session, which, in our opinion, should be viewed as a result of Trump's tariff policies. Of course, global indices are down significantly, as the US constitutes the majority of these indices, and the US drop exceeded the gains in Europe. However, it is worth noting that financials and industrials rose alongside some defensive sectors on a day when we received confirmation of some of the largest tariff increases in modern history. When we mention confirmation, it is because Trump announced it yesterday, but nothing is set in stone, and he might change it today.
Secondly, the MAG 7 lost 3.1%, and other high-flying assets from last year, like crypto currencies, took a hit yesterday. In other words, the financial market reaction is not a direct reflection of what the macro impact of the tariffs will be, but rather a rotation away from some of last year's winners and the highest-valued segments of the equity market.
Similarly, Chinese equities are higher at the time of writing, just after the year-to-date tariff increase reached 20 percentage points, nearly twice the 12-percentage point rise seen during the 2018-19 trade war. From a macro and earnings perspective, this makes very little sense, but from a valuation and under-owned perspective, it tells a compelling story.
Thirdly, where do we see the most significant stress right now in our correction monitor? It is among the US retail investor segment, where we have a negative z-score of -2.8. This is quite indicative of how divergent the equity space is at the moment and how we have off-setting forces at play. In the US yesterday, Dow -1.5%, S&P 500 -1.8%, Nasdaq -2.6%, and Russell 2000 -2.8%.
To put things further into perspective, most US indices are lower for the year, while major European indices are up double digits, and the Hang Seng is nearly 15% higher year-to-date. Futures are lower in Europe this morning. In rounded numbers, at the time of writing, Europe is down about 0.7%, and the UK and Germany are down about 0.5%. In other words, down less than the indices rose yesterday. US futures are higher by 0.1-0.5% at the time of writing.
FI: The risk of a potential significant increase in defence funding across the euro area led to a significant sell-off yesterday driven by the long end, and particular Germany. The 30y German yield rose 10bp, slightly more than the 10y Bund by 9bp to briefly touching above 2.5%. The risk of additional supply for defence, coupled with the announcement of a long 15y Belgian bond (2042), the new 10y Dutch bond to come to the market today as well as Austria tapping the 2035 and 2053 bonds meant significant long-end supply to be absorbed. There is also potential of a new German 30y syndication to be announced today, see Reading the Markets EUR A cut is the easy part, 28 February, where we look at the pricing of the new 30y Benchmark bond.
FX: Monday was an eventful day for FX markets. SEK was among the big winners amid an outperformance in European assets with EUR/SEK declining close to the 11.00 mark. Conversely, EUR/USD was in for a strong performance, gaining 1% trading close to the 1.05 mark. CAD was left vulnerable as Trump reiterated that Canada (and Mexico) could not avert the 25% tariffs scheduled to take effect today, 4 March. Oil prices dropped yesterday after OPEC+ surprised the market by announcing it will proceed with scheduled production hikes from April - the market had likely expected the cartel to postpone hiking output yet again.