Sample Category Title
USD/JPY Mid-Day Outlook
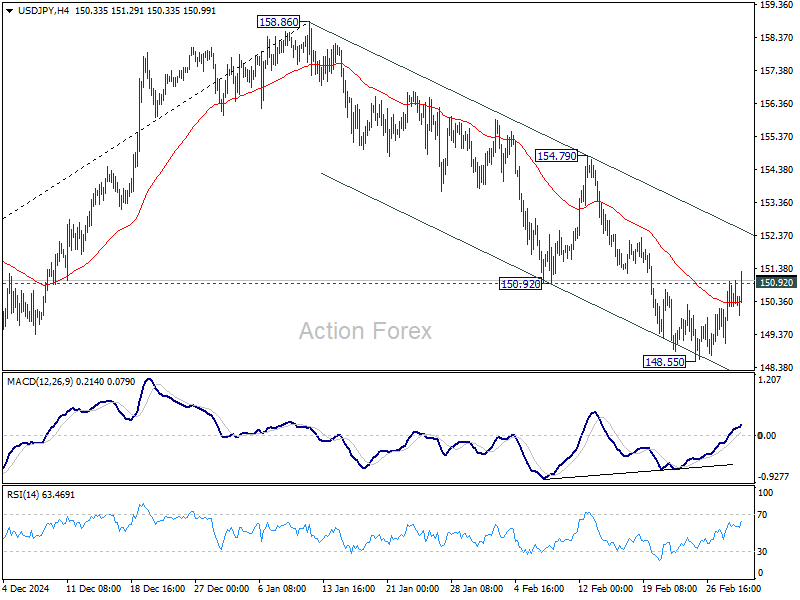
Daily Pivots: (S1) 149.49; (P) 150.24; (R1) 151.38; More...
Break of 150.92 support turned resistance suggests short term bottoming at 148.55, on bullish convergence condition in 4H MACD. Intraday bias is back on the upside for stronger rebound to near term falling channel resistance (now at 152.61). On the downside, break of 148.55 will resume the fall from 158.86 to 61.8% retracement of 139.57 to 158.86 at 146.32 next.
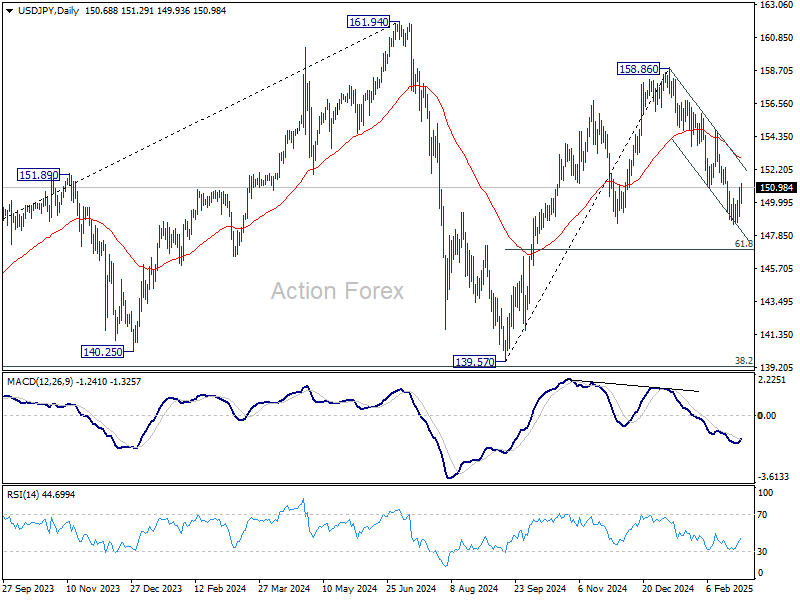
In the bigger picture, price actions from 161.94 are seen as a corrective pattern to rise from 102.58 (2021 low). In case of another fall, strong support should be seen from 38.2% retracement of 102.58 to 161.94 at 139.26 to bring rebound. However, sustained break of 139.26 would open up deeper medium term decline to 61.8% retracement at 125.25.
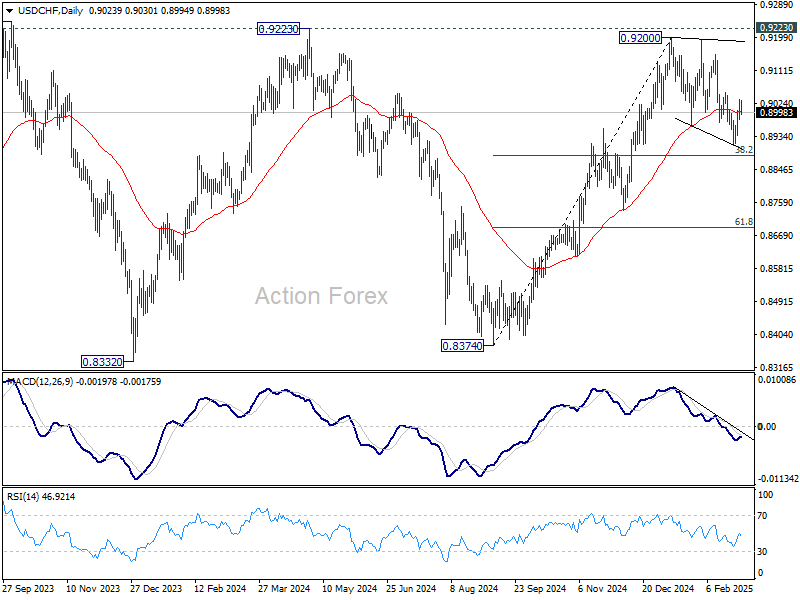
USD/CHF Mid-Day Outlook
Daily Pivots: (S1) 0.8996; (P) 0.9017; (R1) 0.9050; More…
No change in USD/CHF's outlook and intraday bias stays neutral. On the upside, firm break of 0.9053 will suggest that corrective pattern from 0.9200 has already completed at 0.8911. Further rally should then be seen to retest 0.9200 resistance. In case of another fall, downside should be contained by 38.2% retracement of 0.8374 to 0.9200 at 0.8884 to bring rebound.
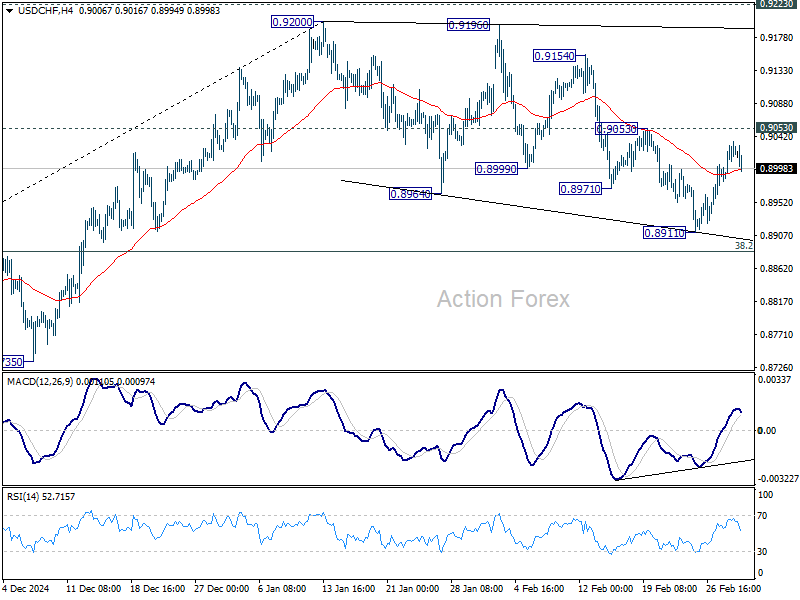
In the bigger picture, decisive break of 0.9223 resistance will argue that whole down trend from 1.0342 (2017 high) has completed with three waves down to 0.8332 (2023 low). Outlook will be turned bullish for 1.0146 resistance next. Nevertheless, rejection by 0.9223 will retain medium term bearishness for another decline through 0.8332 at a later stage.
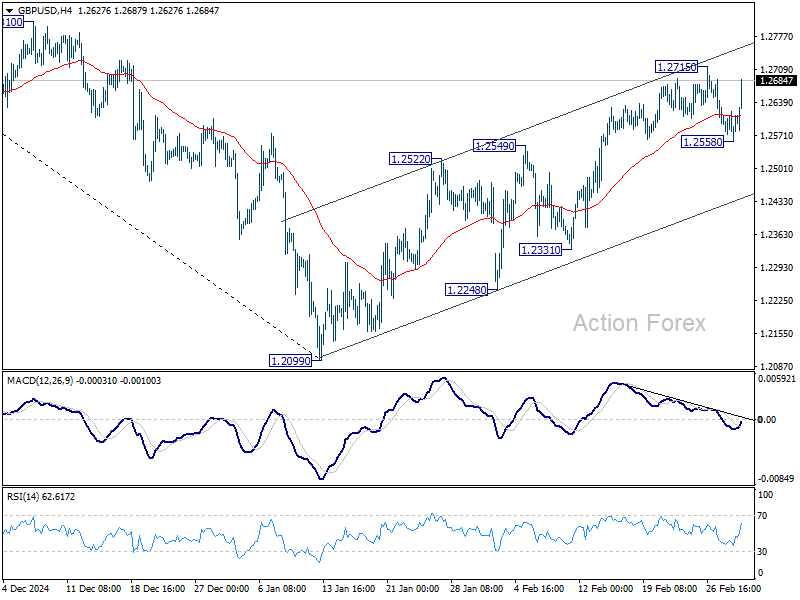
GBP/USD Mid-Day Outlook
Daily Pivots: (S1) 1.2549; (P) 1.2585; (R1) 1.2612; More...
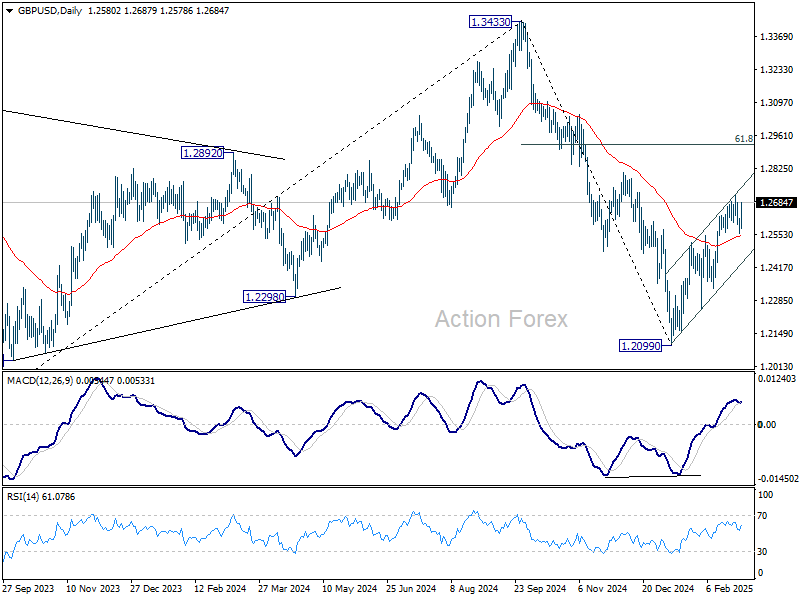
Intraday bias in GBP/USD is turned neutral first with current strong recovery. On the upside, break of 1.2715 will resume the rally from 1.2099 to 1.2810 resistance. Firm break there will target 61.8% retracement of 1.3433 to 1.2099 at 1.2923. On the downside, break of 1.2558 will resume the fall from 1.2715 to near term rising channel support (now at 1.2439).
In the bigger picture, rise from 1.0351 (2022 low) should have already completed at 1.3433 (2024 high), and the trend has reversed. Further fall is now expected as long as 1.2810 resistance holds. Deeper decline should be seen to 61.8% retracement of 1.0351 to 1.3433 at 1.1528, even as a corrective move. However, firm break of 1.2810 will dampen this bearish view and bring retest of 1.3433 high instead.
EUR/USD Mid-Day Outlook
Daily Pivots: (S1) 1.0350; (P) 1.0385; (R1) 1.0410; More...
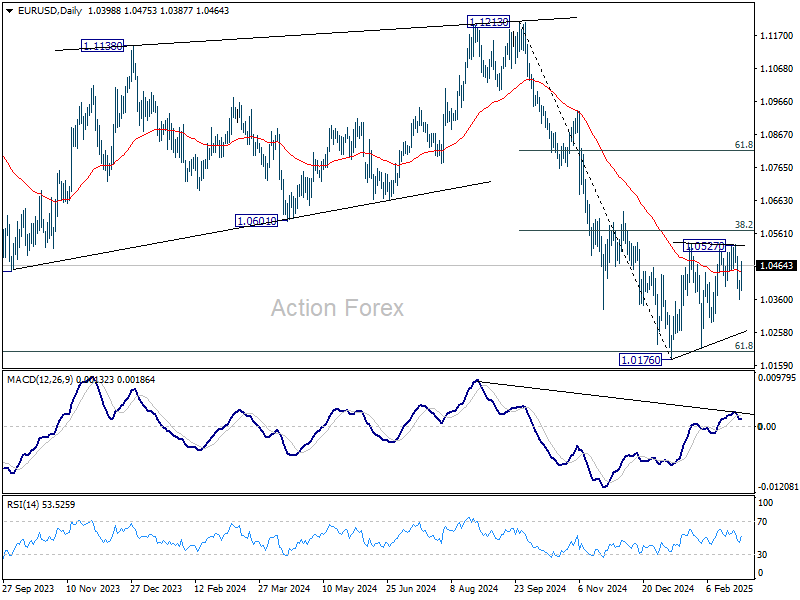
EUR/USD's strong rebound today is mixing up the near term outlook. But still, intraday bias stays neutral and further decline is in favor as long as 38.2% retracement of 1.1213 to 1.0176 at 1.0572 holds. Below 1.0358 will target 1.0176/0210 support zone first. Firm break there will resume whole fall from 1.1213, and carry larger bearish implications. However, sustained trading above 1.0572 will pave the way to 61.8% retracement at 1.0817.
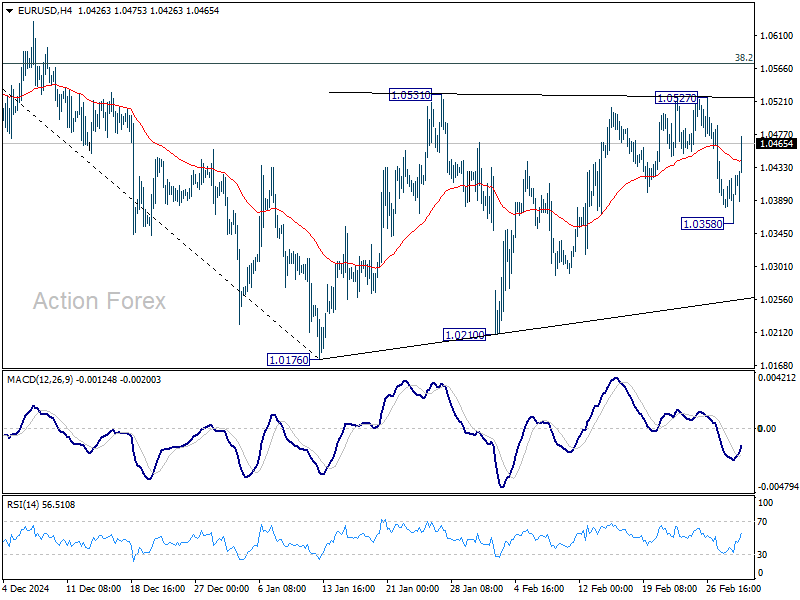
In the bigger picture, immediate focus is on 61.8 retracement of 0.9534 (2022 low) to 1.1274 (2024 high) at 1.0199. Sustained break there will solidify the case of medium term bearish trend reversal, and pave the way back to 0.9534. However, reversal from 1.0199 will argue that price actions from 1.1274 are merely a corrective pattern, and has already completed.
“Coalition of the Willing” Fuels Euro Strength, Boosts Defense Outlook
European markets saw a strong rally today, with notable fund inflows driving gains in DAX and Euro. Investor sentiment was boosted by expectations of increased military spending after the announcement of the UK and France-led “Coalition of the Willing” to support Ukraine. FTSE and Sterling also benefited from the renewed optimism, as traders priced in the broader economic implications of higher defense expenditures across Europe.
Defense stocks led the charge, as recent geopolitical developments, in particular the Trump-Zelenskiy clash in the Oval Office, pointed to the beginning of a European rearmament cycle. With growing isolationism in the US under President Donald Trump, European nations appear to be shifting toward greater self-reliance in military production, reducing dependence on the US. This shift has fueled expectations of long-term defense budget expansions, providing fresh momentum for European economies.
Meanwhile, the latest Eurozone inflation data provided a mix of signals for policymakers at ECB. Prices growth did decelerate slightly in February, an outcome that might please the doves. However, the slowdown probably isn’t enough to change please the hawks for letting guard off inflation risk.. Policymakers are still certain to continue their measured approach to rate cuts with another 25bps reduction this week. But the data will spark fresh debate over the pace and extent of easing beyond the decision.
Overall in the currency markets, Euro is the best performer for the day so far, followed by Sterling, and then Aussie. Yen is the worst, followed by Dollar, and then Kiwi, Loonie and Kiwi are positioning in the middle.
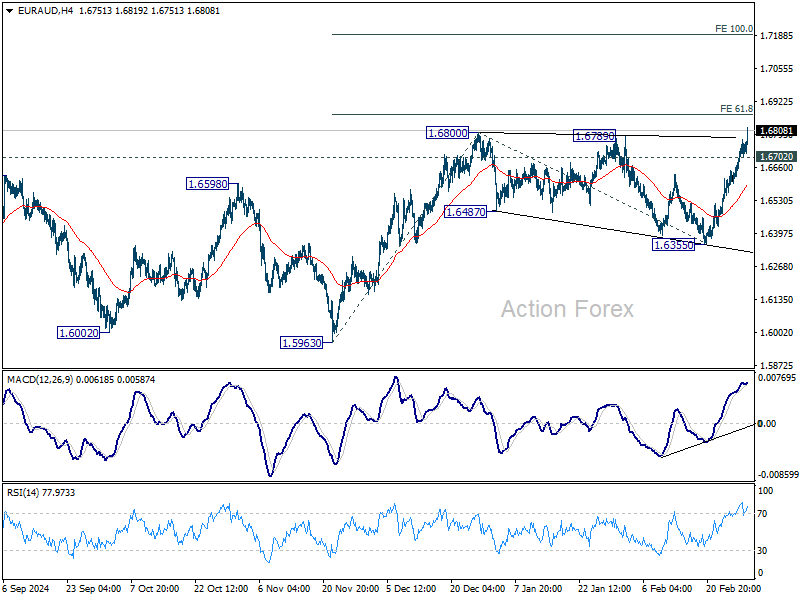
Technically EUR/AUD's break of 1.6800 resistance should confirm resumption of whole rally from 1.5693. Further rise should be seen to 61.8% projection of 1.5963 to 136800 from 1.6355 at 1.6872. Decisive break there could prompt upside acceleration to 100% projection at 1.7192. Nevertheless, break of 1.6702 support will delay the bullish case and bring consolidations first.
In Europe, at the time of writing, FTSE is up 0.77%. DAX is up 2.33%. CAC is up 1.43%. UK 10-year yield is up 0.052 at 4.537. Germany 10-year yield is up 0.091 at 2.502. Earlier in Asia, Nikkei rose 1.70%. Hong Kong HSI rose 0.28%. China Shanghai SSE fell -0.12%. Singapore Strait Times rose 0.34%. Japan 10-year JGB yield rose 0.034 to 1.410.
Eurozone CPI falls to 2.4%, core CPI slows to 2.6%, both above expectations
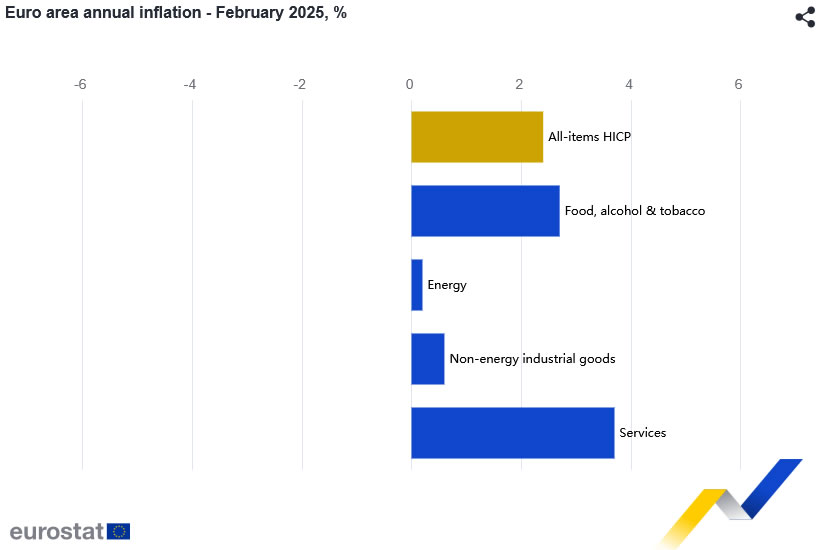
Eurozone CPI ticked down from 2.5% yoy to 2.4% yoy in February, above expectation of 2.3% yoy. Core CPI (ex-energy, food, alcohol & tobacco), fell from 2.7% yoy to 2.6% yoy, above expectation of 2.5% yoy.
Looking at the main components of inflation, services is expected to have the highest annual rate in February (3.7%, compared with 3.9% in January), followed by food, alcohol & tobacco (2.7%, compared with 2.3% in January), non-energy industrial goods (0.6%, compared with 0.5% in January) and energy (0.2%, compared with 1.9% in January).
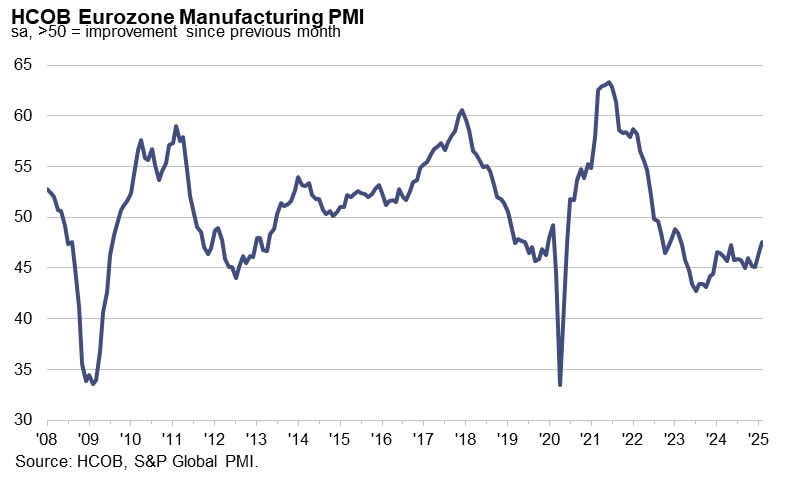
Eurozone PMI manufacturing finalized at 47.6, a 24-mth high
Eurozone manufacturing activity showed signs of stabilization in February, with PMI finalized at 47.6, a 24-month high, up from January’s 46.6. While still in contraction territory, the improvement offers some hope that the sector may be finding its footing.
Among individual countries, Ireland led the rankings at 51.9, marking a 12-month high, while the Netherlands reached the neutral 50.0 mark for the first time in eight months. However, Spain dipped to a 13-month low at 49.7, and Italy, Austria, Germany, and France all remained below 50, despite showing some improvement.
Cyrus de la Rubia, Chief Economist at Hamburg Commercial Bank, emphasized that while the data is encouraging, it’s "too early to call it a recovery". New orders are still falling but at the slowest rate since May 2022, and production is inching closer to stabilization. After nearly three years of recession, there is potential for modest growth in the coming months.
Despite ongoing risks, most businesses remain optimistic about the future, with confidence slightly above its long-term average. This resilience is notable, given the looming threat of US tariffs. Additional positive factors include hopes that Russia’s war in Ukraine could come to an end this year, alongside expectations of greater political stability in Germany following the recent elections.
UK PMI manufacturing finalized at 46.9, job cuts accelerate
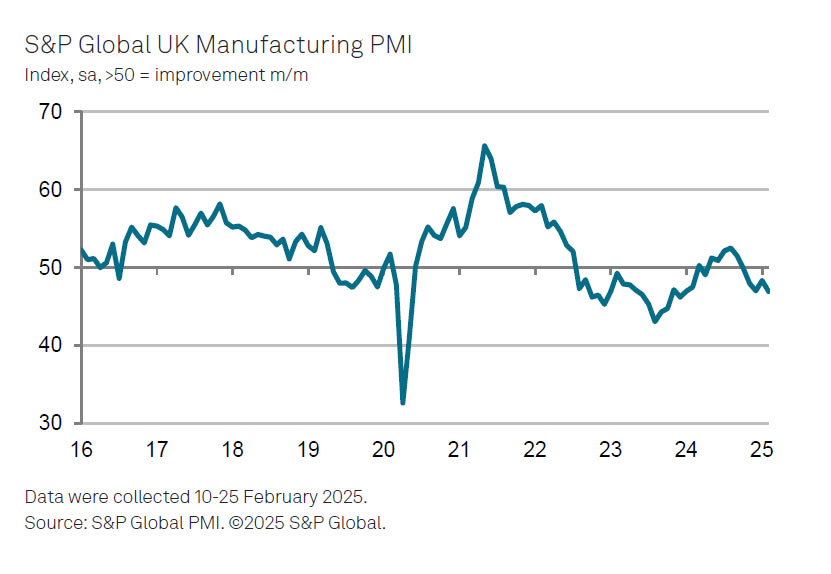
The UK manufacturing sector continued to struggle in February, with PMI Manufacturing finalized at 46.9, down from January’s 48.3, marking a 14-month low. Weak demand and declining confidence among clients have exacerbated the downturn, leading to falling output and new orders.
Rob Dobson, Director at S&P Global Market Intelligence, noted that UK manufacturers are facing an "increasingly difficult trading environment." The combination of subdued demand, rising cost pressures, and uncertainty over future economic conditions is making it harder for firms to sustain growth.
Inflation fears are also rising, particularly due to changes in the national minimum wage and employer NICs announced in the Autumn Budget.
One of the most concerning trends is the acceleration in job losses. The pace of staff reductions in the sector is now at levels not seen since the pandemic-induced slump in mid-2020.
Japan’s PMI manufacturing finalized at 49 in Feb, modest improvement but outlook remains weak
Japan’s manufacturing sector showed slight improvement in February, with PMI finalized at 49.0, up from 48.7 in January. However, the sector remains in contraction territory, reflecting ongoing struggles with weak demand.
According to Usamah Bhatti at S&P Global Market Intelligence, manufacturers cited soft global and domestic demand, with "muted conditions" in key markets such as the US, Europe, and China. Additionally, purchasing activity saw a solid and sustained decline.
The "near-term outlook remains clouded". Business confidence fell to its lowest level since mid-2020, driven by growing concerns over the impact of US trade policies and a slower-than-expected global economic recovery.
China’s Caixin PMI manufacturing rises to 50.8, but employment remains a concern
China’s Caixin PMI Manufacturing climbed to 50.8 in February, up from 50.1, exceeding expectations of 50.3.
Wang Zhe, Senior Economist at Caixin Insight Group, noted that new export orders rebounded, corporate purchasing increased, and logistics remained smooth. However, employment continued to decline, and output prices stayed weak.
Additionally, official PMI data released over the weekend further reinforced signs of recovery. The official PMI Manufacturing rebounded from 49.1 to 50.2, marking its highest level since November and moving back into expansionary territory. Additionally, the non-manufacturing PMI, which covers services and construction, ticked up to 50.4 from 50.2.
EUR/USD Mid-Day Outlook
Daily Pivots: (S1) 1.0350; (P) 1.0385; (R1) 1.0410; More...
EUR/USD's strong rebound today is mixing up the near term outlook. But still, intraday bias stays neutral and further decline is in favor as long as 38.2% retracement of 1.1213 to 1.0176 at 1.0572 holds. Below 1.0358 will target 1.0176/0210 support zone first. Firm break there will resume whole fall from 1.1213, and carry larger bearish implications. However, sustained trading above 1.0572 will pave the way to 61.8% retracement at 1.0817.
In the bigger picture, immediate focus is on 61.8 retracement of 0.9534 (2022 low) to 1.1274 (2024 high) at 1.0199. Sustained break there will solidify the case of medium term bearish trend reversal, and pave the way back to 0.9534. However, reversal from 1.0199 will argue that price actions from 1.1274 are merely a corrective pattern, and has already completed.
Return of Crypto Reserve Idea Halts Market Slide
Market Picture
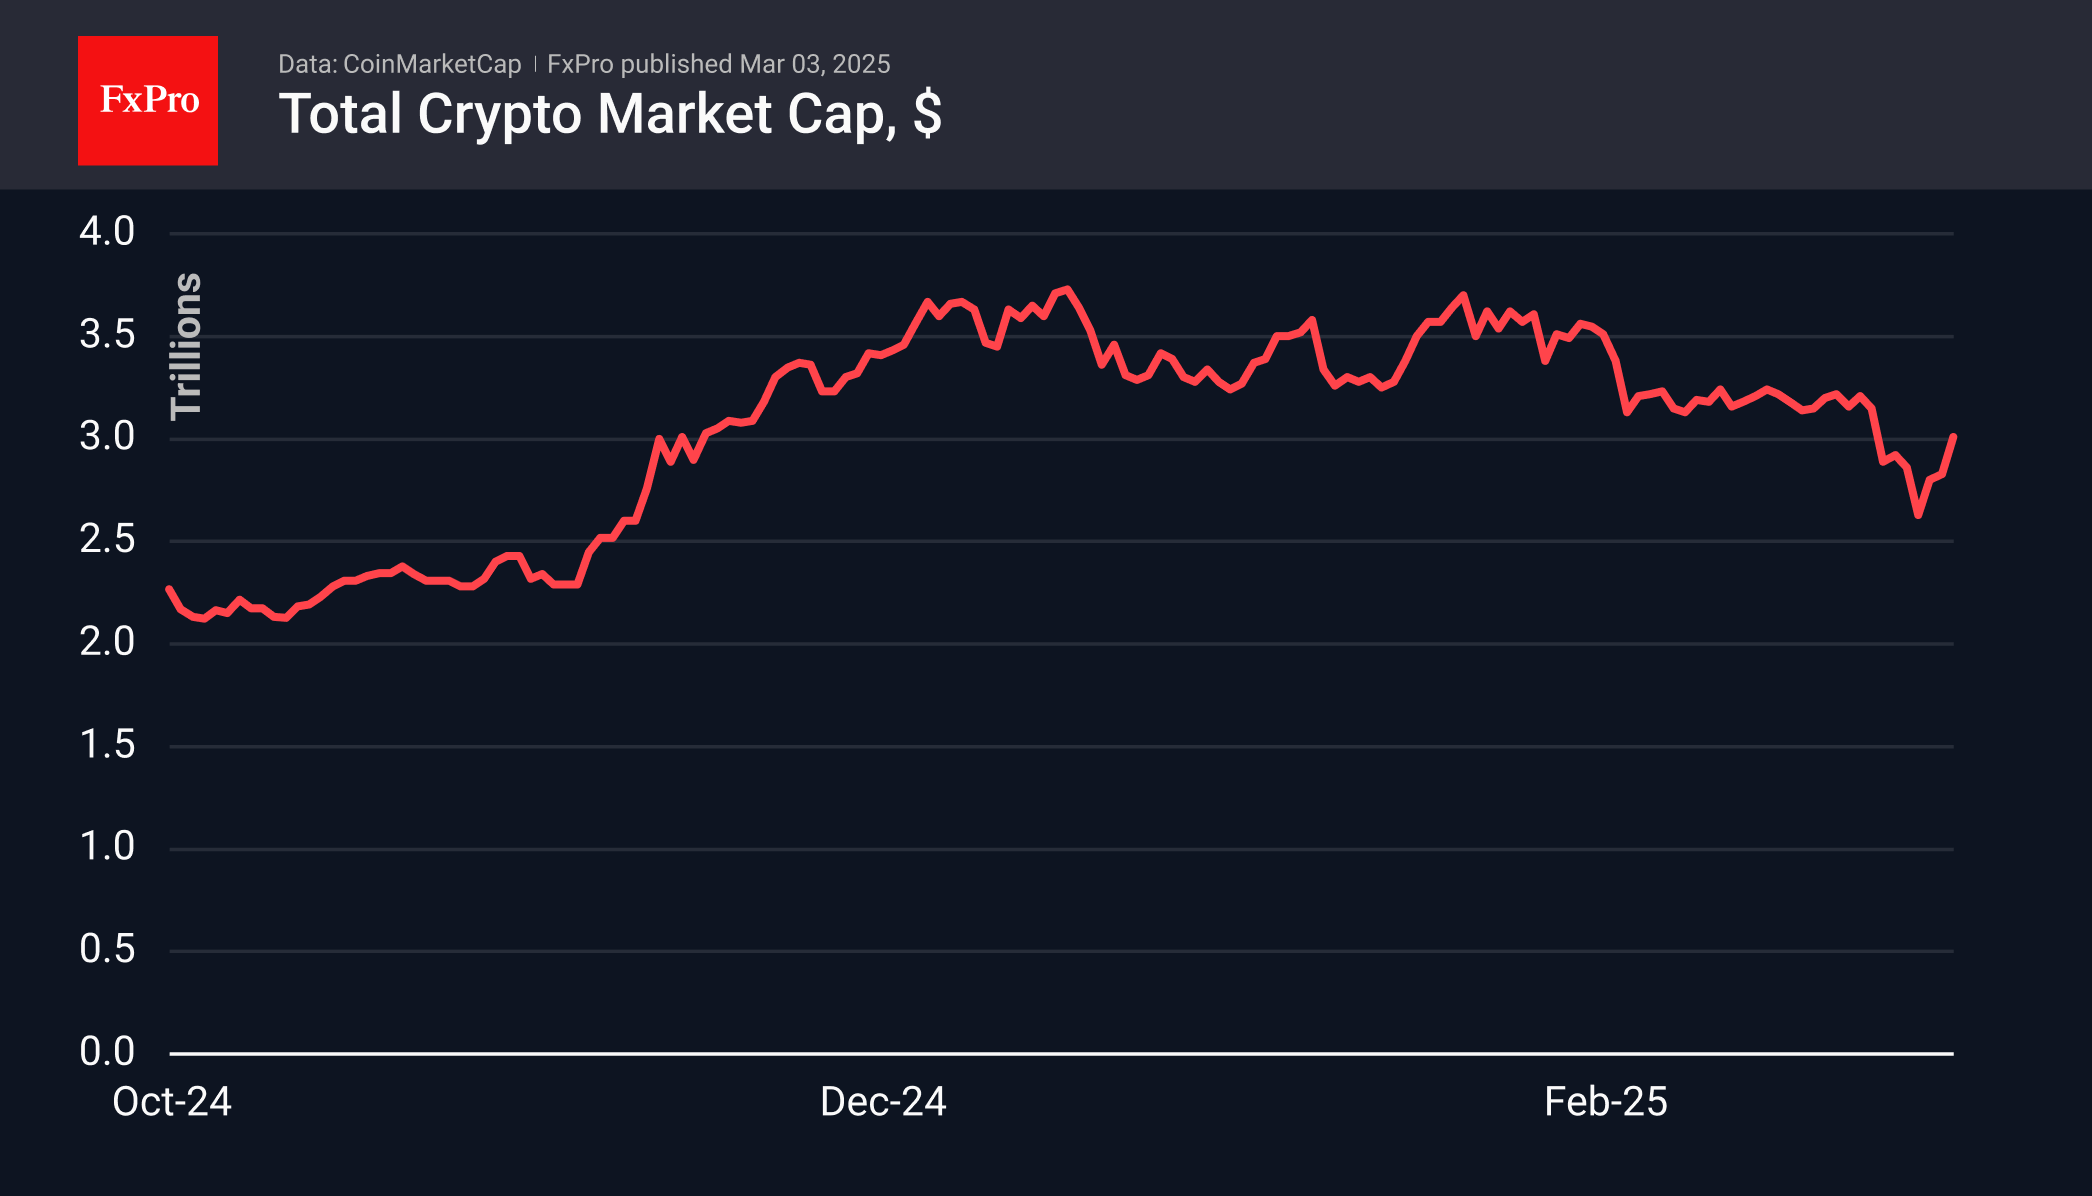
The crypto market rallied on Sunday following Trump’s renewed focus on establishing a US crypto reserve and his announcement of the first-ever crypto summit, set for March 7. The market cap soared past $3 trillion, briefly peaking at $3.15T, a sharp rebound from Friday’s low of $2.63T. This nearly 20% increase was largely fueled by low liquidity, making it crucial to watch whether these gains hold through Monday’s close.
Trump specifically mentioned XRP, SOL, and ADA, followed an hour later by BTC and ETH—cryptos that have since shown significant gains from their late-week lows.
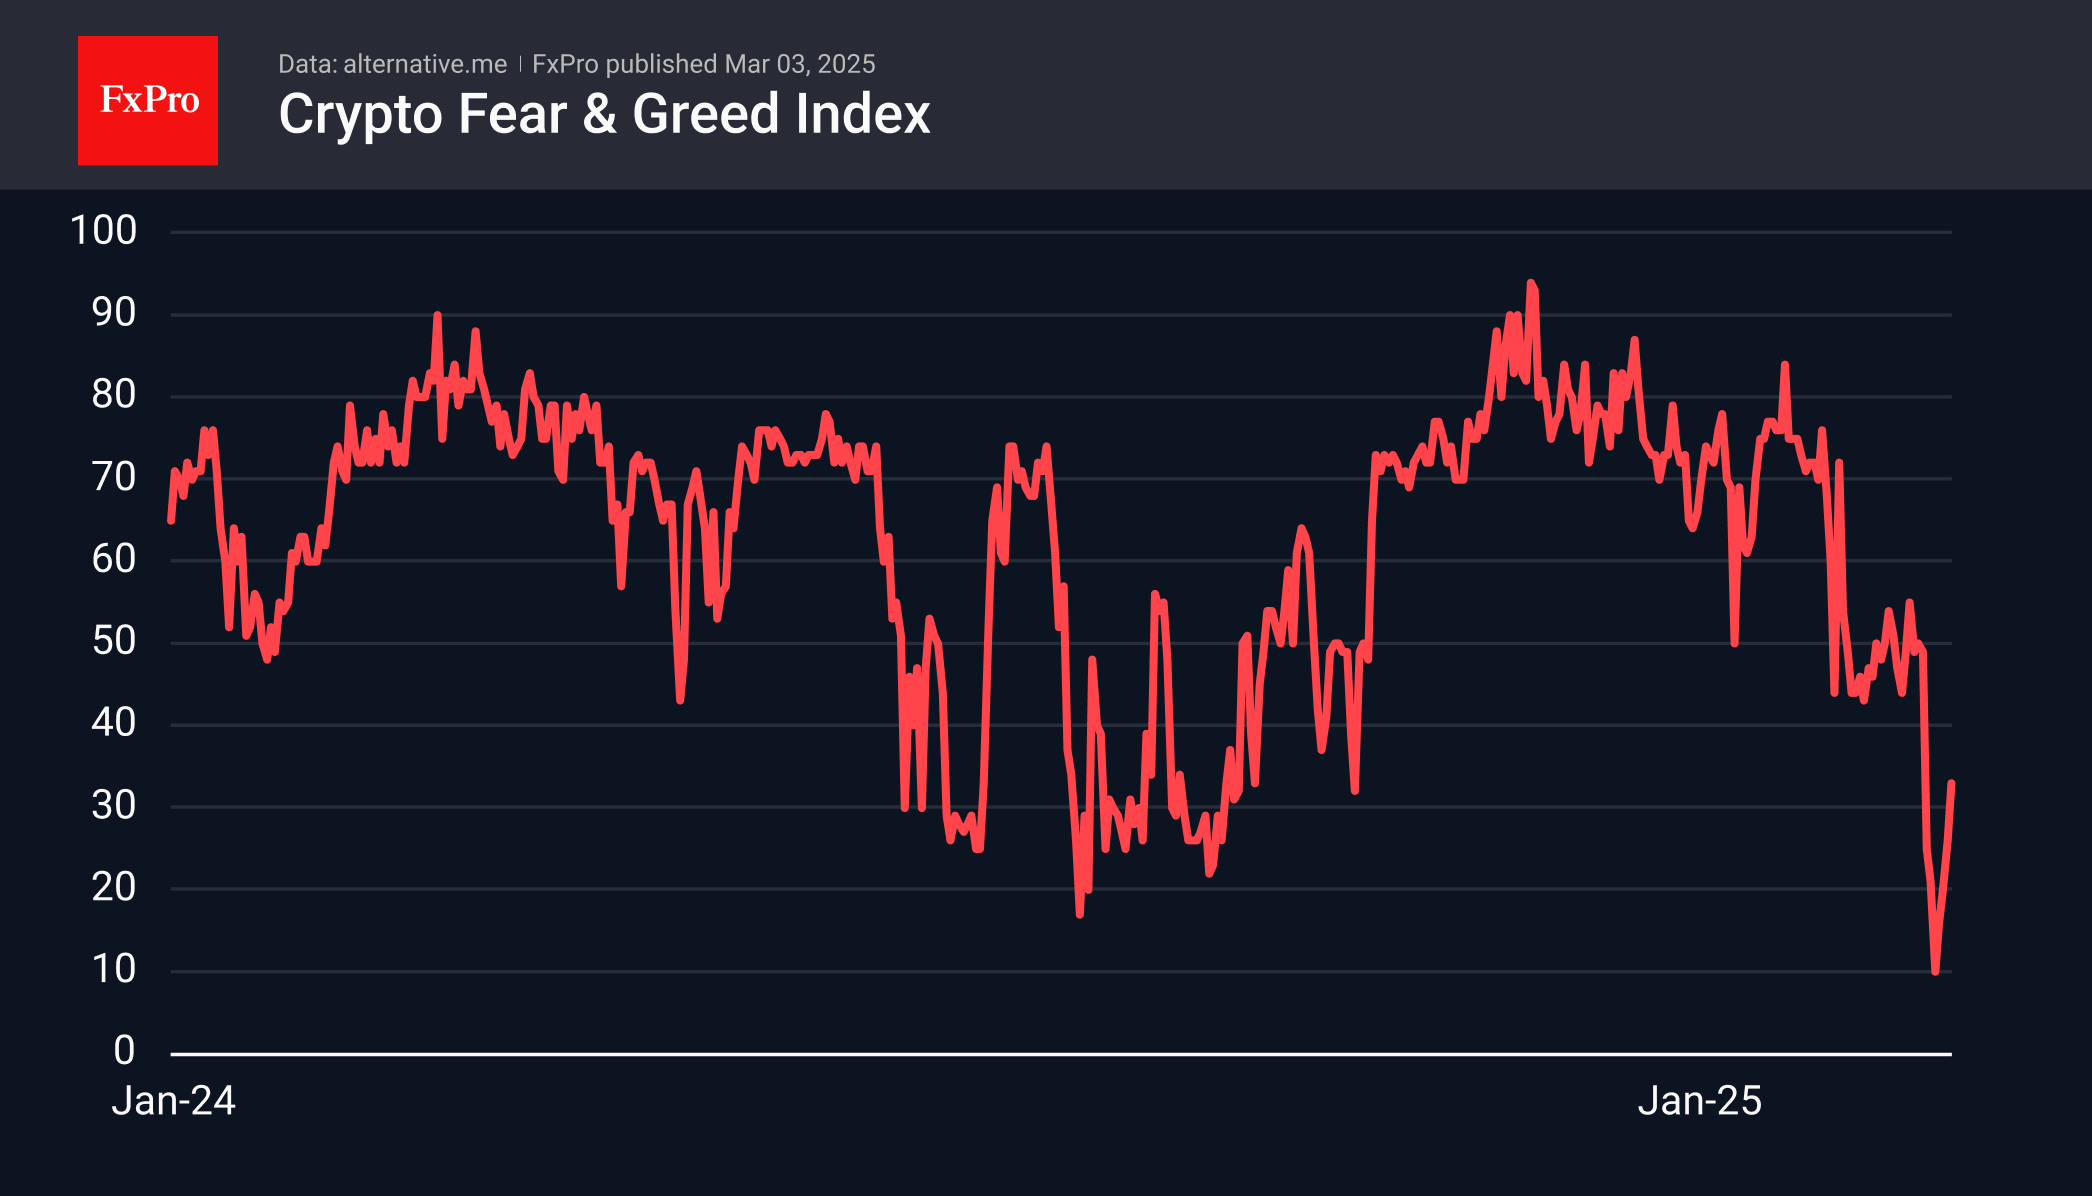
Meanwhile, the Cryptocurrency Fear and Greed Index climbed to 33, up from a multi-month low of 10 last Thursday, when the market hit its recent bottom.
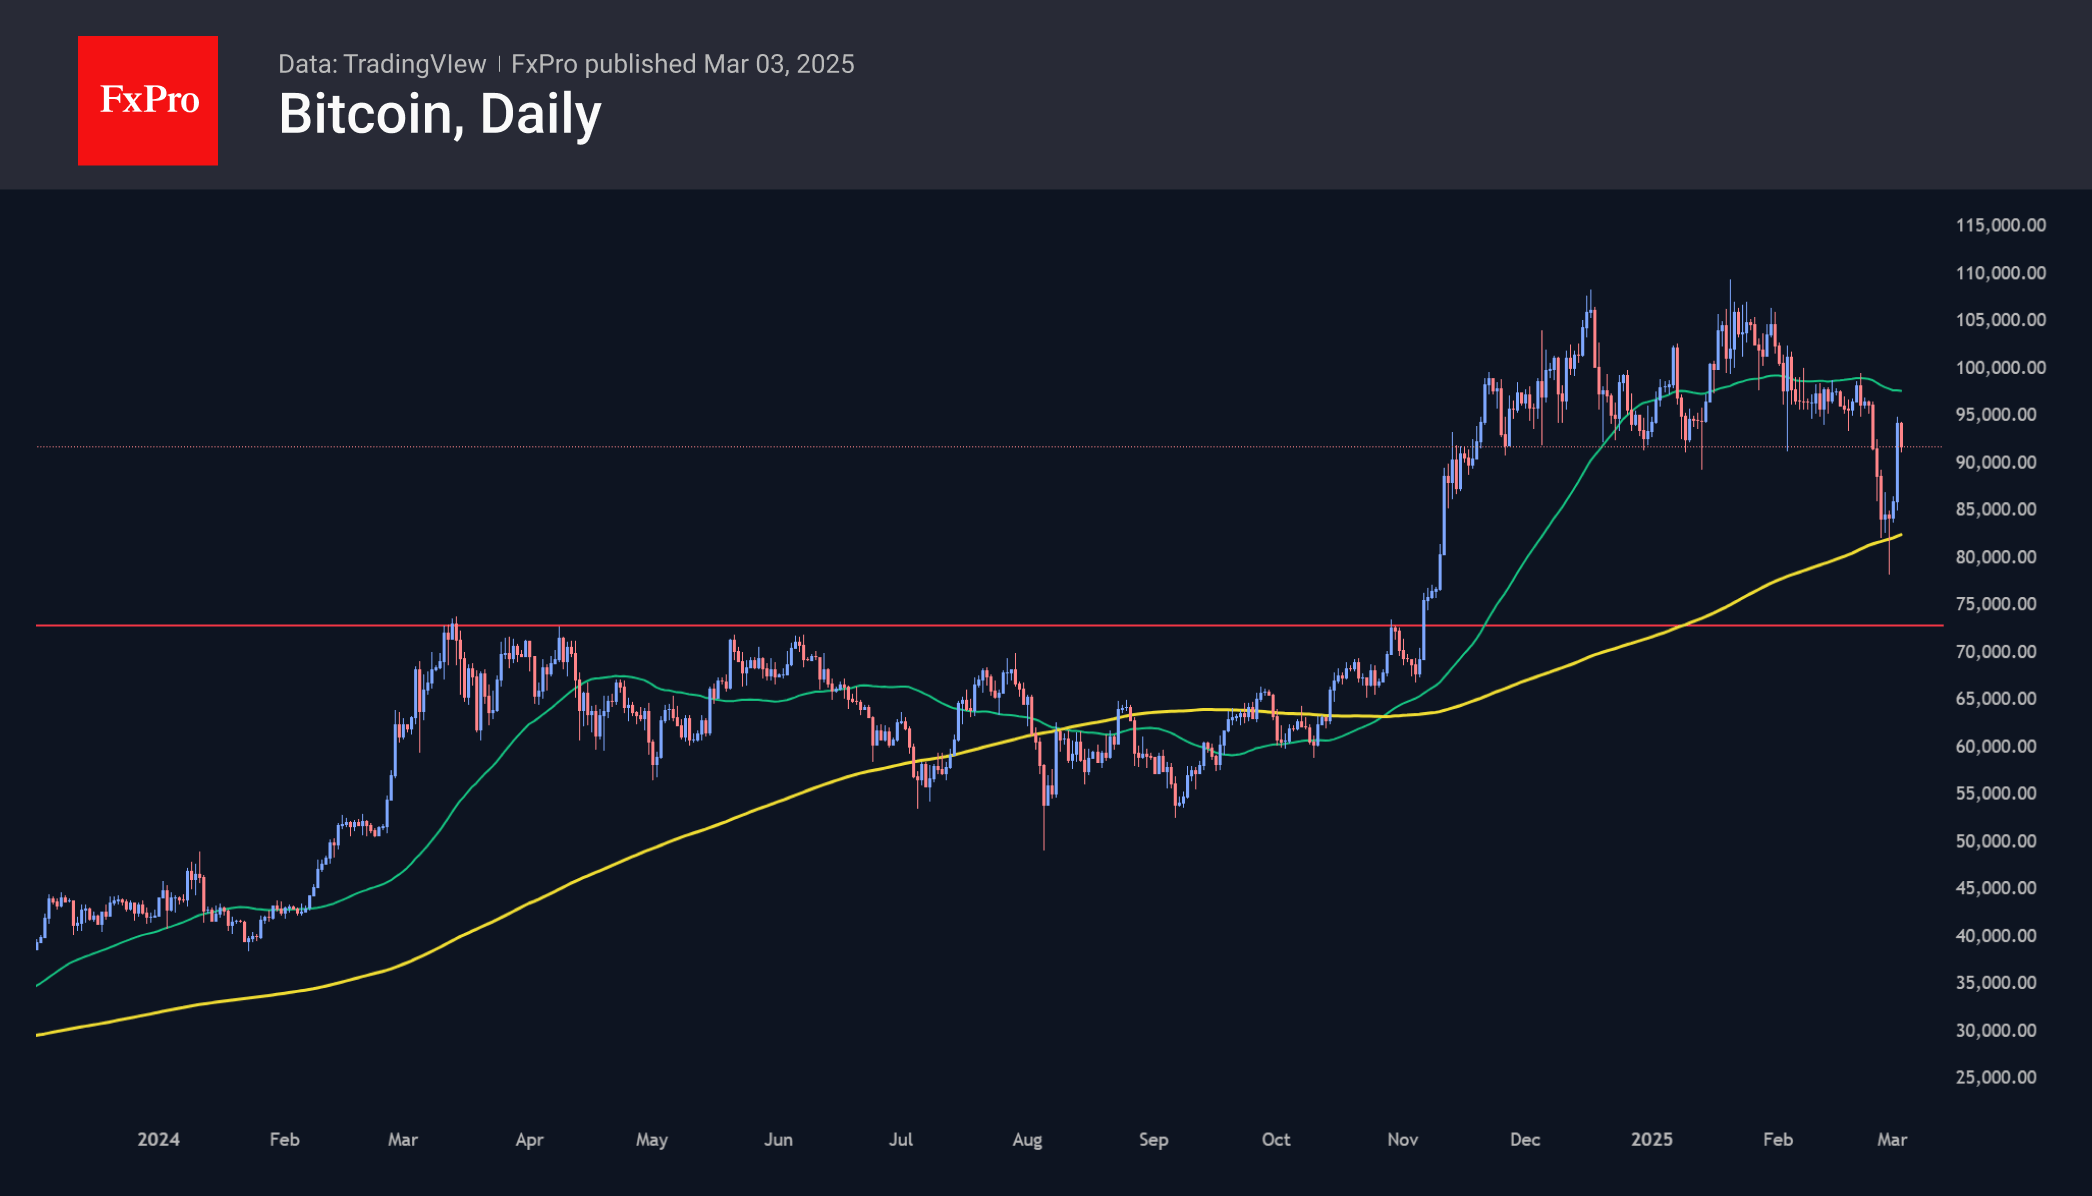
On the technical side, Bitcoin rebounded from Friday’s dip below the 200-day moving average and continued its ascent over the weekend, gaining more than 20% from its lows. However, BTCUSD has struggled to maintain momentum, slipping over 2% since Monday’s open. Other major altcoins are also experiencing notable corrections as the market looks for further signals—either before or after the upcoming White House summit—to sustain its rally.
News Background
President Donald Trump is set to host the first-ever cryptocurrency summit at the White House on March 7, bringing together top industry leaders to discuss regulatory policy, stablecoin oversight, and Bitcoin’s role in the US financial system.
According to White House AI and Cryptocurrency Advisor David Sachs, the event will feature prominent crypto founders, CEOs, investors, and members of the President’s Working Group on Digital Assets.
The summit is expected to provide further clarity on upcoming stablecoin legislation, as Sachs has previously emphasized stablecoins’ potential to “extend the dollar’s dominance internationally.” Additionally, discussions around establishing a strategic Bitcoin reserve for the US are gaining traction.
Bitcoin – Sentiment Improves as Trump Names Cryptos in Strategic Reserve
Bitcoin price eased in early Monday after surging over 10% over the weekend, as the crypto market exploded on latest comments from President Trump that five digital assets will be included in US strategic reserves, with bitcoin to be in the hearth of reserve.
Long awaited signals about crypto market from President Trump provided relief as traders’ optimism started to fade that resulted in significant drop in Bitcoin price last week (fell to the lowest in almost four months below 80K).
Partial profit taking following weekend’s surge deflates the price on Monday, but revived positive sentiment suggests that dips would be limited and mark positioning for further upside.
Market focus turns towards a cryptocurrency summit which will be held in the White House on March 7 and expected to further boost positive sentiment.
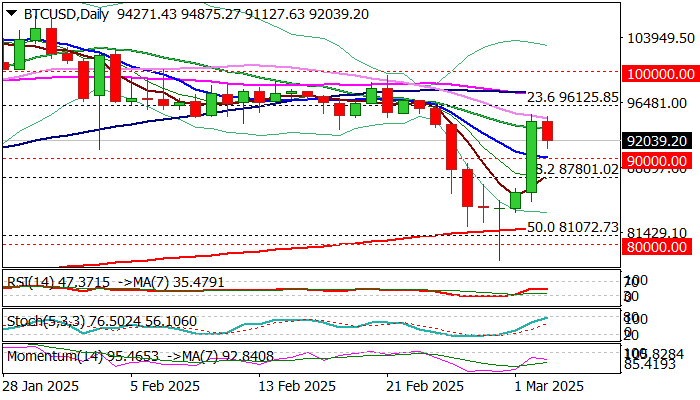
Strong bullish signals have developed on daily chart after Friday’s strong downside rejection which left long-tailed Doji candle and formation of bear-trap pattern under 200DMA and 50% retracement of $52563/$109582 (at $81000 zone), as well as formation of reversal pattern after weekend’s rally retraced over 50% of pullback from new record high.
Also, weekly close above 90K signals a false break below key support zone and keeps the price within larger consolidation range.
However, more action at the upside will be needed to signal that recent weakness (which warned about possible reversal) is over.
Near term action needs to stabilize above $90K, with close above cracked $93849 barrier (50% retracement of $109582/$78115) as minimum requirement to revive near-term bulls and keep focus shifted to the upside.
Res: 93849; 85022; 97562; 99545
Sup: 91054; 90000; 89166; 87801
Eurozone CPI falls to 2.4%, core CPI slows to 2.6%, both above expectations
Eurozone CPI ticked down from 2.5% yoy to 2.4% yoy in February, above expectation of 2.3% yoy. Core CPI (ex-energy, food, alcohol & tobacco), fell from 2.7% yoy to 2.6% yoy, above expectation of 2.5% yoy.
Looking at the main components of inflation, services is expected to have the highest annual rate in February (3.7%, compared with 3.9% in January), followed by food, alcohol & tobacco (2.7%, compared with 2.3% in January), non-energy industrial goods (0.6%, compared with 0.5% in January) and energy (0.2%, compared with 1.9% in January).
UK PMI manufacturing finalized at 46.9, job cuts accelerate
The UK manufacturing sector continued to struggle in February, with PMI Manufacturing finalized at 46.9, down from January’s 48.3, marking a 14-month low. Weak demand and declining confidence among clients have exacerbated the downturn, leading to falling output and new orders.
Rob Dobson, Director at S&P Global Market Intelligence, noted that UK manufacturers are facing an "increasingly difficult trading environment." The combination of subdued demand, rising cost pressures, and uncertainty over future economic conditions is making it harder for firms to sustain growth.
Inflation fears are also rising, particularly due to changes in the national minimum wage and employer NICs announced in the Autumn Budget.
One of the most concerning trends is the acceleration in job losses. The pace of staff reductions in the sector is now at levels not seen since the pandemic-induced slump in mid-2020.
Eurozone PMI manufacturing finalized at 47.6, a 24-mth high
Eurozone manufacturing activity showed signs of stabilization in February, with PMI finalized at 47.6, a 24-month high, up from January’s 46.6. While still in contraction territory, the improvement offers some hope that the sector may be finding its footing.
Among individual countries, Ireland led the rankings at 51.9, marking a 12-month high, while the Netherlands reached the neutral 50.0 mark for the first time in eight months. However, Spain dipped to a 13-month low at 49.7, and Italy, Austria, Germany, and France all remained below 50, despite showing some improvement.
Cyrus de la Rubia, Chief Economist at Hamburg Commercial Bank, emphasized that while the data is encouraging, it’s "too early to call it a recovery". New orders are still falling but at the slowest rate since May 2022, and production is inching closer to stabilization. After nearly three years of recession, there is potential for modest growth in the coming months.
Despite ongoing risks, most businesses remain optimistic about the future, with confidence slightly above its long-term average. This resilience is notable, given the looming threat of US tariffs. Additional positive factors include hopes that Russia’s war in Ukraine could come to an end this year, alongside expectations of greater political stability in Germany following the recent elections.