Sample Category Title
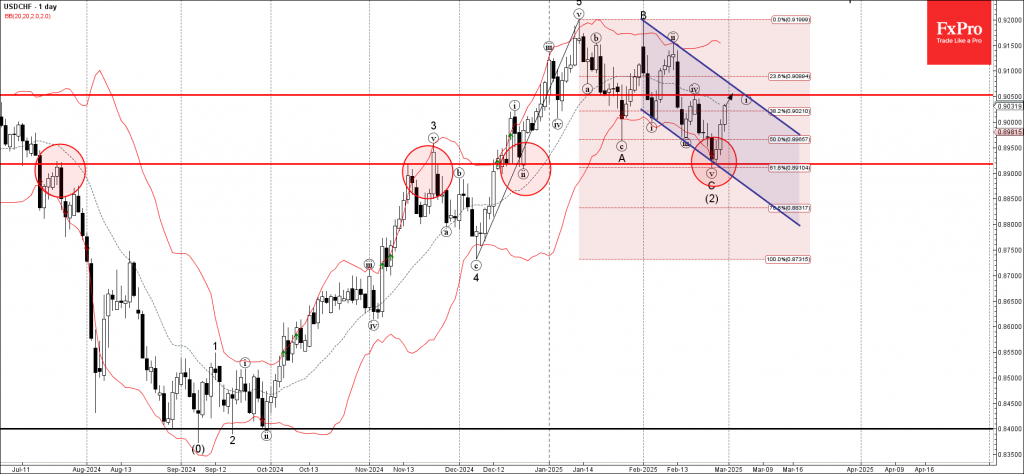
USDCHF Wave Analysis
- USDCHF reversed from support zone
- Likely to rise to resistance level 0.9050
USDCHF currency pair recently reversed from the support zone between the support level 0.8920 (which has been reversing the price from November), support trendline of the daily down channel from January and the lower daily Bollinger Band.
The upward reversal from this support zone created the daily Japanese candlesticks reversal pattern Morning Star which started the active impulse wave (3).
Given the clear daily uptrend, USDCHF can be expected to rise to the next resistance level 0.9050 (top of the previous minor correction iv).
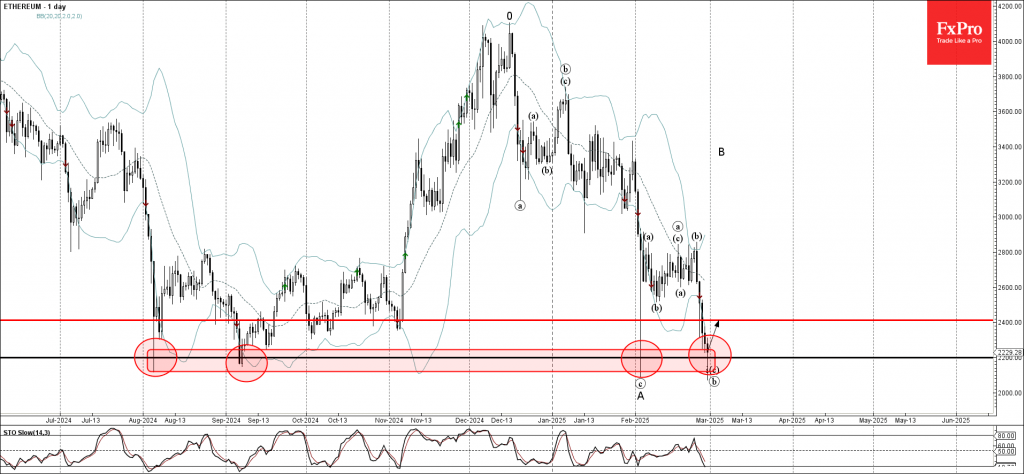
Ethereum Wave Analysis
- Ethereum reversed from support zone
- Likely to rise to resistance level 2400.00
Ethereum recently reversed from the support zone between the major long-term support level 2200.00 (which has been reversing the price from August) and the lower daily Bollinger Band.
The upward reversal from this support zone is currently forming the daily Japanese candlesticks reversal pattern Hammer – a strong buy signal for Ethereum.
Given the strength of the nearby support level 2200.00 and the oversold daily Stochastic, Ethereum can be expected to rise to the next resistance level 2400.00.
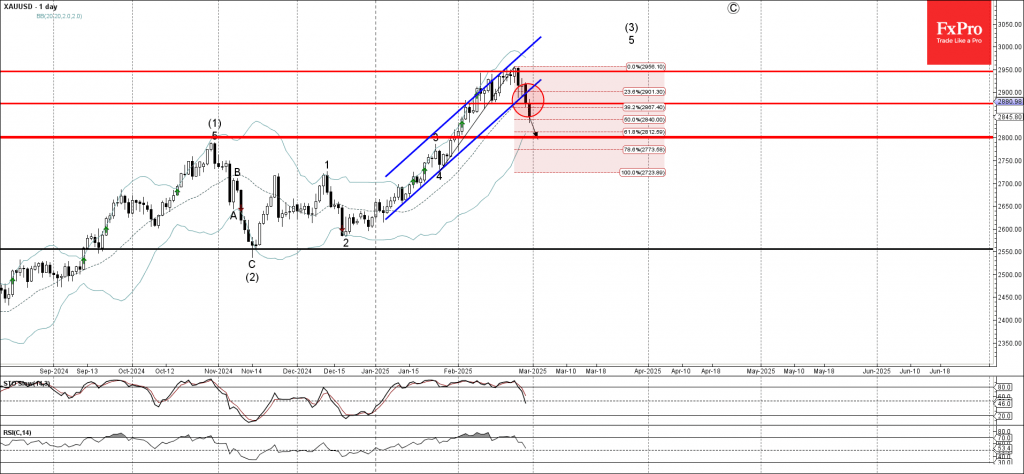
Gold Wave Analysis
- Gold broke the support zone
- Likely to fall support level 2800.00
Gold recently broke the support zone between the key support level 2875.00 (which has been reversing the price from the start of February), the support trendline of the daily up channel from January and the 38.2% Fibonacci correction of the upward impulse from January.
The breakout of this support zone strengthened the bearish pressure on gold accelerating the active downward correction.
Gold can be expected to fall to the next support level 2800.00 (a former multi-month high from last October and the 61.8% Fibonacci correction of the upward impulse from January).
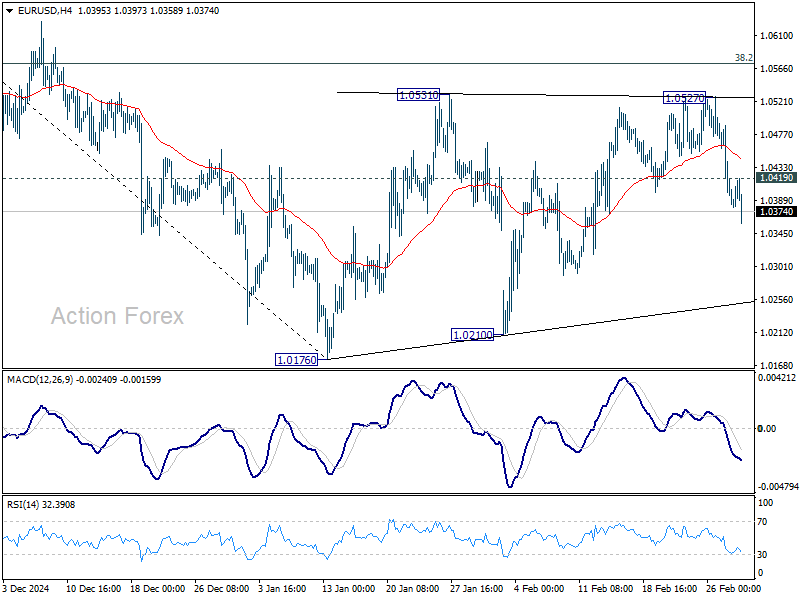
EUR/USD Weekly Outlook
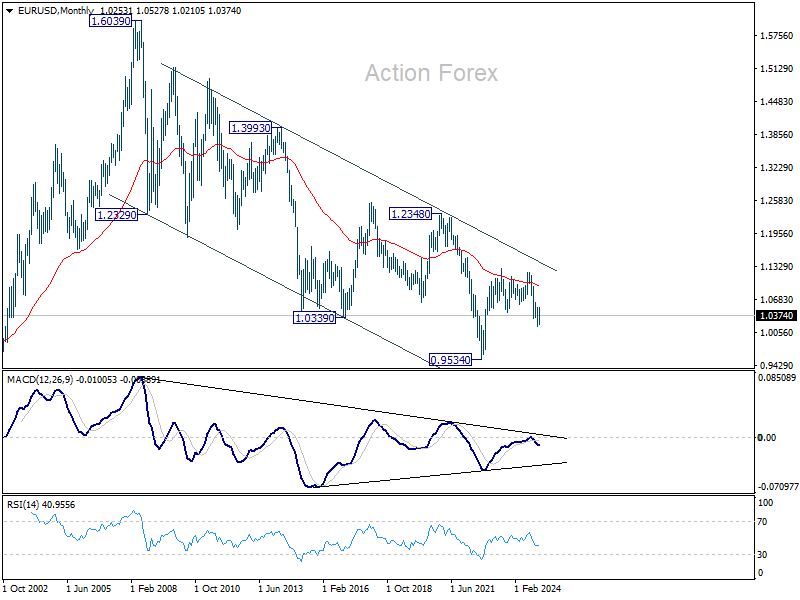
EUR/USD reversed after edging higher to 1.0527 last week, and the development suggests that consolidation from from 1.0176 has already completed. Initial bias stays on the downside this week for retesting 1.0176/0210 support zone first. Firm break there will resume whole fall from 1.1213, and carry larger bearish implications. On the upside, above 1.0419 minor resistance will turn intraday bias neutral. But outlook will stay bearish as long as 38.2% retracement of 1.1213 to 1.0176 at 1.0572 holds.
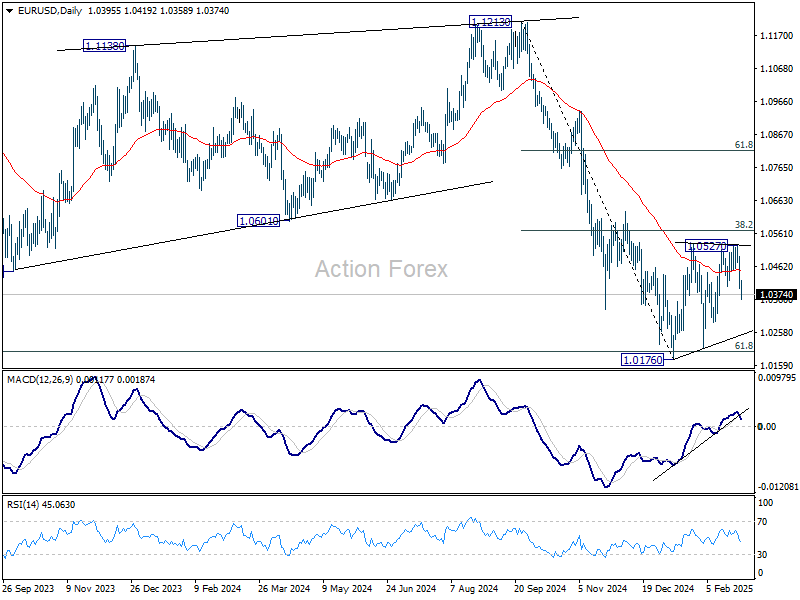
In the bigger picture, immediate focus is on 61.8 retracement of 0.9534 (2022 low) to 1.1274 (2024 high) at 1.0199. Sustained break there will solidify the case of medium term bearish trend reversal, and pave the way back to 0.9534. However, reversal from 1.0199 will argue that price actions from 1.1274 are merely a corrective pattern, and has already completed.
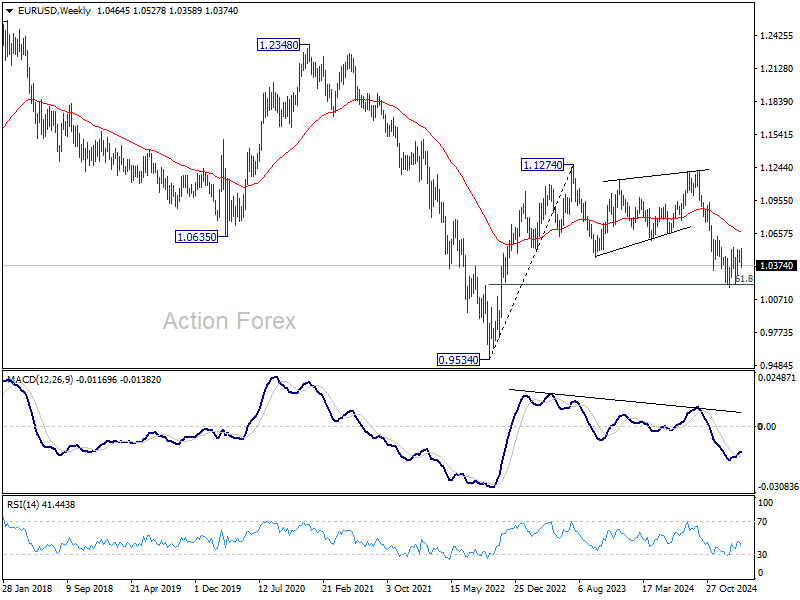
In the long term picture, down trend from 1.6039 remains in force with EUR/USD staying well inside falling channel, and upside of rebound capped by 55 M EMA (now at 1.0929). Consolidation from 0.9534 could extend further and another rising leg might be seem. But as long as 1.1274 resistance holds, eventual downside breakout would be mildly in favor.
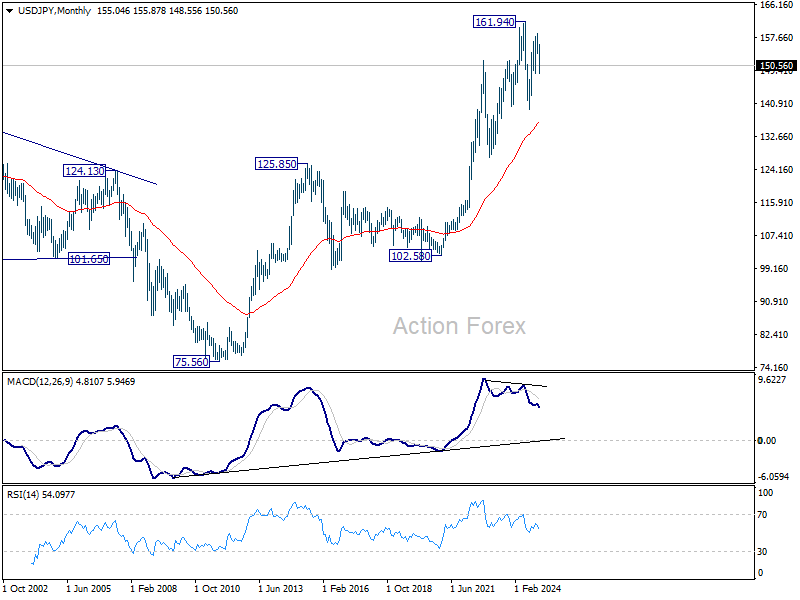
USD/JPY Weekly Outlook
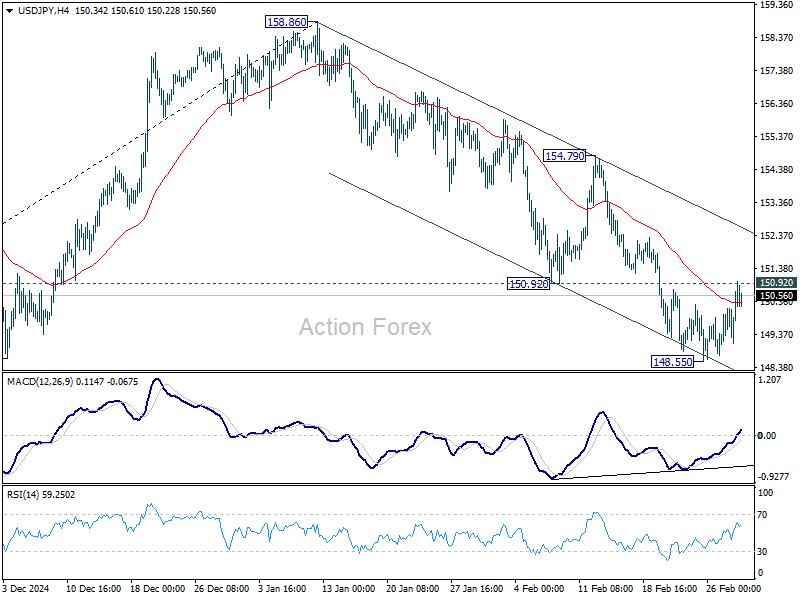
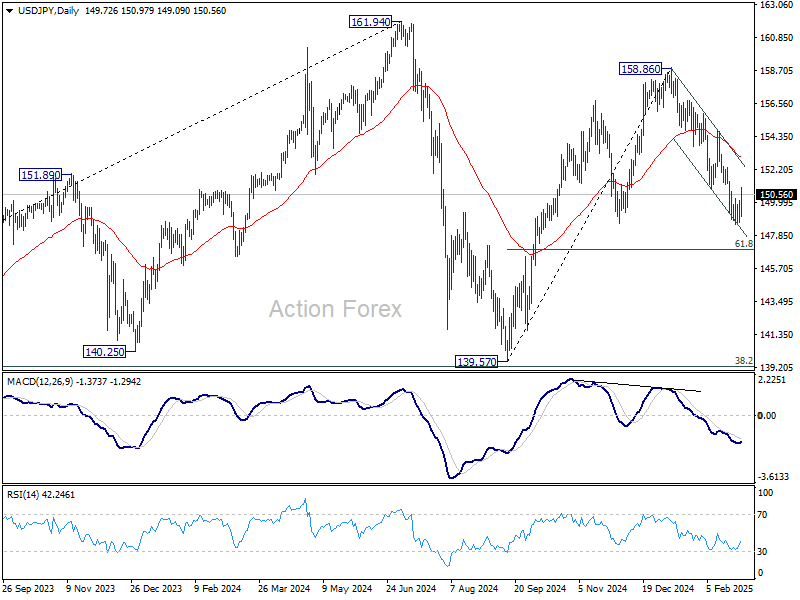
USD/JPY's fall from 158.86 continued last week but recovered after hitting 148.55. Initial bias remains neutral this week first. This decline is seen as the third leg of the corrective pattern from 161.94 high. Break of 148.55 will target 61.8% retracement of 139.57 to 158.86 at 146.32 next. On the upside, however, break of 150.92 will indicate short term bottoming and bring stronger rebound.
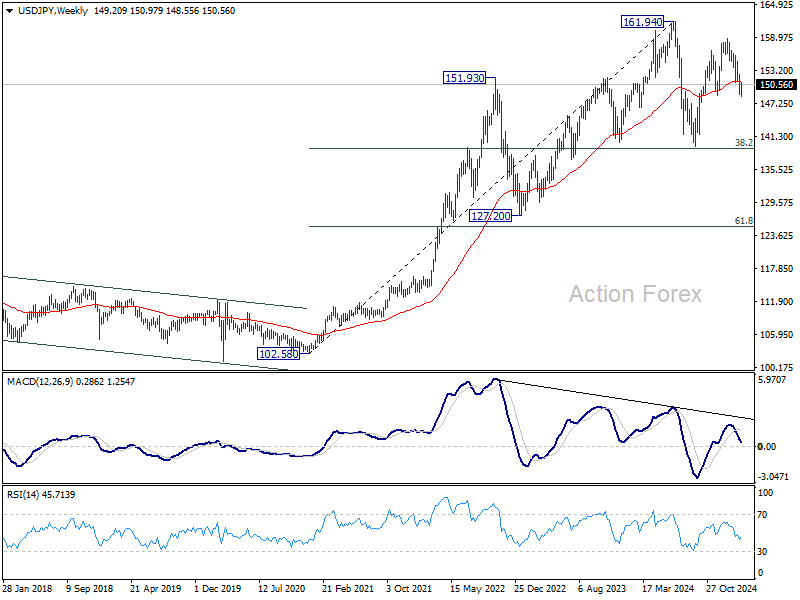
In the bigger picture, price actions from 161.94 are seen as a corrective pattern to rise from 102.58 (2021 low). In case of another fall, strong support should be seen from 38.2% retracement of 102.58 to 161.94 at 139.26 to bring rebound. However, sustained break of 139.26 would open up deeper medium term decline to 61.8% retracement at 125.25.
In the long term picture, it's still early to conclude that up trend from 75.56 (2011 low) has completed. A medium term corrective phase should have commenced, with risk of deep correction towards 55 M EMA (now at 136.50).
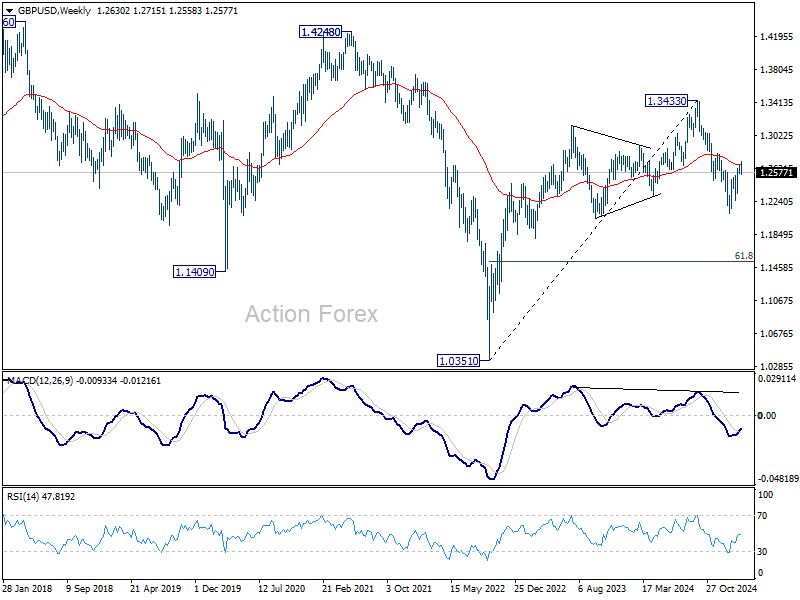
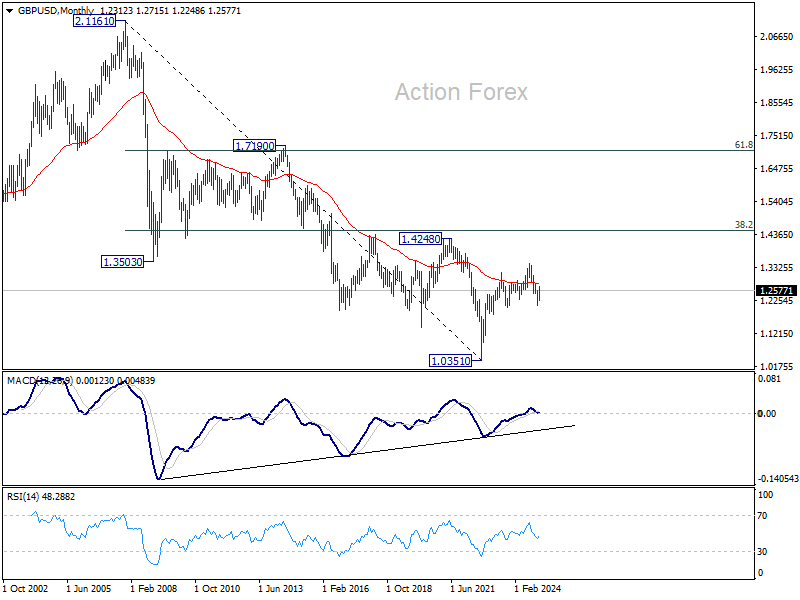
GBP/USD Weekly Outlook
GBP/USD edged higher to 1.2715 last week but subsequent retreat suggests short term topping, on bearish divergence condition in 4H MACD. Initial bias remains mildly on the downside this week for near term rising channel support (now at 1.2427). Sustained break there will indicate that corrective rebound from 1.2099 has already completed. Nevertheless, above 1.2715 will resume the rebound to 1.2810 resistance next.
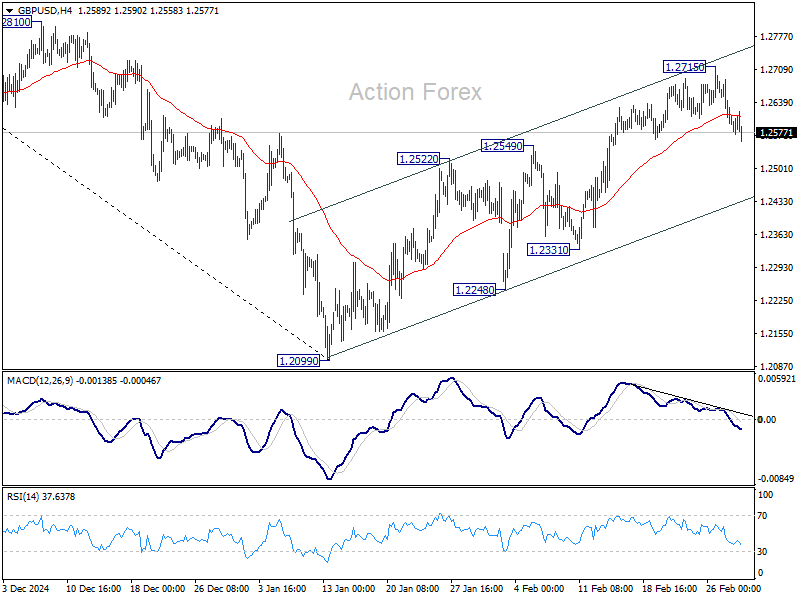
In the bigger picture, rise from 1.0351 (2022 low) should have already completed at 1.3433 (2024 high), and the trend has reversed. Further fall is now expected as long as 1.2810 resistance holds. Deeper decline should be seen to 61.8% retracement of 1.0351 to 1.3433 at 1.1528, even as a corrective move. However, firm break of 1.2810 will dampen this bearish view and bring retest of 1.3433 high instead.
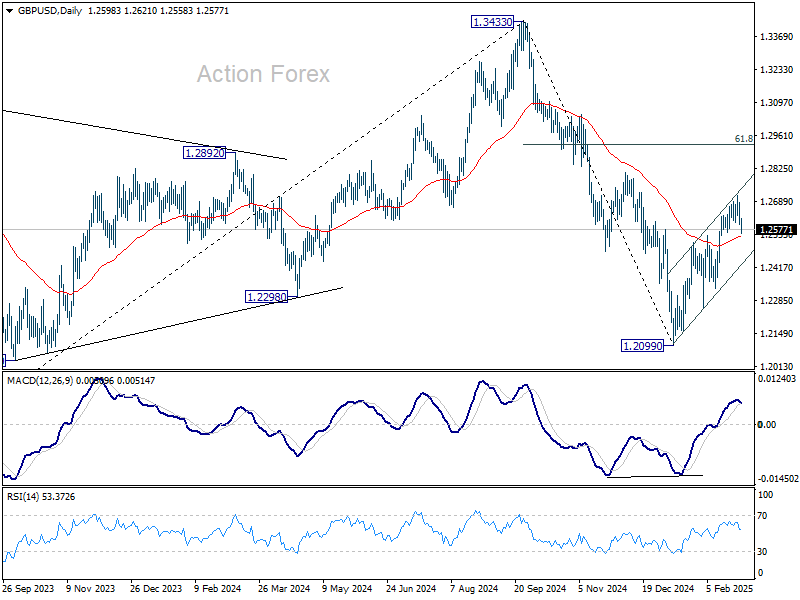
In the long term picture, price actions from 1.0351 (2022 low) are seen as a corrective pattern to the long term down trend from 2.1161 (2007 high) only. Outlook will be neutral at best as long as 1.4248 structural resistance holds, even in case of strong rebound.
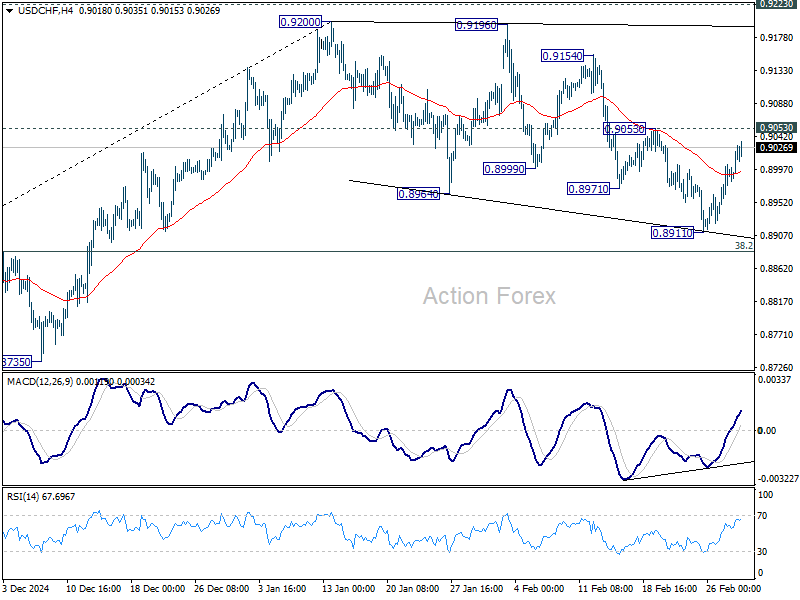
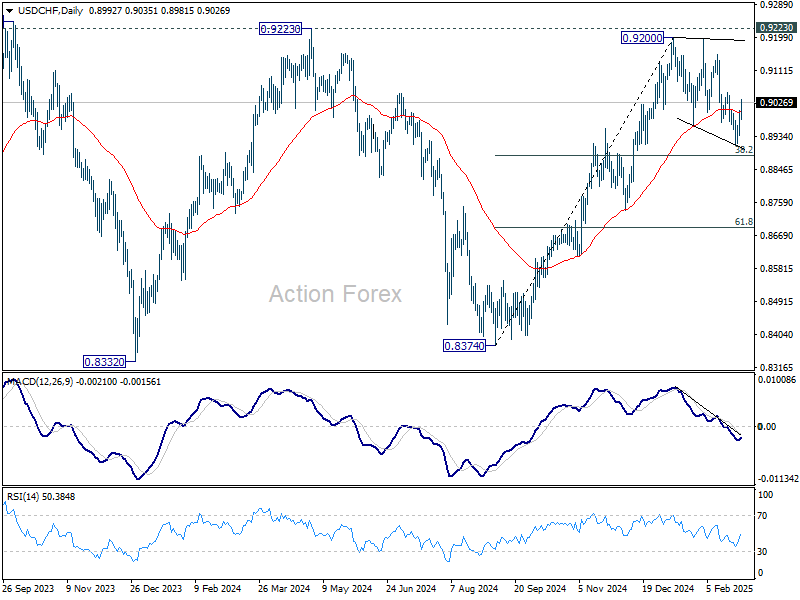
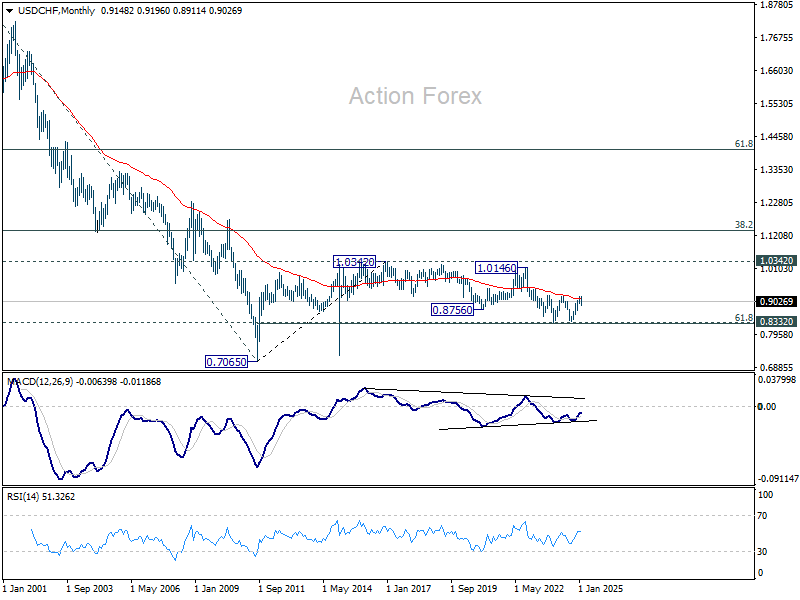
USD/CHF Weekly Outlook
USD/CHF rebounded strongly last week but upside is capped below 0.9053 resistance. Initial bias stays neutral this week first. On the upside, firm break of 0.9053 will suggest that corrective pattern from 0.9200 has already completed at 0.8911. Further rally should then be seen to retest 0.9200 resistance. In case of another fall, downside should be contained by 38.2% retracement of 0.8374 to 0.9200 at 0.8884 to bring rebound.
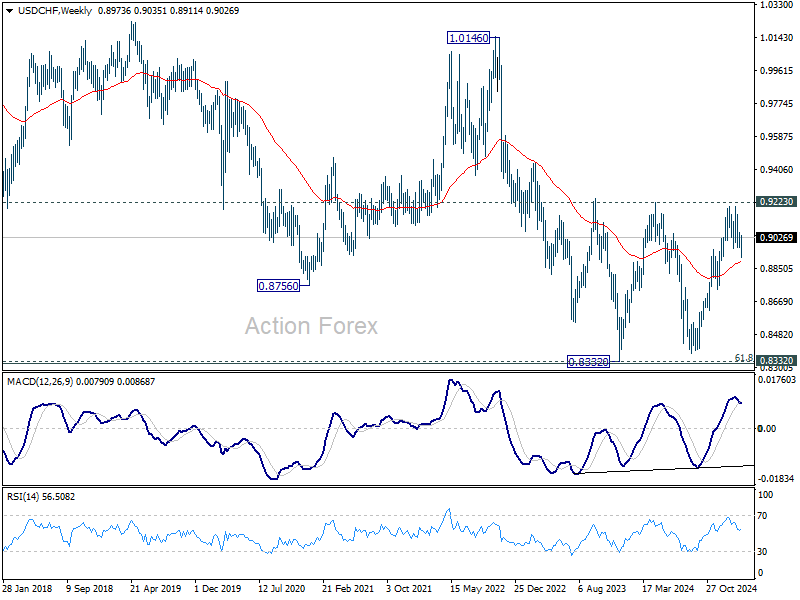
In the bigger picture, decisive break of 0.9223 resistance will argue that whole down trend from 1.0342 (2017 high) has completed with three waves down to 0.8332 (2023 low). Outlook will be turned bullish for 1.0146 resistance next. Nevertheless, rejection by 0.9223 will retain medium term bearishness for another decline through 0.8332 at a later stage.
In the long term picture, price action from 0.7065 (2011 low ) are seen as a corrective pattern to the multi-decade down trend from 1.8305 (2000 high). Fall from 1.0342 (2016 high) is seen as the second leg. Sustained break of 55 M EMA (now at 0.9131) will indicate that the third leg has already started. However, rejection by 55 M EMA again, followed by break of 61.8% retracement of 0.7065 to 1.0342 at 0.8317, will pave the way back to 0.7065.
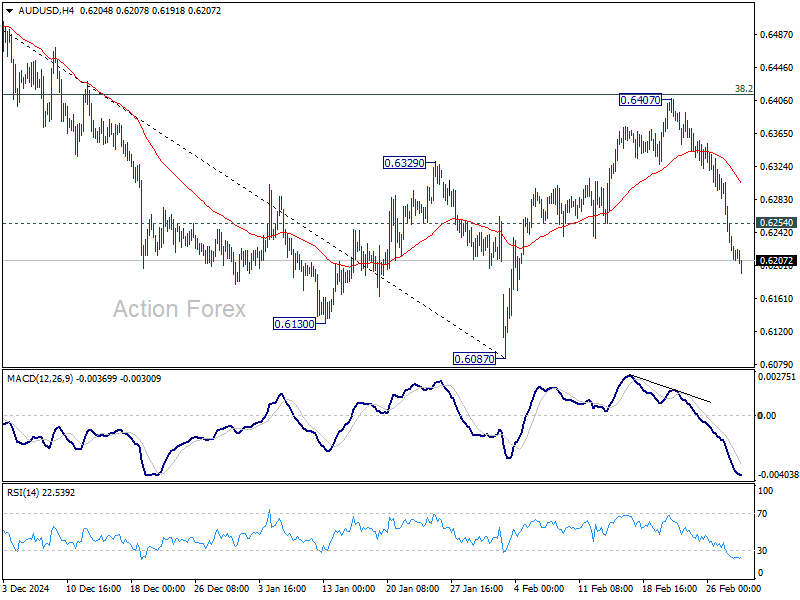
AUD/USD Weekly Report
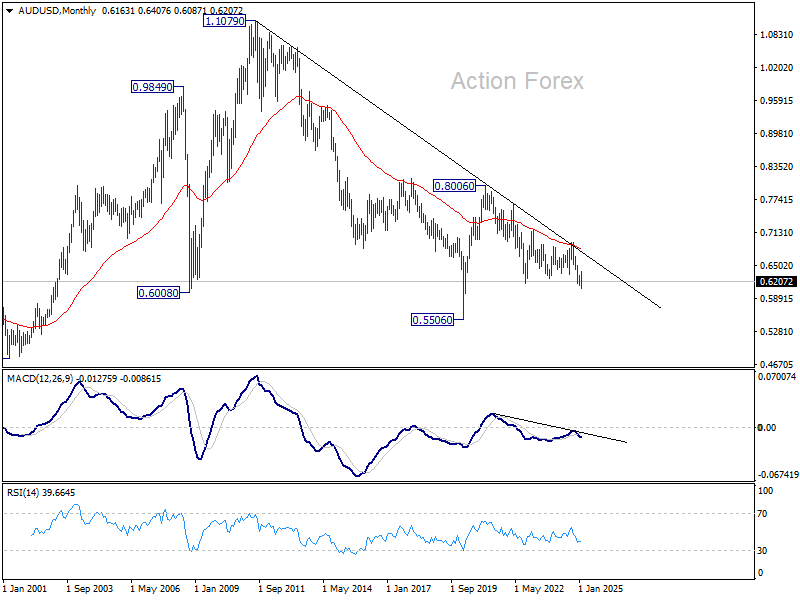
AUD/USD's extended fall last week suggests that corrective rebound from 0.6087 has completed at 0.6407, ahead of 38.2% retracement of 0.6941 to 0.6087 at 0.6413. Initial bias stays on the downside this week for retesting 0.6087 low. Firm break there will resume whole decline from 0.6941. On the upside, above 0.6254 minor resistance will turn intraday bias neutral first.
In the bigger picture, fall from 0.6941 (2024 high) is seen as part of the down trend from 0.8006 (2021 high). Next medium term target is 61.8% projection of 0.8006 to 0.6169 from 0.6941 at 0.5806. In any case, outlook will stay bearish as long as 55 W EMA (now at 0.6494) holds.
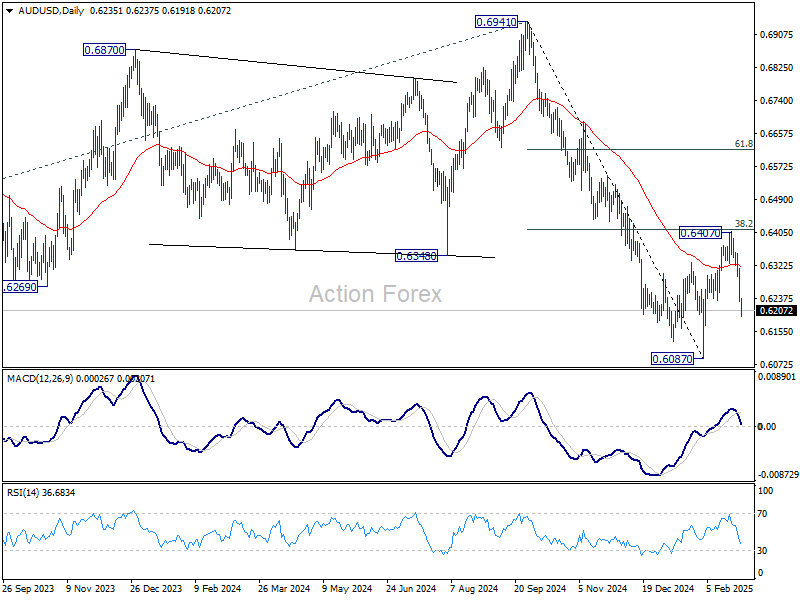
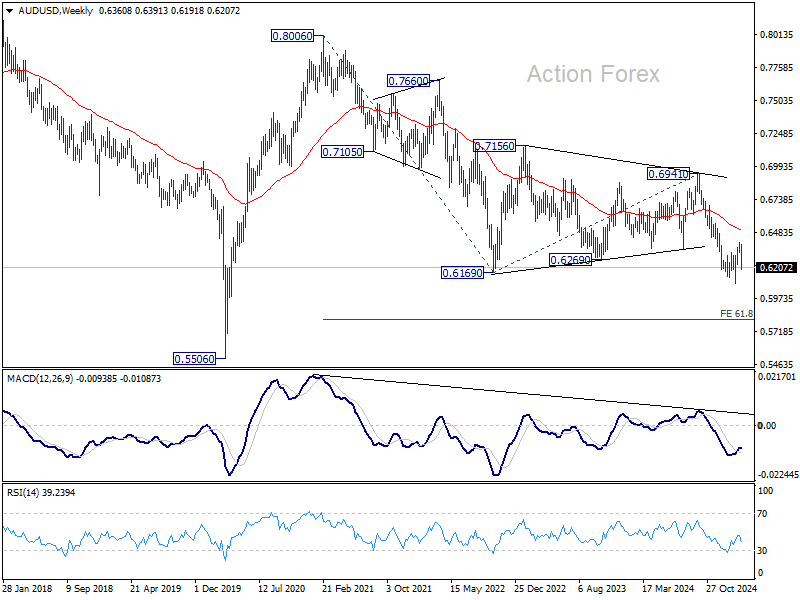
In the long term picture, prior rejection by 55 M EMA (now at 0.6823) is taken as a bearish signal. But for now, fall from 0.8006 is still seen as the second leg of the corrective pattern from 0.5506 long term bottom (2020 low). Hence, in case of deeper fall, strong support should emerge above 0.5506 to contain downside to bring reversal. However, this view is subject to adjustment if current decline accelerates further.
USD/CAD Weekly Outlook
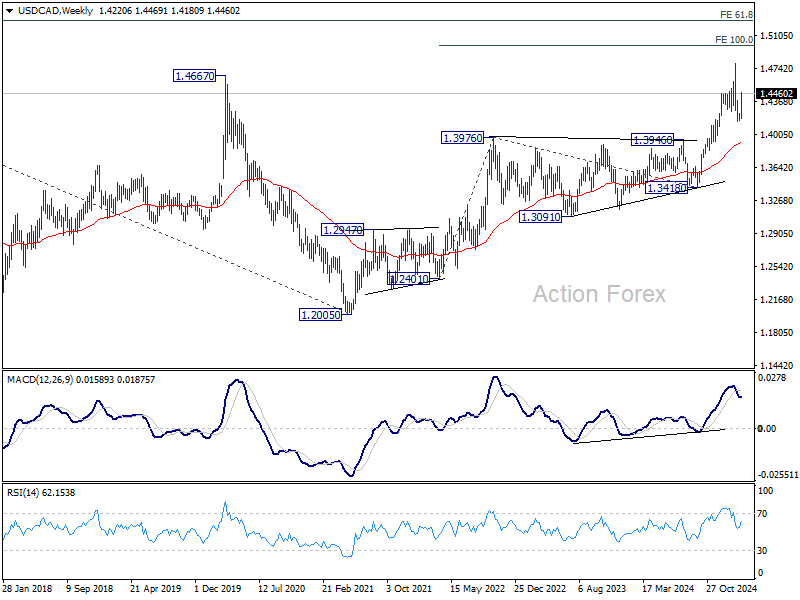
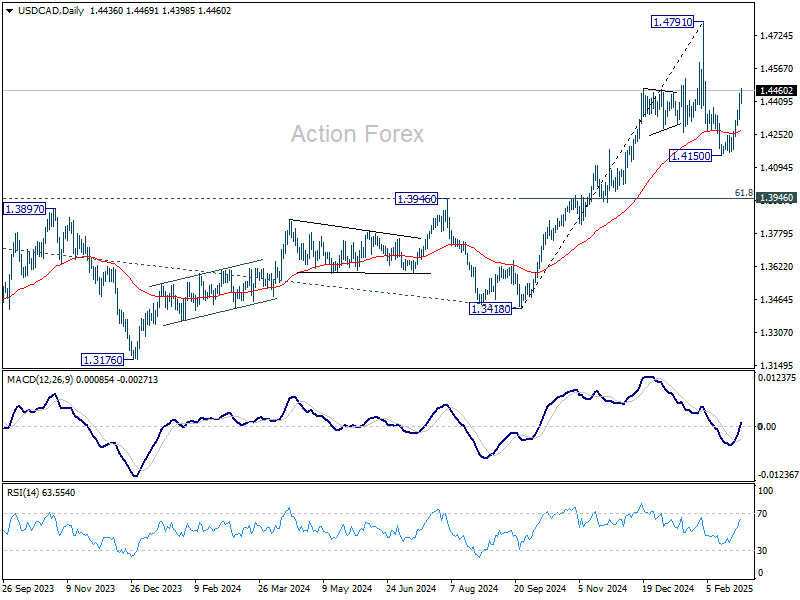
USD/CAD's strong rally last week suggests that corrective pull back from 1.4791 has already completed at 1.4150. Initial bias stays on the upside this week for retesting 1.4791. Strong resistance might be seen there to limit upside on first attempt. But decisive break there will confirm resumption of larger up trend. On the downside, below 1.4398 minor support will turn intraday bias neutral again first.
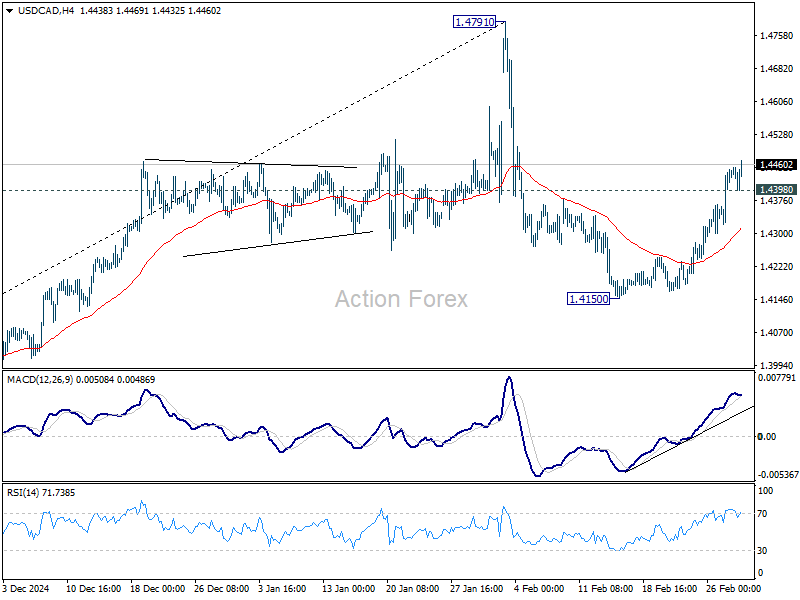
In the bigger picture, long term up trend is tentatively seen as resuming with prior breach of 1.4667/89 key resistance zone (2020/2015 highs). Next target is 100% projection of 1.2401 to 1.3976 from 1.3418 at 1.4993. This will remain the favored case as long as 1.3976 resistance turned support holds (2022 high), even in case of deep pullback.
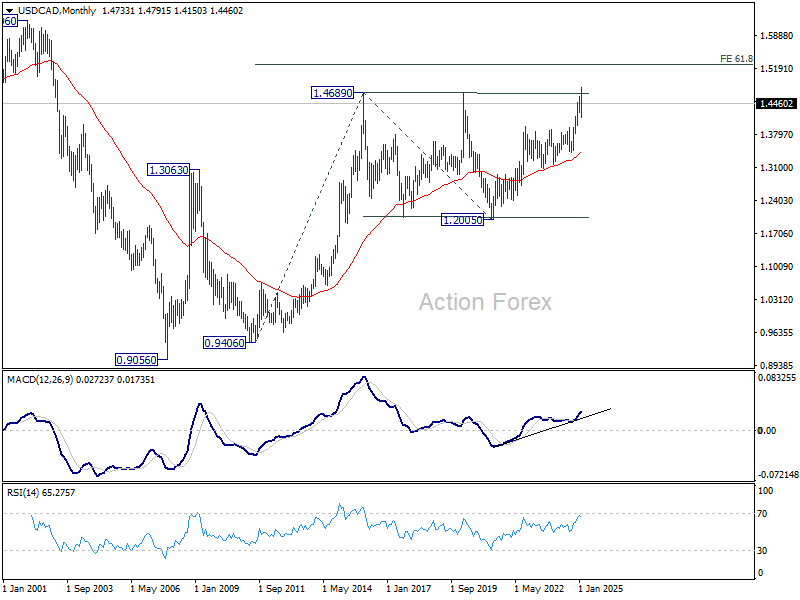
In the longer term picture, up trend from 0.9506 (2007 low) is in progress and possibly resuming. Next target is 61.8% projections of 0.9406 to 1.4689 from 1.2005 at 1.5270. While rejection by 1.4689 will delay the bullish case, further rally will remain in favor as long as 55 M EMA (1.3430) holds.