Sample Category Title
GBP/USD Weakening After Short Recovery
GBP/USD is weakening back after reaching 1.3877 and starts distancing hourly resistance at 1.3945 (19/01/2018 high). The upward trend of November 2017 starts weakening. Hourly support is given 1.3678 (12/01/2018 low). The technical structure suggests short-term decrease.
The long-term technical pattern is reversing. The Brexit vote had paved the way for further decline but the pair is moving to 2016 highs. Long-term support and resistance are given at 1.1841 (07/10/2017 low) and 1.5018 (24/06/2016 high).
EUR/USD Slight Increase
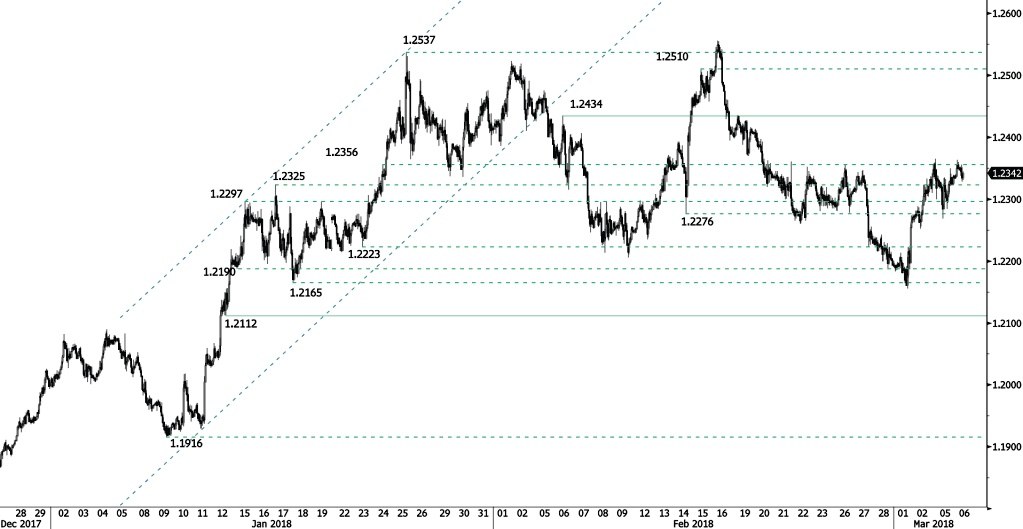
EUR/USD recovered from 1.2155 low, stabilized at the1.2340 range. The pair is currently contained between hourly support and resistance at 1.2112 (12/01/2018 low) and 1.2434 (06/02/2018 high). The technical structure suggests further sideway moves.
In the longer term, the momentum is turning largely positive. We favor a continued bullish bias. Key resistance is holding at 1.2886 (15/10/2014 high) while strong support lies at 1.1554 (08/11/2017 low).

Calm Before Major Events
Smoke clears – smoke ahead
Markets have settled after Monday’s excitement about Germany’s coalition, Italian populists’ victory and US President Trump’s presumed trade war. The VIX volatility index fell to 18 from 26. So here come the next events: China’s National People’s Congress started on 5 March, the European Central Bank meets on 8 March, Italy’s coalition talks have started and US non-farm employment data for February will report on Friday the 9th.
Italy is headed for a hung parliament. We could see unwinding of prior reforms, but probably not a strong enough bloc to pass structural reforms. EUR/USD options are biased toward the downside. The Bank of Japan says it will not abandon negative interest rates. In the US, Federal Reserve Governor Lael Brainard will speak publicly today: her comments could indicate a hawkish bias, which would give the USD a limited bump.
Reserve Bank of Australia monetary policy unchanged
The Reserve Bank of Australia held interest rates this morning at 1.50%, unchanged since August 2016, and the 17th meeting at this level. Weak economic data suggest no interest hikes in 2018. Unemployment is approaching a full-employment minimum of 5.0%, yet wage growth is low and neutralized by inflation. December’s trade balance drastically decreased, from close-to-zero to AUD -1’358 billion, its worst performance since October 2016. Equities were heading higher, the S&P/ASX 200 up 1.14% at 5’962 while Australian 2-year and 10-year Treasury yields remain at 2% and 2.82%.
Technical Outlook: WTI OIL – Recovery Probes Through Cracked Fibo Barrier At $62.65, Crude Inventories Reports In Focus
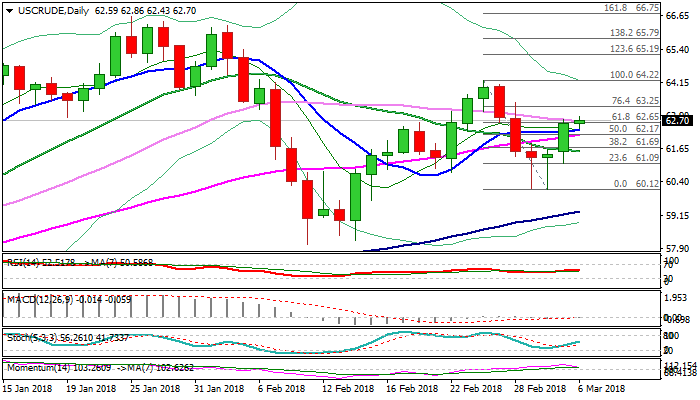
WTI oil holds within narrow consolidation under new recovery high at $62.86 on Tuesday, taking a breather after strong advance previous day.
Confirmation of reversal came on Monday's strong rally which left a double-bottom on daily chart (01/02 Mar spike lows).
Fresh upside attempts today probe again above cracked pivotal barrier at $62.65 (Fibo 61.8% of $64.22/$60.12 bear-leg / 30SMA) break of which is needed for fresh bullish signal.
Close above $62.45 would spark fresh recovery extension towards $63.25 (Fibo 76.4%) and next key barrier – daily cloud top at $63.49.
Daily techs improved and maintain firm bullish momentum while MA's turned to bullish setup, favoring further upside.
Oil prices were inflated on Monday on speculations of fresh fall in oil inventories and comments from International Energy Agency about expectations that demand for oil is expected to grow in coming years while output from major oil producers is expected to rise at a slower pace.
Oil price entered consolidation mode on Tuesday, awaiting releases of crude stocks data. API report is due late today, while EIA weekly crude stocks report will be released on Wednesday and both reports expected to generate fresh signals.
Today's action is underpinned by rising 10SMA ($62.34), with converged daily Tenkan-sen / Kijun-sen lines ($62.17), in attempts to form bull-cross, reinforce support.
Res: 62.86, 63.25, 63.49, 64.22
Sup: 62.34, 62.17, 61.69, 61.09
Gold Analysis: Squeezed In Narrow Range
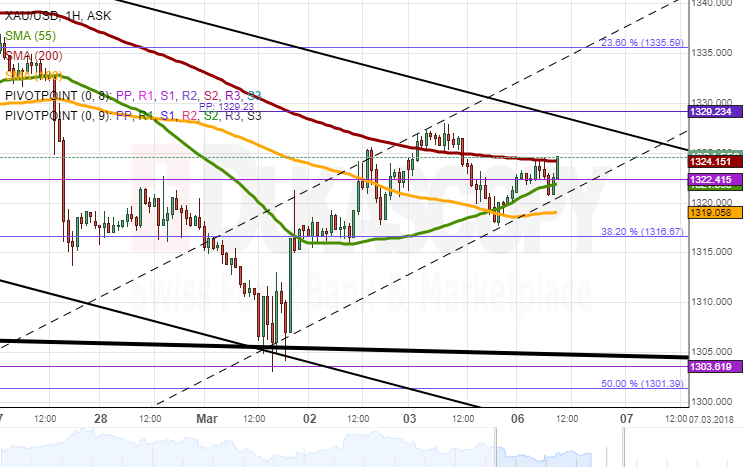
Despite surpassing the 200-hour SMA early on Monday, the yellow metal returned below this line several hours later to test the 55– and 100-hour SMAs located circa 1,318.00. The pair was subsequently moving along the former, thus trading in a narrow range between this line and the 200-hour SMA by Tuesday morning.
Given that technical indicators are strongly bearish, this sentiment is expected to prevail in the market and thus push the rate for a test of the 38.20% Fibo retracement at 1,316.70.
Meanwhile, it is still possible that the pair still tries to test the upper boundary of the prevailing three-week channel down. In case the 200-hour is breached, gains should be capped near the weekly PP at 1,320.00.
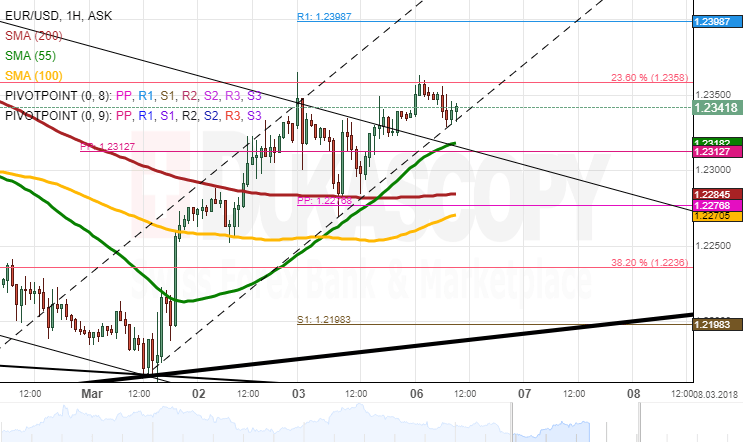
EURUSD Analysis: Weakens Near 1.2350
As previously expected, the combined support of the 55– and 200-hour SMAs and the weekly PP provided un unbreakable barrier circa 1.2275. This allowed bulls to take over the market and push the rate up to the 23.60% Fibo retracement at 1.2358. The Euro, however, remained reluctant to surpass the existing two-week resistance near 1.2350.
As apparent on the chart, the short-term ascending channel (drawn with dashed lines) has lost its bullish momentum.This suggests that a breakout south should occur during the following hours, thus sending the pair lower towards the 1.2275 area.
Given that the 55-hour SMA and the monthly PP are likewise located nearby, losses could be limited by near 1.23. From the upside, the weekly R1 at 1.24 is unlikely to surrender today.
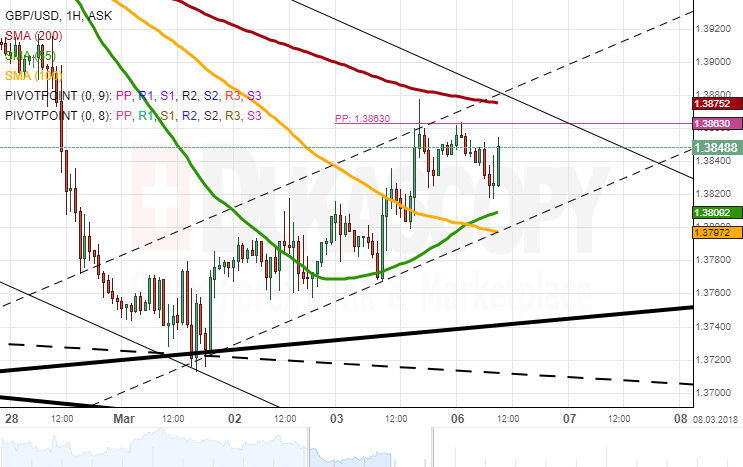
GBPUSD Analysis: Bearish Correction Could Occur
The Sterling managed to advance 85 pips against the US Dollar during the first past on Monday. Further upside momentum was disrupted by the combined resistance of the weekly and monthly PPs circa 1.3860.
The inability of bears to take advantage of this situation resulted in a slight period of consolidation between 1.3860 and 1.3830. Given that the northern barrier is likewise guarded by the 200-hour SMA, bulls are unlikely to gather enough momentum for a breakout. Thus, that the pair could edge lower during the following hours until the 55– and 100-hour SMAs limit a further decline below 1.38.
Meanwhile, the medium-term pattern suggests that the Sterling is likely to appreciate this week; thus, the 1.3860 should eventually be breached to allow for a surge up to 1.3950.
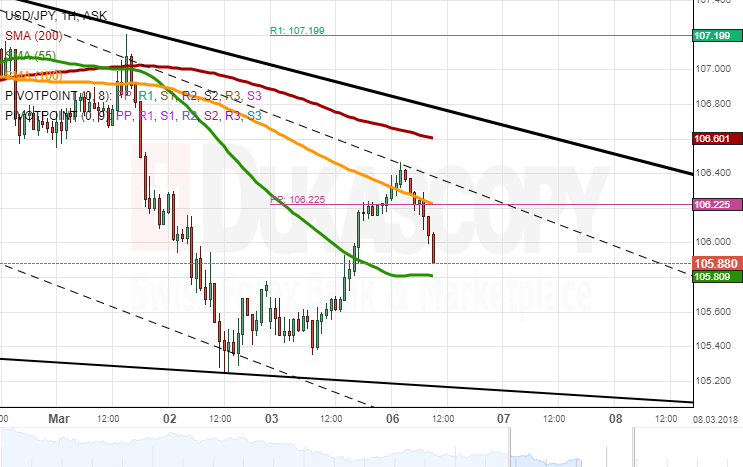
USDJPY Analysis: Likely To decline
Upside risks prevailed in the market on Monday, thus allowing the US Dollar to advance by 1.0% against the Yen. The pair managed to surpass the 55-hour SMA along the way, but was hindered by the weekly PP and the 100-hour moving average circa 106.20—the level where it was located on Tuesday morning.
It seems that this strong daily surge has exhausted the strength of bears. This could allow for the prevalence of the bearish sentiment in this session. This scenario is likewise confirmed by strongly bearish technical indicators.
The nearest resistance is set by the 55-hour SMA circa 105.80, while a more probable downside target could be the 2017 low of 105.35. Conversely, a move above the 107.00 is unlikely today.
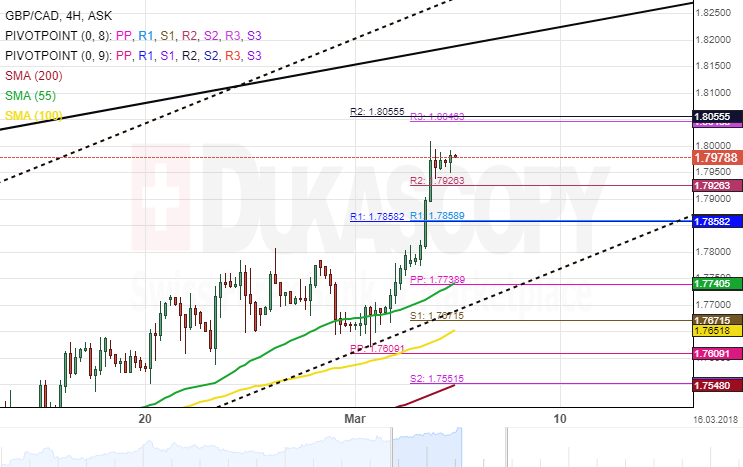
GBP/CAD 4H Chart: Two Patterns Prevail
The Pound Sterling has been trading in a channel up against its Canadian counterpart since September 2017. The currency pair has formed a new junior pattern during this period and can be observed on the chart.
The exchange rate is moving closer to the upper boundary of the junior channel and could be for a breakout. However, this movement is likely to encounter a resistance cluster set by the weekly R3 and the monthly R2 near 1.8055.
Technical indicators suggest that the overall market sentiment is bullish and it is likely to continue until it reaches the aforementioned resistance cluster.
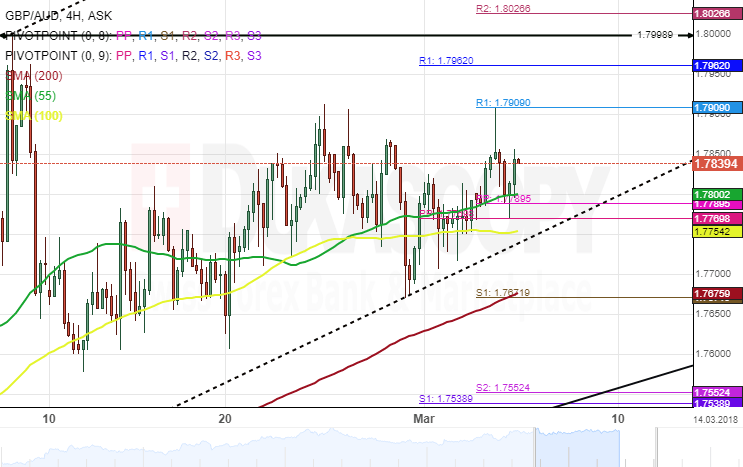
GBP/AUD 4H Chart: Bullish Patterns Dominate
The British Pound has been trading in an eight-month ascending channel against the Australian Dollar. The GBP/AUD pair bounced off the lower boundary of a dominant channel on September 8, 2017, and has since rallied against the Aussie.
Given that the currency exchange rate is moving towards the border of a junior pattern, a breakout is likely to occur during the following trading sessions.
Furthermore, the 55-hour simple moving average with the combination of the monthly and weekly PP near 1.7769 was providing support for the currency pair. If this support cluster holds, the rate could continue moving north for a test of the weekly R1 at 1.7962.