Sample Category Title
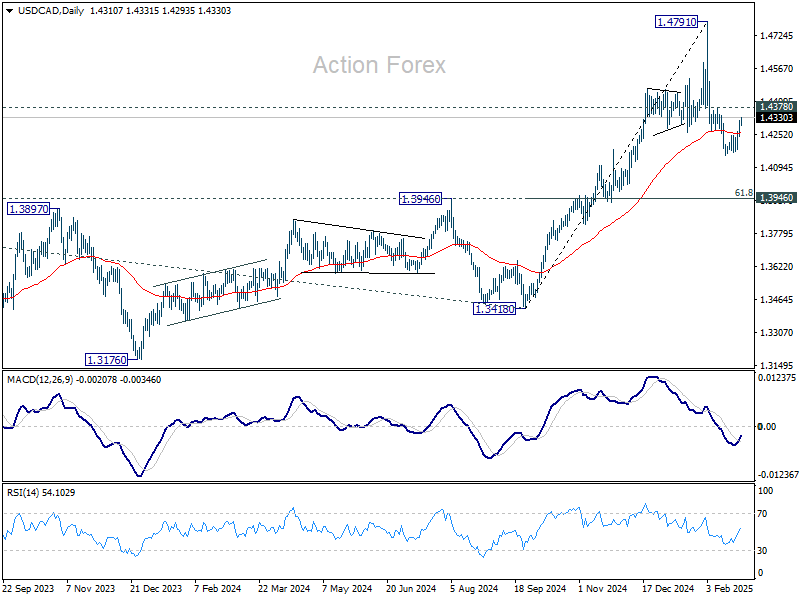
USD/CAD Daily Outlook
Daily Pivots: (S1) 1.4266; (P) 1.4293; (R1) 1.4345; More...
Intraday bias in USD/CAD stays neutral with focus turning to 1.4378 resistance as rebound from 1.4150 extends. Firm break there will suggest that the correction from 1.4791 has completed, and turn bias back to the upside for retesting 1.4791. On the downside, break of 1.4150 will target 1.3946 cluster support (61.8% retracement of 1.3418 to 1.4791 at 1.3942).
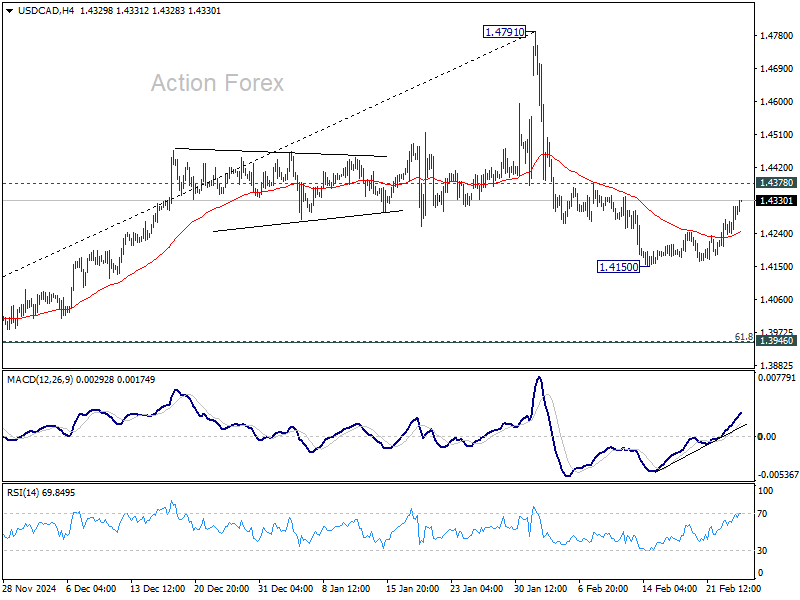
In the bigger picture, long term up trend is tentatively seen as resuming with prior breach of 1.4667/89 key resistance zone (2020/2015 highs). Next target is 100% projection of 1.2401 to 1.3976 from 1.3418 at 1.4993. This will remain the favored case as long as 1.3976 resistance turned support holds (2022 high), even in case of deep pullback.
Dollar Stuck Between Falling Yields and Risk Aversion, Struggles for Direction
Dollar remains stuck in a tug-of-war of conflicting forces. On one side, extended decline in US Treasury yields is pressuring the greenback, while on the other, risk aversion is offering some support.
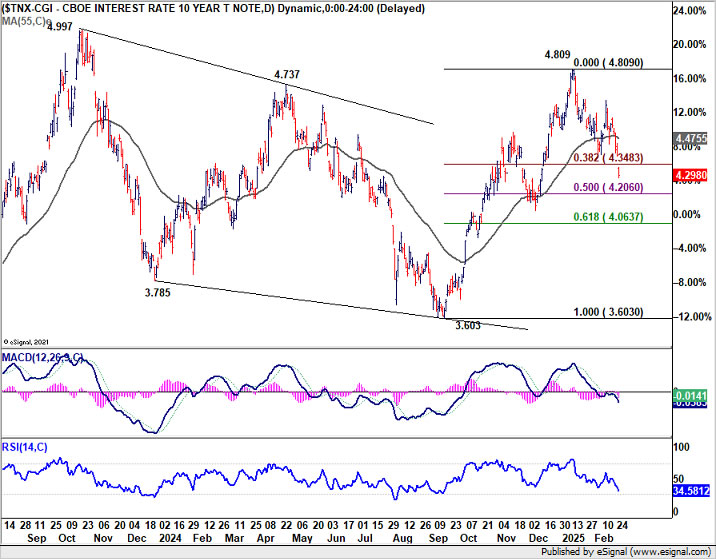
10-year Treasury yield fell to its lowest level since December, looks on track to test the next Fibonacci support at 4.2%. Bond markets appear to be betting on a downturn, reflecting growing fears that the US economy could be headed for a rough landing as the administration's policies weigh on consumer confidence.
Meanwhile, risk aversion is pressuring US stock markets, indirectly giving Dollar some support as a safe-haven asset. S&P 500 closed lower for the fourth straight session, while NASDAQ shed -1% following weak consumer confidence data. The uncertainty surrounding tariffs, fiscal policy, and economic growth is amplifying recession fears, leading investors to seek refuge in bonds and defensive assets.
The key issue is that both declining yields and falling equities stem from the same core concerns—whether the US economy is losing steam faster than anticipated. Confidence in Washington's economic policies is rapidly deteriorating. This dual pressure on stocks and yields is keeping markets on edge, with Dollar stuck between a weakening growth outlook and flight-to-safety flows.
Adding to the market’s cautious stance is Nvidia’s highly anticipated earnings report, set to be released Wednesday after the bell. Given the company’s pivotal role in the AI-driven stock market rally, its results could have significant implications for risk sentiment for the near term.
In the currency markets, European majors are leading the session, with Swiss Franc being the strongest, followed by Euro and Sterling. On the weaker side, commodity currencies are underperforming, with Loonie being the worst, followed by Aussie and Kiwi.
Technically, the case of near term reversal in 10-year yield is building up after strong break of 38.2% retracement of 3.603 to 4.809 at 4.348. Further break of 50% retracement at 4.206 will argue that fall from 4.809 is indeed another leg inside the medium term corrective pattern from 4.997. That would set up deeper decline to 61.8% retracement at 4.063 and below.
In Asia, at the time of writing, Nikkei is down -0.72%. Hong Kong HSI is up 3.03%. China Shanghai SSE is up 0.64%. Singapore Strait Times is down -0.18%. Japan 10-year JGB yield is down -0.0086 at 1.368. Overnight, DOW rose 0.37%. S&P 500 fell -0.47%. NASDAQ fell -1.35%. 10-year yield fell -0.095 to 4.298.
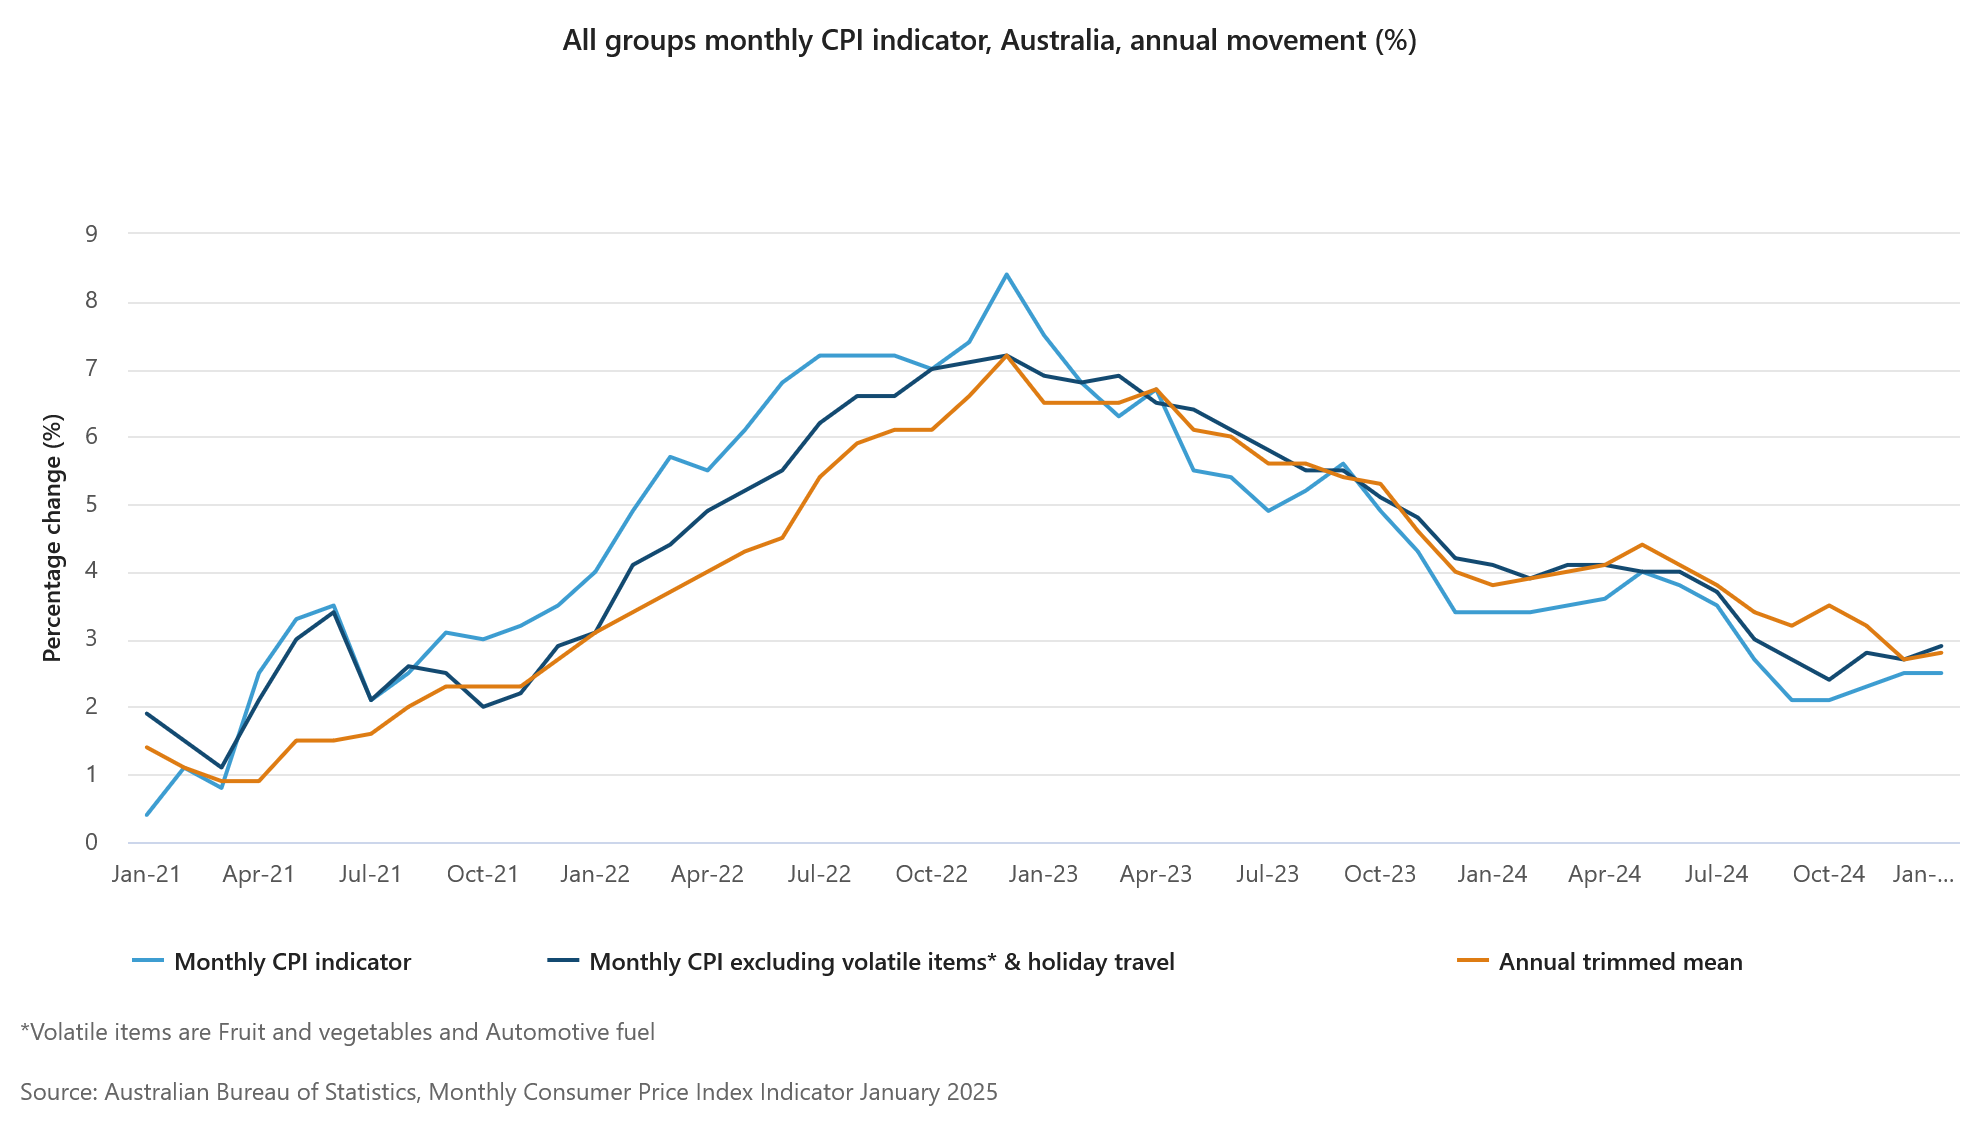
Australia’s monthly CPI holds at 2.5%, core measures edge higher
Australia’s monthly CPI was unchanged at 2.5% yoy in January, falling short of expectations for a slight uptick to 2.6%.
However, underlying inflation pressures showed signs of persistence, with CPI excluding volatile items and holiday travel rising from 2.7% yoy to 2.9% yoy. Trimmed mean CPI edged up from 2.7% yoy to 2.8% yoy.
These figures suggest that while headline inflation appears stable, core price pressures are still lingering, reinforcing RBA’s cautious stance on further easing.
The largest contributors to annual inflation included food and non-alcoholic beverages (+3.3% yoy), housing (+2.1% yoy), and alcohol and tobacco (+6.4% yoy).This was partly offset by a notable decline in electricity prices, which fell -11.5% yoy.
Fed’s Barkin: Staying modestly restrictive until inflation risks clear
Richmond Fed President Tom Barkin highlighted the need for a “modestly restrictive” monetary policy stance until there is greater confidence that inflation is firmly returning to the 2% target.
Speaking in a speech overnight, Barkin emphasized the importance of remaining “steadfast” in tackling inflation, warning that history has shown the risks of easing policy too soon.
“We learned in the '70s that if you back off inflation too soon, you can allow it to reemerge. No one wants to pay that price,” he cautioned.
Barkin acknowledged the high level of uncertainty surrounding economic policy changes, geopolitical tensions, and natural disasters, all of which could influence inflation dynamics.
He noted that tariffs imposed during Donald Trump's first administration in 2018 added about 30 basis points to inflation. However, he cautioned that the effect of the latest round of trade policies is harder to predict, as firms may either pass costs onto consumers or absorb them.
Beyond trade policies, Barkin also flagged uncertainties around deregulation, tax policies, government spending, and immigration reforms, all of which could shape labor market dynamics and broader economic conditions.
Given these unknowns, he prefers to “wait and see how this uncertainty plays out” before advocating any adjustments to monetary policy.
Looking ahead
German Gfk consumer climate and Swiss UBS economic expectations will be released in European session. Later in the day, US will release new home sales.
USD/CAD Daily Outlook
Daily Pivots: (S1) 1.4266; (P) 1.4293; (R1) 1.4345; More...
Intraday bias in USD/CAD stays neutral with focus turning to 1.4378 resistance as rebound from 1.4150 extends. Firm break there will suggest that the correction from 1.4791 has completed, and turn bias back to the upside for retesting 1.4791. On the downside, break of 1.4150 will target 1.3946 cluster support (61.8% retracement of 1.3418 to 1.4791 at 1.3942).
In the bigger picture, long term up trend is tentatively seen as resuming with prior breach of 1.4667/89 key resistance zone (2020/2015 highs). Next target is 100% projection of 1.2401 to 1.3976 from 1.3418 at 1.4993. This will remain the favored case as long as 1.3976 resistance turned support holds (2022 high), even in case of deep pullback.
Australia’s monthly CPI holds at 2.5%, core measures edge higher
Australia’s monthly CPI was unchanged at 2.5% yoy in January, falling short of expectations for a slight uptick to 2.6%.
However, underlying inflation pressures showed signs of persistence, with CPI excluding volatile items and holiday travel rising from 2.7% yoy to 2.9% yoy. Trimmed mean CPI edged up from 2.7% yoy to 2.8% yoy.
These figures suggest that while headline inflation appears stable, core price pressures are still lingering, reinforcing RBA’s cautious stance on further easing.
The largest contributors to annual inflation included food and non-alcoholic beverages (+3.3% yoy), housing (+2.1% yoy), and alcohol and tobacco (+6.4% yoy).This was partly offset by a notable decline in electricity prices, which fell -11.5% yoy.
Fed’s Barkin: Staying modestly restrictive until inflation risks clear
Richmond Fed President Tom Barkin highlighted the need for a “modestly restrictive” monetary policy stance until there is greater confidence that inflation is firmly returning to the 2% target.
Speaking in a speech overnight, Barkin emphasized the importance of remaining “steadfast” in tackling inflation, warning that history has shown the risks of easing policy too soon.
“We learned in the '70s that if you back off inflation too soon, you can allow it to reemerge. No one wants to pay that price,” he cautioned.
Barkin acknowledged the high level of uncertainty surrounding economic policy changes, geopolitical tensions, and natural disasters, all of which could influence inflation dynamics.
He noted that tariffs imposed during Donald Trump's first administration in 2018 added about 30 basis points to inflation. However, he cautioned that the effect of the latest round of trade policies is harder to predict, as firms may either pass costs onto consumers or absorb them.
Beyond trade policies, Barkin also flagged uncertainties around deregulation, tax policies, government spending, and immigration reforms, all of which could shape labor market dynamics and broader economic conditions.
Given these unknowns, he prefers to “wait and see how this uncertainty plays out” before advocating any adjustments to monetary policy.
Bitcoin Loses Ground—Falling Below $90K Sparks Panic
Key Highlights
- Bitcoin price declined heavily and even traded below the $90,000 support.
- BTC is now following a connecting bearish trend line with resistance at $91,600 on the 4-hour chart.
- Ethereum price also declined and traded below the $2,500 support.
- XRP dipped toward $2.00 before the bulls appeared.
Bitcoin Price Technical Analysis
Bitcoin price made a couple of attempts to settle above $100,000 against the US Dollar. However, BTC failed and started a fresh decline.
Looking at the 4-hour chart, the price gained bearish momentum after it broke the $95,000 support zone. There was a close below the $92,000 level, the 100 simple moving average (red, 4-hour) and the 200 simple moving average (green, 4-hour).
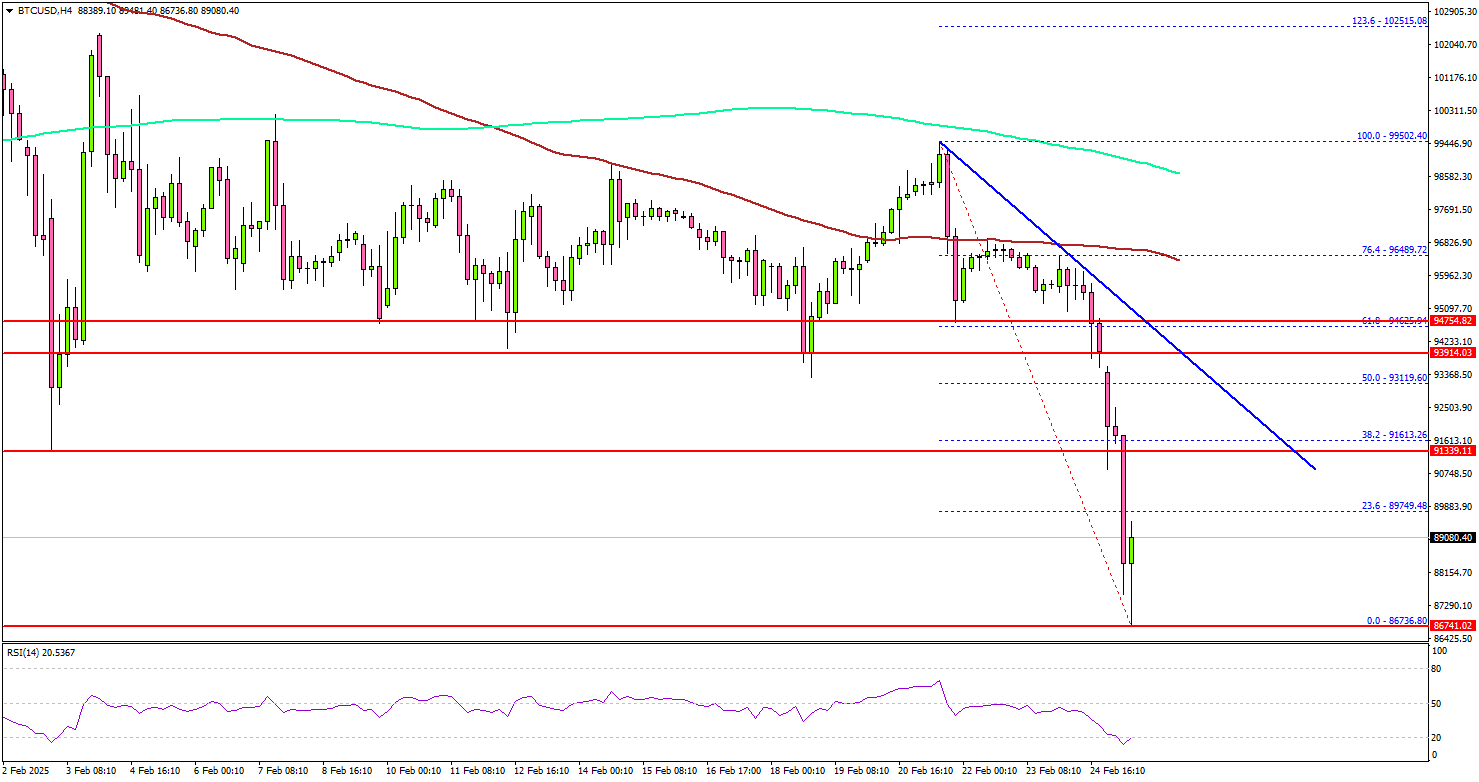
The bears even pushed the price below the $90,000 mark. A low was formed at $86,736 and the price is now consolidating losses. On the upside, the price could face resistance near the $90,000 level.
The next key resistance is $91,500. There is also a connecting bearish trend line forming with resistance at $91,600 on the same chart. It is close to the 38.2% Fib retracement level of the downward move from the $99,502 swing high to the $86,736 low.
A successful close above $91,600 might start another steady increase. In the stated case, the price may perhaps rise toward the $93,000 level. Any more gains might call for a test of $95,000.
Immediate support is near the $87,200 level. The next key support sits at $86,650. A downside break below $86,650 might send Bitcoin toward the $85,000 support. Any more losses might send the price toward the $83,200 support zone.
Looking at Ethereum, there was a fresh bearish reaction and the bears pushed the price below the $2,500 support zone.
Today’s Economic Releases
- US New Home Sales for Jan 2025 (MoM) – Forecast +0.2% versus +3.6% previous.
NASDAQ Elliott Wave Forecast – Identifying The Next Buying Opportunity
The NASDAQ (NQ_F) remains bullish from the all-time low despite the pullback from December 2024. The pullback could present a perfect opportunity for buyers in the coming days. This blog post will address key price areas for the buyers to anticipate the next opportunity.
NASDAQ (NQ) is in an all-time bullish trend. Within this all-time bullish cycle, the index started the current bullish cycle from the low of October 2022 where it completed wave (II) and began wave (III). We reckon, as the chart below shows, that the peak of December 2024 marked the end of wave III of (III). Thus, the pullback from that high should be wave IV of (III).
Wave IV started from the peak of December 2024. In an ideal market condition, buyers anticipate going long from the extreme of pullbacks within an established bullish sequence. On the other hand, traders tend to sell at the extreme of corrective bounces within a bearish sequence. Thus, the corrective pullback from December could be another ideal setup for buyers. One of the easiest and most profitable structures to trade in this regard is the Zigzag or Double Zigzag corrective sequences.
Double Zigzag Structure in Elliott Wave Theory
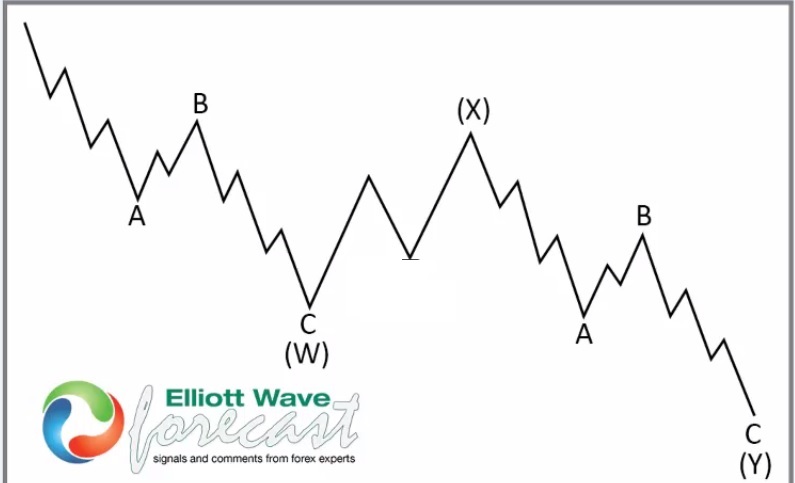
In Elliott Wave Theory, a double zigzag is a complex corrective pattern that consists of two zigzags (labeled W and Y) connected by an intervening corrective wave (labeled X). It is denoted as W-X-Y and serves to extend the duration and depth of a correction beyond a single zigzag.
Structure of a Double Zigzag (W-X-Y):
- Wave W – The first zigzag (A-B-C).
- Wave X – A corrective wave that connects W and Y. It can take various forms (flat, triangle, or another zigzag).
- Wave Y – The second zigzag (A-B-C), which typically follows the same direction as wave W.
Rules & Guidelines:
- Both W and Y are zigzags (A-B-C structures), meaning wave A is impulsive or leading diagonal, wave B is corrective, and wave C is impulsive or ending diagonal.
- Wave X is typically smaller than W and Y but can sometimes be complex.
- A double zigzag extends the correction compared to a single zigzag, often forming a deeper retracement.
- It usually appears in corrective waves (wave 2, wave 4, or within a larger complex correction).
NASDAQ Elliott Wave Analysis: Double Zigzag Pullback for Wave IV?
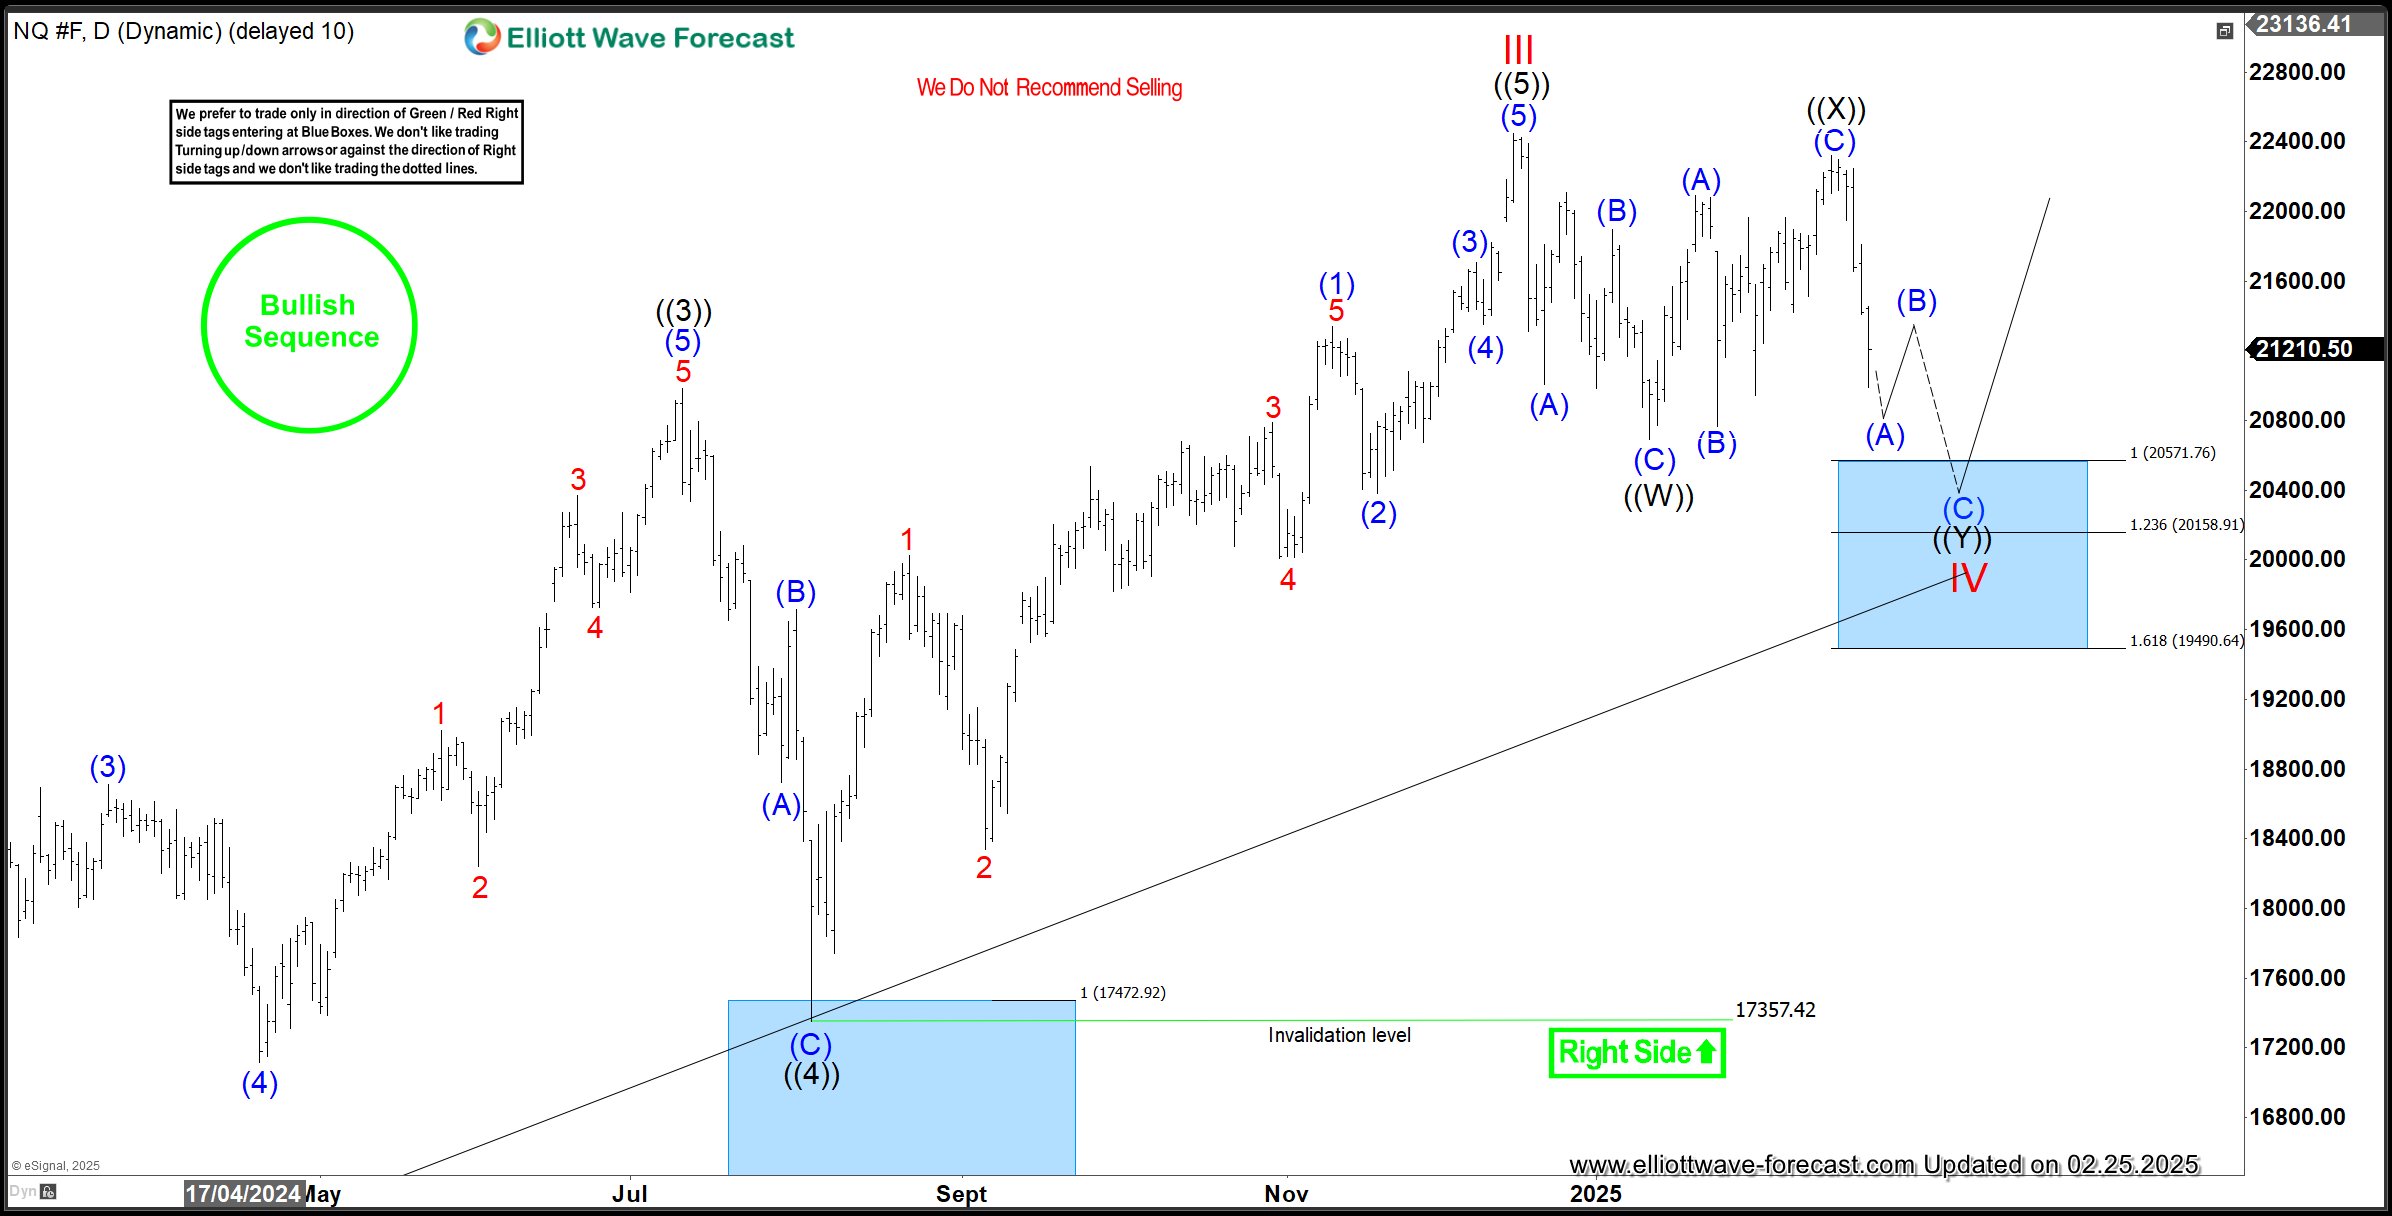
The wave IV pullback from December is close to finishing a W-X-Y double zigzag structure. Wave ((W)) and ((X)) of IV finished on 13th January 2025 and 18th February 2025. The fast decline that follows is identified as wave (A) of ((Y)). The price might correct the decline from the February high in wave (B) of ((Y)) before dropping again in wave (C) of ((Y)) and finishing the structure.
In Fibonacci ratios, wave Y often ends within 100%-123.6% of wave W but sometimes reaches close to 161.8%. 161.8% extension within a double zigzag is very rare and in most cases will be considered an impulse or triple zigzag instead. Thus, at the blue box (20571.75-19490.64), we will expect wave (V) to begin or at least a 3-swing bounce to a risk-free area. The blue box prices should be watched. It could attract fresh bids if the price gets there.
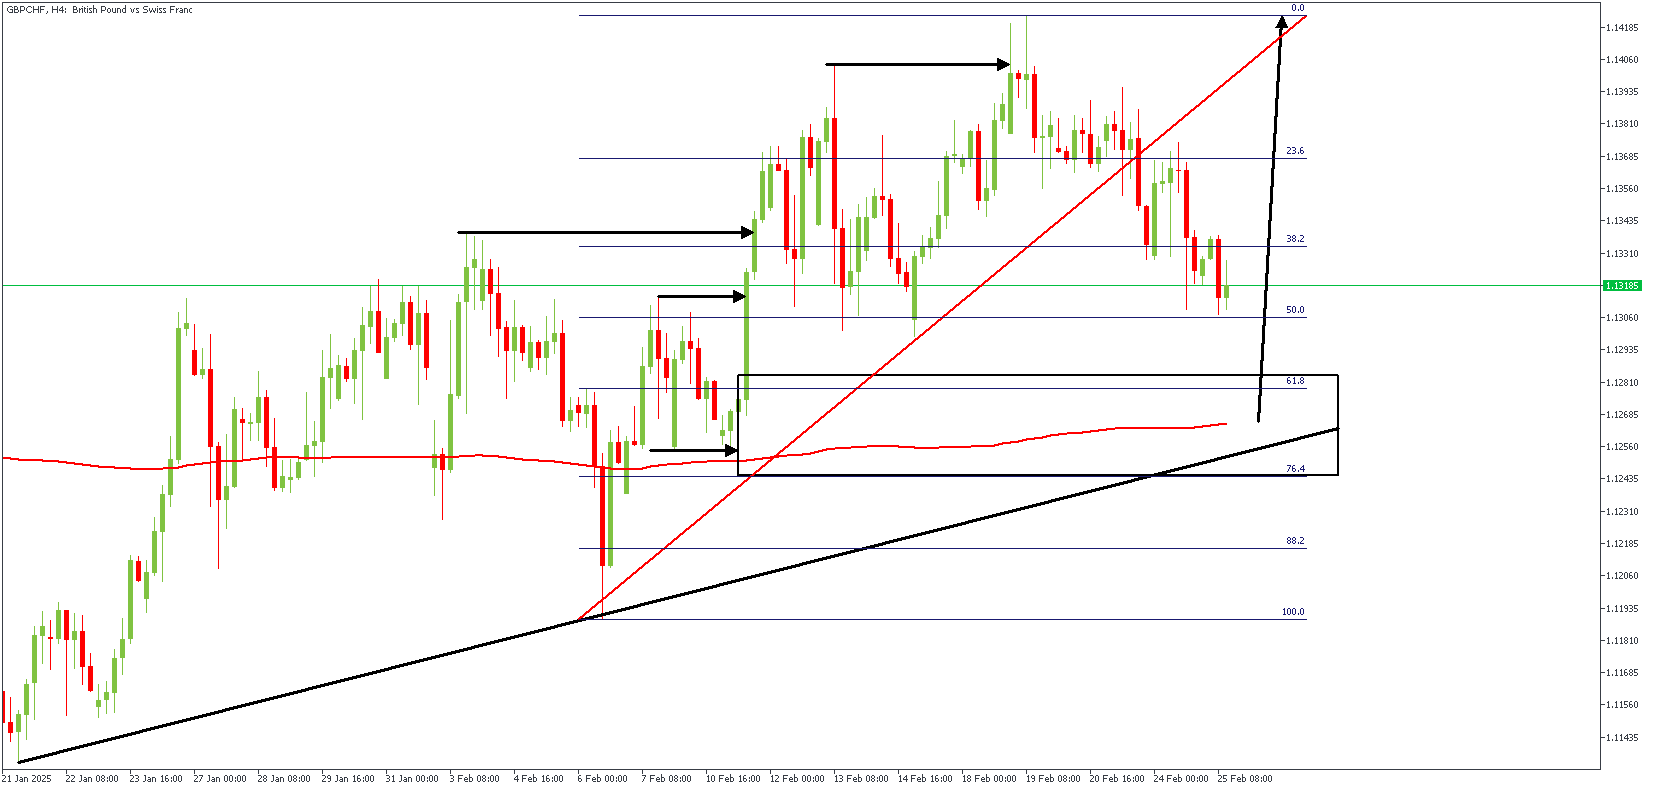
GBPCHF Technical Analysis
The Pound Sterling (GBP) rose 0.37% to 1.2669 after rebounding from a two-day low of 1.2605, as the US Dollar weakened due to falling US Treasury yields. Market sentiment turned negative following US President Trump's renewed tariff threats on Canadian and Mexican goods. Weak US economic data also weighed on the Dollar, with the 10-year Treasury yield dropping 10 basis points to 4.30%. US home prices rose 4.5% year-over-year in December, slightly higher than November's 4.3%. The Confederation of British Industry in the UK reported that retailers plan to cut investments due to weak spending and high prices. A Reuters poll suggests the Bank of England (BoE) will likely keep rates steady at 4.50% in March, possibly cutting to 4.25% in Q2. Traders now await comments from BoE's chief economist, Huw Pill.
GBPCHF – H4 Timeframe
The highlighted demand zone on GBPCHF's 4-hour timeframe chart is the result of a bullish SBR pattern, with confluences from the 61% Fibonacci retracement level, 200-period moving average support, and trendline support. An FVG near the demand area lends further credence to the bullish sentiment.
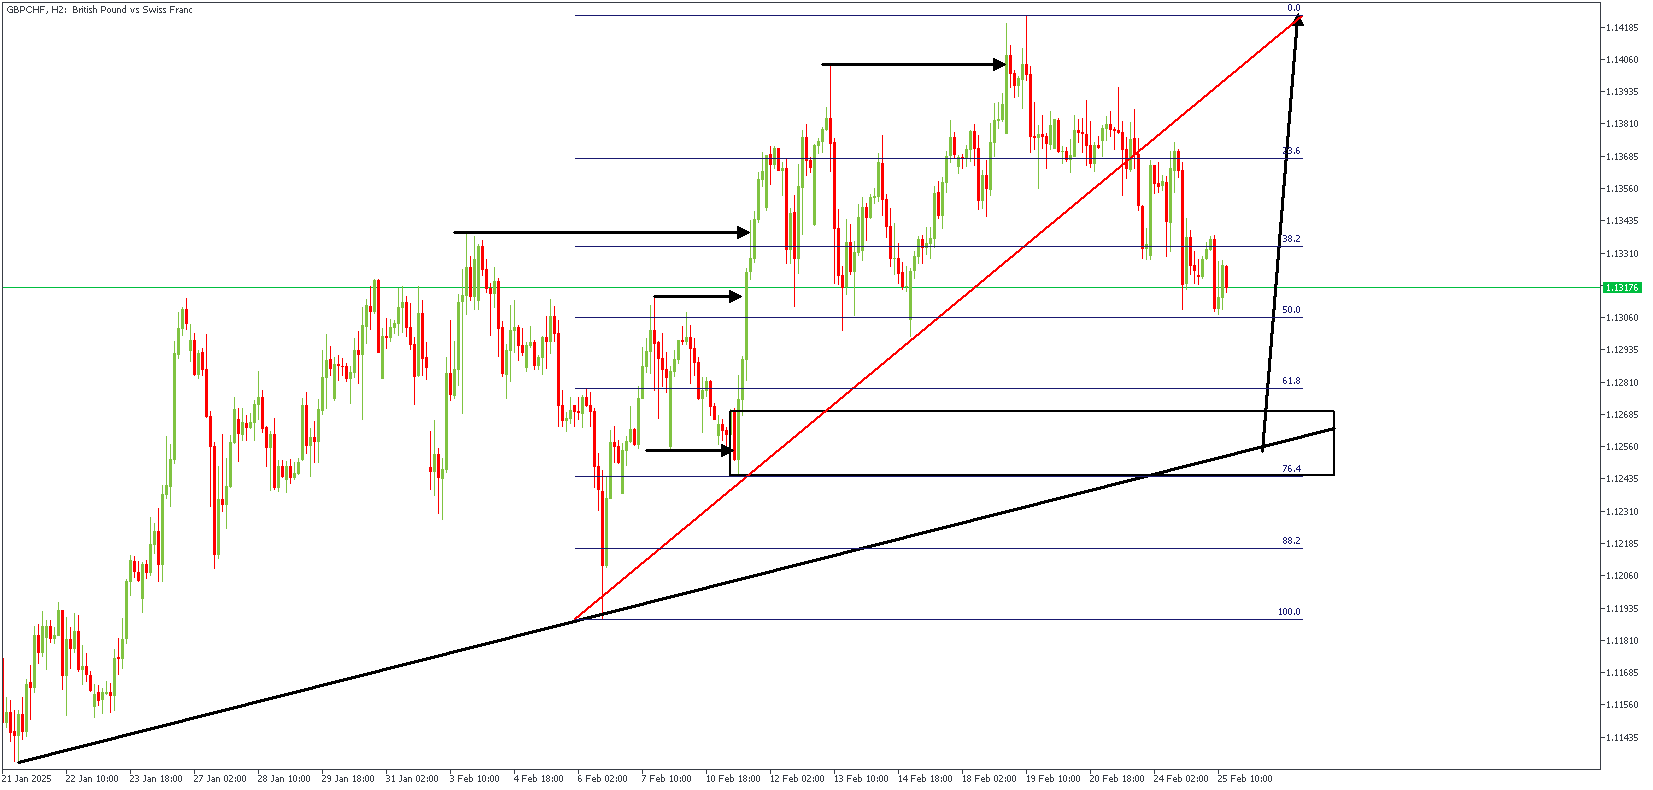
GBPCHF – H3 Timeframe
The 3-hour timeframe chart of GBPCHF shows the SBR pattern in more detail, with the induced low visibly retracing before filling up the FVG area. The reaction from the confluence of the demand zone, the trendline support, and the 61% Fibonacci retracement level is expected to push prices to create a new higher high.
Analyst's Expectations:
- Direction: Bullish
- Target- 1.14218
- Invalidation- 1.12162
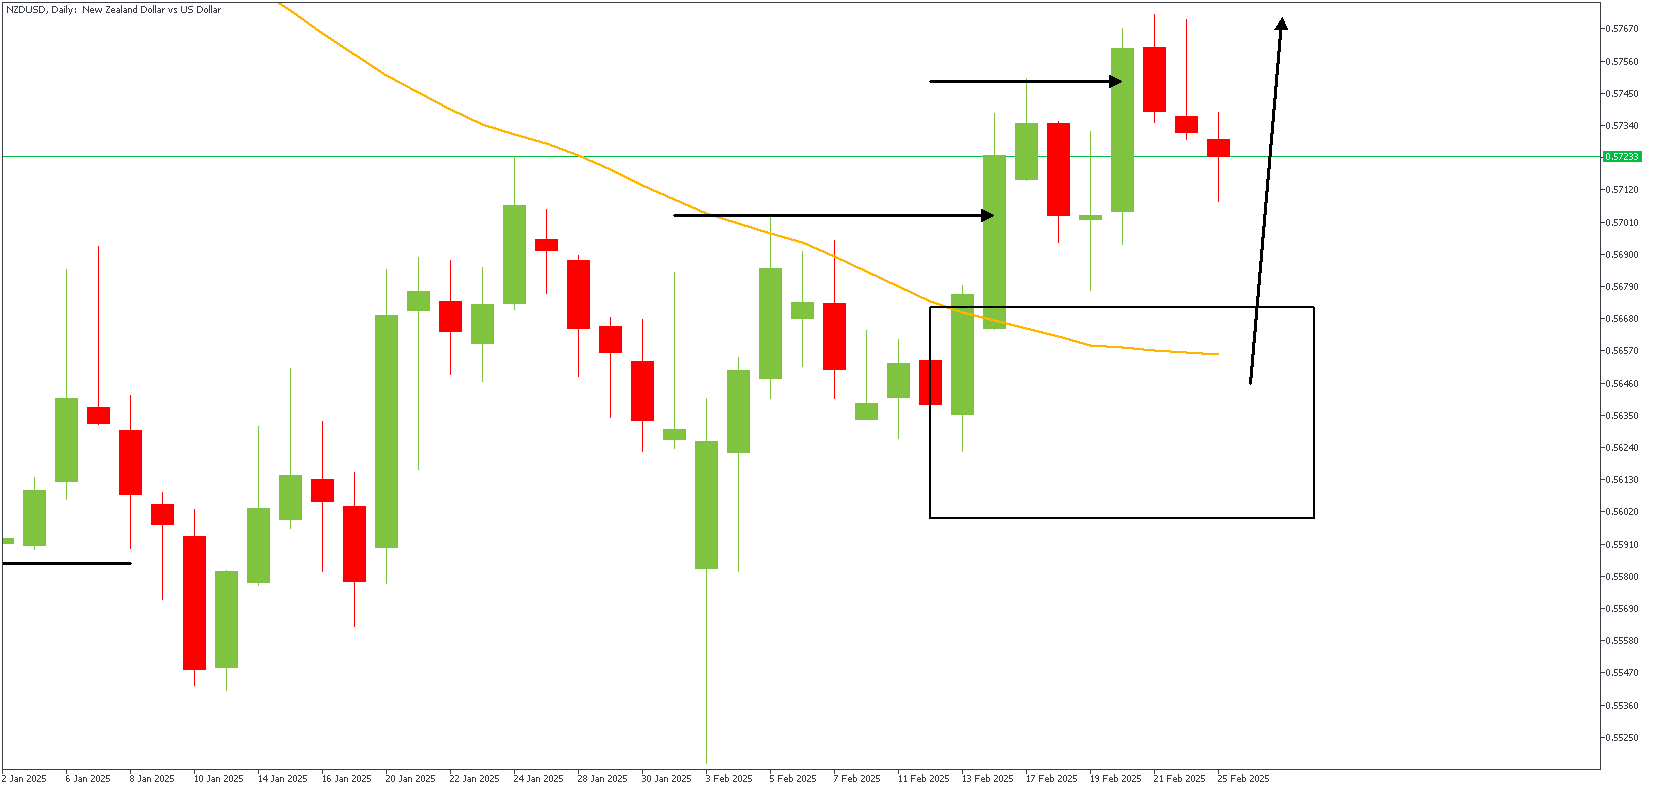
NZDUSD Technical Analysis
The New Zealand Dollar (NZD) is facing slight downward pressure against the US Dollar (USD) and could dip further, though it's unlikely to fall clearly below 0.5715. If it does break that support, reaching 0.5790 is doubtful. In the short term, analysts expected the NZD to move between 0.5735 and 0.5770, which it did—hitting both levels before closing at 0.5733, down 0.17%. The downward momentum has slightly increased, suggesting the NZD might edge lower today. However, any drop is expected to stay above 0.5715. This mild pressure will likely hold if the NZD remains below 0.5760, with minor resistance at 0.5745.
NZDUSD – D1 Timeframe
After breaking above the 50-day moving average, the price action on the daily timeframe chart of NZDUSD proceeded to overshoot the previous high, creating a new higher high in the process. The momentum from the breakout has waned, giving rise to the ongoing retracement move. The expectation is that the confluence region of the drop-base-rally demand zone and the 50-day moving average would provide adequate support for a bullish continuation.
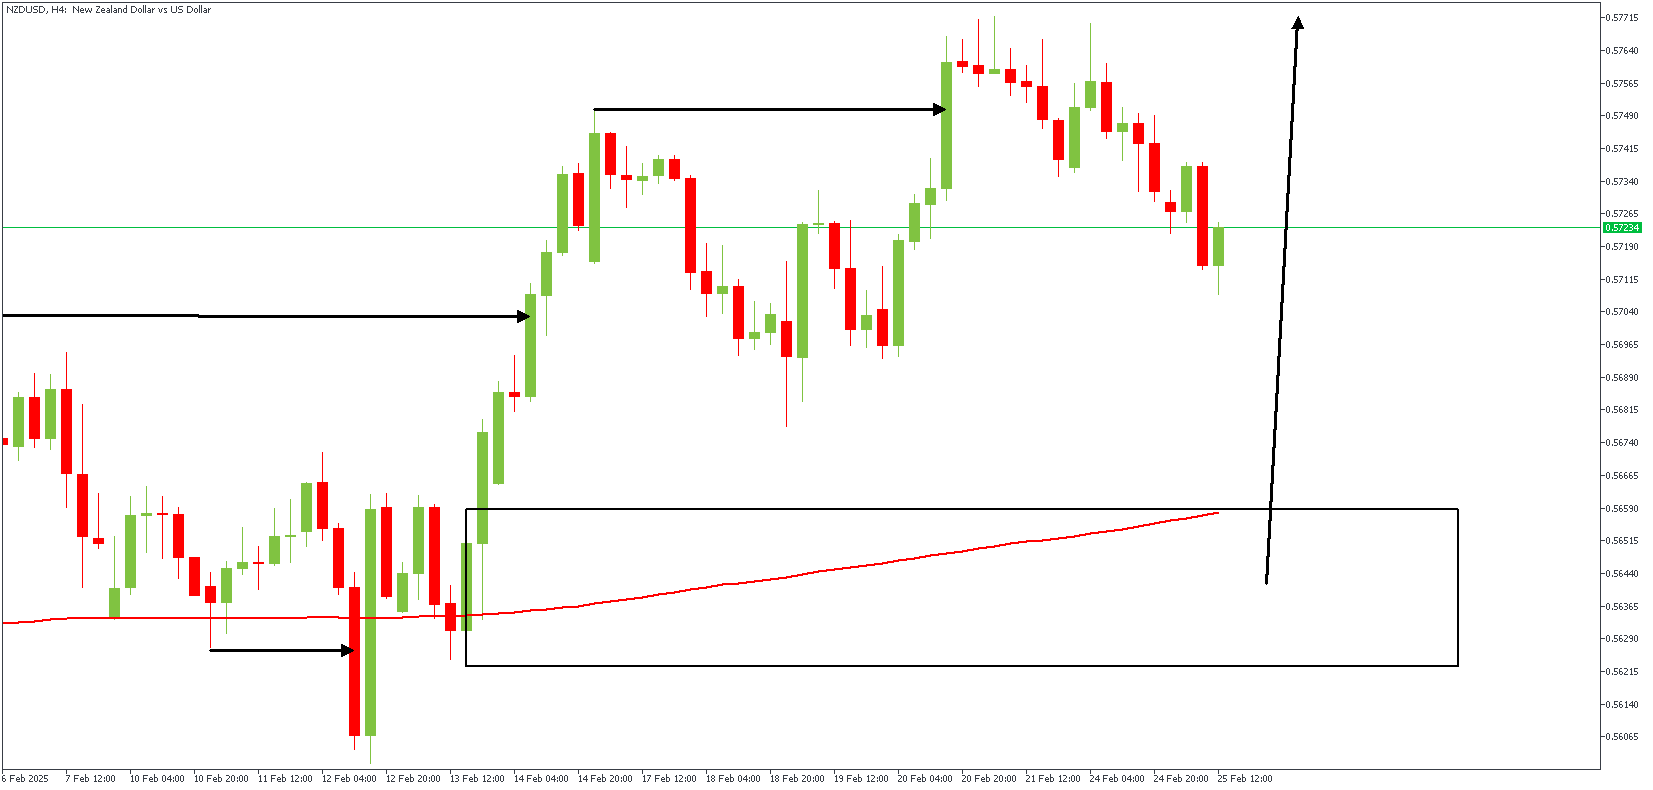
NZDUSD – H4 Timeframe
The 4-hour timeframe chart of NZDUSD shows that the daily timeframe demand zone doubles as the trough of a bullish SBR pattern, with the presence of an FVG, 100-period moving average support, 76% Fibonacci retracement level support, and liquidity at the previously induced low. The expected outcome in this scenario is bullish, with an initial target at the BSL (Buy-Side Liquidity) at the recent high.
Analyst's Expectations:
- Direction: Bullish
- Target- 0.57713
- Invalidation- 0.56004
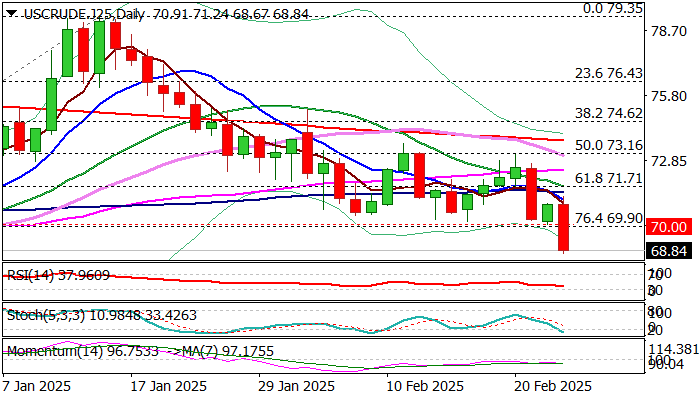
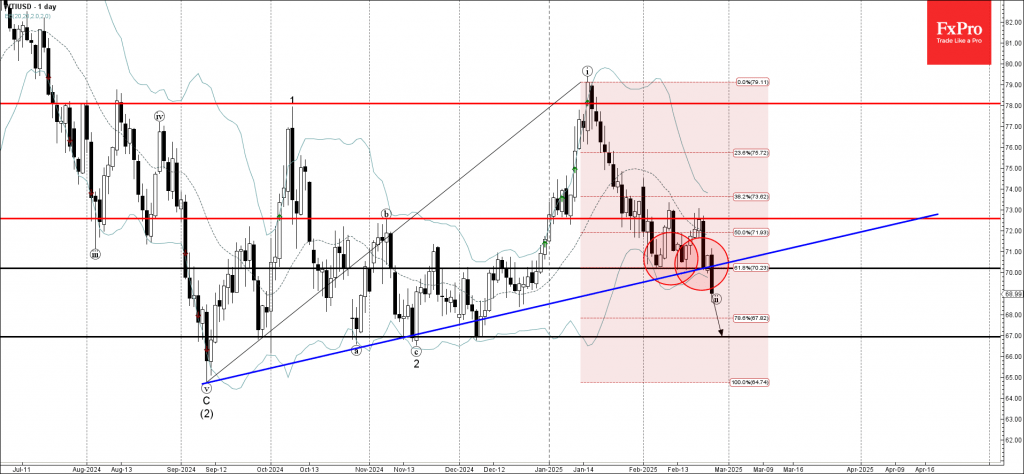
WTI Crude Oil Wave Analysis
- WTI crude oil broke support zone
- Likely to fall to support level 67.00
WTI crude oil recently broke the support zone between the round support level 70.00 (which reversed the price multiple times from the start of February), the support trendline from September and the 61.8% Fibonacci correction of the upward impulse from September.
The breakout of this support zone accelerated the active short-term correction ii of the intermediate upward impulse sequence (3) from September.
WTI crude oil can be expected to fall further to the next support level 67.00 (former monthly low from December).
WTI Oil Falls Below $70 per Barrel as Tariff Concerns Further Sour Sentiment
WTI oil price fell below psychological $70 support on Tuesday and hit the lowest levels in two months.
Oil was down nearly 3% on renewed fears about the global economy and lower demand after the latest economic data showed that German economy contracted for the second straight quarter and US consumer confidence declined at the fastest pace since mid-2021.
Strong concerns among investors were also fueled by US tariffs on imports, as President Trump signaled that initially delayed tariffs on imports from Canada and Mexico, will be implemented according to the schedule – at the beginning of next month.
Tariffs on China’s goods imports further contribute to negative outlook, as this would directly fuel inflation, while consequences of trade war would be significant.
Negative fundamentals continue to sour the sentiment and raise pressure on oil prices.
Sustained break below $70/$69.90 supports (psychological / Fibo 76.4% of $66.98/$79.35 rally) to further firm bearish stance and risk dip towards weekly base at $67.00/66.30 zone (Oct/Dec 2024).
Broken $70 zone reverted to solid resistance which should ideally cap.
Res: 69.79; 70.00; 70.83; 71.44
Sup: 68.44; 67.70; 66.98; 66.54