Sample Category Title
EUR/USD Recovers Sharply above 1.2250
Key Highlights
- The Euro formed a major bottom around 1.2155 against the US Dollar, and recovered sharply.
- There was a break above a crucial bearish trend line with resistance at 1.2280 on the 4-hours chart of EUR/USD.
- The Michigan Consumer Sentiment Index in Feb 2018 posted a decline from 99.9 to 99.7.
- The Euro Zone Services PMI for Feb 2018 will be released today, which is forecasted to remain at 56.7.
EURUSD Technical Analysis
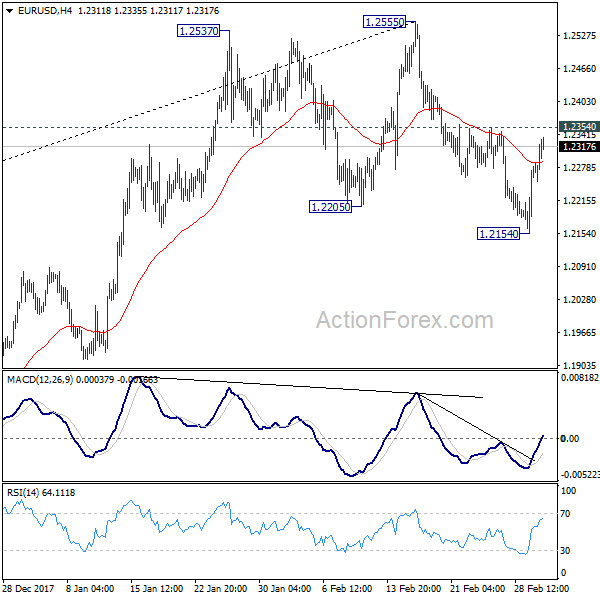
After a major decline this past week, the Euro found support near 1.2150. The EUR/USD pair started a sharp upside recovery and traded above the 1.2250 resistance area.
The upside move seems to be positive and if the pair gains momentum above 1.2350, there could be further upsides in the near term.

EURUSD Technical Analysis Euro US Dollar
During the upside move, there was a break above a crucial bearish trend line with resistance at 1.2280 on the 4-hours chart. The pair also broke the 50% Fib retracement level of the last decline from the 1.2355 high to 1.2154 low.
The past few candles are mostly green, which suggest a short-term trend change in EUR/USD above 1.2250. On the downside, supports are at 1.2280 and 1.2250.
If the pair continues to move higher, then a break above 1.2350 could push the pair towards the 1.236 Fib extension of the last decline from the 1.2355 high to 1.2154 low at 1.2402.
Overall, it seems like the US Dollar is under pressure. This past week it declined sharply against the Japanese Yen as the USD/JPY pair traded below the 106.20 support levels. The pair may continue to decline as it is currently in a bearish zone below 106.50.
Economic Releases to Watch Today
- Germany’s Services PMI for Feb 2018 – Forecast 55.3, versus 55.3 previous.
- Euro Zone Services PMI for Feb 2018 – Forecast 56.7, versus 56.7 previous.
- US Services PMI for Feb 2018 – Forecast 54.6, versus 55.9 previous.
- US ISM Non-Manufacturing Index for Feb 2018 – Forecast 59.4, versus 59.9 previous.
Trumps Tariff Torpedo ?
Elections two ways
The two-pronged political risk has apparently come and gone
The SPD was expected to vote yes for another grand coalition, and the results confirm as such – a clear majority of 66.02%.
In Italy, the most likely scenario for a hung parliament came to fruition. Dealers continue to treat the Eur like hot potatoes not sure where to go given the Italian politics is headed for gridlock.
The results are initially interpreted as mildly supportive for the Euro given the worst case scenario, the Anti-establishment/Eurosceptic coalition in office was averted but is reversing out the initial wave of positivity. The market remains extremely choppy. Keep in mind upward momentum should be muted ahead of this weeks ECB meeting so the market will look to fade upticks given the political malaise in Italy will play on.
Trumps Tariff Torpedo
To say that President Trump proposed launching of tariff torpedo will sink the US dollar could be a huge understatement.
The President's proposed steel tariffs have tarred both free trade and a soft dollar policy with the same brush. No one expected the first stratagem to be as cutting with such wanton disregard for long-standing allies. Only days before Trump's tariff torpedo, Defence Secretary James Mattis put public pen to the paper urging the administration to consider tariffs targeted at specific countries and to focus on what he described as the underlying problem — Chinese overproduction.
With widespread reports that the President has ignored the advice of leading advisors, nothing can be ruled out at this stage. But given the international uproar, not to mention the market fall out; the President may consider dialling back on some of the rhetoric. However, hoping for cooler heads to prevail, might be far too optimistic given that President Trump promoted reforms of U.S. trade policies as a cornerstone of his election campaign.Even more so as the war of words escalated over the weekend when The President threatened to levy a tax on EU built cars that freely flow onto the US, in response to Jean Claude Junker threatening a tax on EU imported Harley Davidson motorbikes.
But tempering overall rhetoric, A top trade adviser to U.S. President Donald Trump said on Sunday a process would be in place for businesses to get exemptions from the White House plan to place steep tariffs on steel and aluminium, offering the first indication a tariff hike could be less broad than first thought.
As for the currency traders initial reactions, they are talking the talk and walking the walk realising that through US Trade tariffs; Trump is carrying the seeds of the dollar's destruction. The economic fallout from trade duties would result in a toxic elixir of lower domestic growth and higher inflation, neither of which inspires investors confidence in the dollar. But more significantly, as the soft dollar policy starts to erode the returns on US bond and equity markets, then the more vicious downward spiral takes hold.
When you consider that we may only be in the early stages of Tumps Trade Tirade, with far more critical decisions coming up on China abuse of intellectual property under section 301 of the US trade act, life in the markets could get incredibly messy.
Oil Markets
Steel tariffs brought concerns that US trade policy will dent economic growth, but this cause and effect is very unclear as the impact could be specific industry exemptions. But headline risk will continue to run extremely high so traders will stay on red alert.
Energy industry officials raised concerns about the tariffs on steel since the sector relies on imports for everything from pipelines to drilling equipment to liquefied natural gas import terminals.
None the less, it was a stressful week for oil markets as US exports fell, the dollar rose after incoming Fed chairman Powell's day one testimony, Libya reportedly increased supply and Iraq agreed in principle with Kurdistan on restarting Kirkuk pipeline. But more importantly, the upswing in US Shale production estimates continues to march higher.
If there was ever a compelling argument for OPEC and US shale producer to see eye to eye, now is the time. OPEC will host a dinner on Monday in Houston with US shale firms, at a time when US oil production is blasting through 10 million barrels per day. Sure OPEC and Non-OPEC alliance remain at record high compliance, but with Russia continually pressuring for an exit strategy, OPEC will look to offer an olive branch to US shale.Perhaps a universal realisation that all producer, OPEC and US Shale alike, need to tame a global oil glut could lead these long-standing Oil Patch Frenemies to work collectively towards similar goals, higher oil prices. As such, we should interpret any positive developments from the meeting as support for underly oil price sentiment.
Gold Markets
The Impact of the steel tariffs inflationary concern is tangible and could give cause for the Fed to raise interest rates four times this year. As far as Gold traders are concerned, however, the inflationary impact of trade war escalation will overwhelm the effect of higher US interest rates.And despite the prospect of higher US interest, it will not translate into a stronger due to inflationary concerns. So any escalation of trade wars will significantly dent the US dollar appeal, weigh negatively on US assets such as bond and equities and make gold the go-to hedge against rising US fiscal and political vulnerabilities.
Currency Markets
Look for USDJPY to carry the truncheon for the possible dollar demise led by speculative selling in JPY crosses while currency markets maintain an overall dollar harmful proclivity if US trade sanctions escalate
G-10
The Japanese Yen
Trade wars and geopolitical concerns are JPY-positive, as the market chases haven assets amidst growing uncertainty. Also, Kuroda signalled that the BoJ might start considering an exit from its extreme unconventional policy in 2019. If history tells us anything bout currency traders is that they will trip over one another at any hint policy normalisation as you can make three years of your trading budget riding the early wave. Such was the case of last years move on the Euro( 1.0600 to 1.2550) when traders surmised an ECB policy shift was afoot. Sure Kuroda suggestion is well down the road, but if we continue to get less verbal intervention from Japans currency regulators, it could be a signal the centeral bank is preparing the market for that eventuality. Indeed, allowing the JPY to carry the load during the early stages of squeezing financial conditions so that the fallout from YCC removal will be less market impactful. Also, we could see a growing appeal from global equity investors looking to build Japan exposure as Japanese corporates are clocking in record performances on relatively cheap equity valuation metrics, which could provide an added fillip to Yen sentiment. Of course, we know that currency markets seldom move in a straight line, but with the BoJ smoke signals looking ever so convincing, a bumpy move lower could be in the offing. Coincidentally, we have the BoJ rate announcement later in the week, and I'm sure Kuroda's follow up presser which should be fully subscribed by traders as its bound to filed some fascinating question this time around.
The Australian Dollar
The US 's international trade objective may see AUD underperform, but it would need commodity prices to fall off the ledge for a more profound move below the fundamental .7500 level.But the reality is that Trumps Tariff on metal prices could hike commodity prices.
And while the Aussie is running into some severe headwinds from the weaker than expected China PMI's, the hic-ups are most likely due to seasonal factors so it's far too early to downgrade China's economic growth which should continue to drive commodity prices higher.
Interest rate differential is having little effect on currencies, so we look for commodity prices and the broader US dollar narrative to drive local sentiment
The Aussie should remain well supported by 75-76 via global commodity prices while a move above 80 will be fleeting due to the contrary and negative domestic economic impact the backwards-looking economic data will show from the effect of a stronger A$
If you are looking for downside exposure on a commodity block trade, short CADJPY beckons.
The Canadian Dollar
If Trump emphatically holds firm, Steel Tariffs will all but derail NAFTA talks and given that this will throw longstanding homogenous cross-border trade upside down, CAD is the most vulnerable G-10 currency to Trump's tariff torpedo. Given the lack of enthusiasm over the latest GDP prints, while expecting the BoC to err dovish given the recent consumer data and US trade intentions, the market will be looking to build short CADJPY positions as trade war rhetoric escalates.
Before everyone maxes out on short CADJPY, it could be a ruse and little more than a trial balloon to gauge the equity market reaction, maybe wishful thinking).
Asia FX
The Chinese Yuan
In China, the first plenary of the National People's Congress( NPC) will be held, with significant state positions to be elected and the all-important 'term-limit' motion to be voted on.But the markets will remain overly focused on the global trade dynamics in the wake of Trump's tariff shocker. And both the CNY and USD will be the dominant focus this week given that the escalation of protectionist rhetoric. The mainland can stop this trade war rise dead in its tracks by releasing a symbolic a peace dove in the form of a lower tariff on imports from the US. Will the NPC provide the platform to offer this olive branch, only time will tell? With that in mind, reports are circulating that China is seeking high levels of meeting with the US to defuse trade tensions.
The Malaysian Ringgit
It's hard to envision Steel Tariffs derailing the underlying trends for the global economy. However, an escalation of an outright trade war could. From a regional perspective, the impact of the new Steel Tariffs will have a muted regional effect as China is not a significant supplier to the US markets. On this realisation, $Asia eased off the knee-jerk tariff reaction as higher yielding local bonds rallied as US Treasury yields collapsed with the Ringgit outperforming regional pairs on the back of foreign capital inflows.
However, if Trump does ante up his trade rhetoric, you can be sure that Asia lies squarely in his sights. But even in this environment, the MYR should be a relatively safer bet vs more prominent US export sensitive currencies like the KRW and TWD. Unfortunately, there is no playbook on how trade tariffs will play out and trying to understand the politics of trade wars even less comprehensible, but the Ringitt should hold up well relative to its regional peers
The market will quickly pivot to this weeks BNM, and while the new domestic inflation metrics give little cause for the bank to raise interest rates, traders will continue to focus on forwarding guidance. But at this stage, we're not expecting any upgrade on the centeral bank's monetary policy.
GOLD: Targets Further Upside Pressure
GOLD: The commodity looks to recover higher in the new week following its Friday positive close. On the downside, support comes in at the 1,310.00 level where a break will turn attention to the 1,300.00 level. Further down, a cut through here will open the door for a move lower towards the 1,290.00 level. Below here if seen could trigger further downside pressure targeting the 1,280.00 level. Conversely, resistance resides at the 1,330.00 level where a break will aim at the 1,340.00 level. A turn above there will expose the 1,350.00 level. Further out, resistance stands at the 1,360.00 level. All in all, GOLD looks to weaken further.

EURUSD: Looks To Recover Further Higher
EURUSD: With the pair seeing higher price close the past week, more strength is envisaged in the new week. On the upside, resistance comes in at 1.2350 level with a cut through here opening the door for more upside towards the 1.2400 level. Further up, resistance lies at the 1.2450 level where a break will expose the 1.2500 level. Conversely, support lies at the 1.2200 level where a violation will aim at the 1.2150 level. A break of here will aim at the 1.2100 level. Below here will open the door for more weakness towards the 1.2050. All in all, EURUSD faces further bull threats on correction.

EUR/USD Weekly Outlook
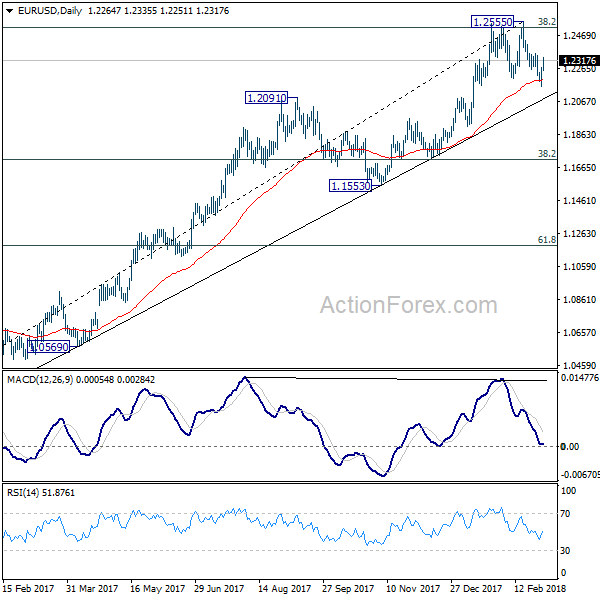
EUR/USD dipped 1.2154 last week but drew support from 55 day EMA and rebounded. The failure to sustain below 1.2205 key support didn't confirm trend reversal. Initial bias is neutral this week first. on the upside, above 1.2354 minor resistance will bring retest of 1.2555 high. Firm break there will carry larger bullish implication. On the downside, break of 1.2154 would revive the case of rejection by 1.2516 key fibonacci level and trend reversal. Outlook will be turned bearish for 38.2% retracement of 1.0339 to 1.2555 at 1.1708.
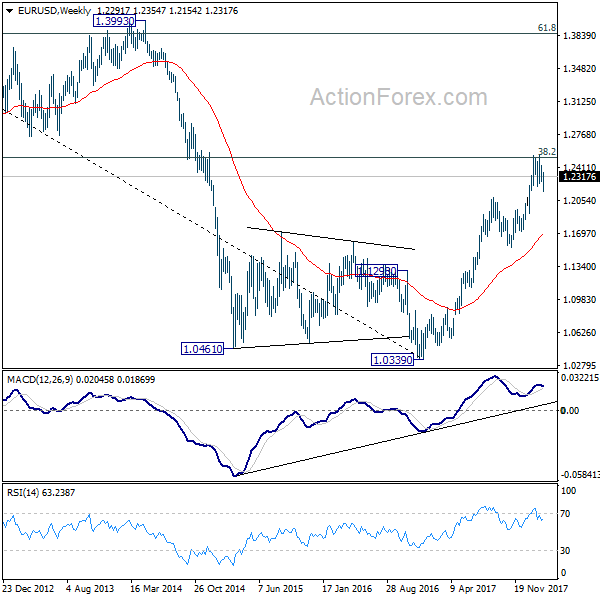
In the bigger picture, key fibonacci level at 38.2% retracement of 1.6039 (2008 high) to 1.0339 (2017 low) at 1.2516 remains intact despite attempts to break. Hence, rise from 1.0339 medium term bottom is still seen as a corrective move for the moment. Rejection from 1.2516 will maintain long term bearish outlook and keep the case for retesting 1.0039 alive. Firm break of 1.1553 support will add more medium term bearishness. However, sustained break of 1.2516 will carry larger bullish implication and target 61.8% retracement of 1.6039 to 1.0339 at 1.3862.
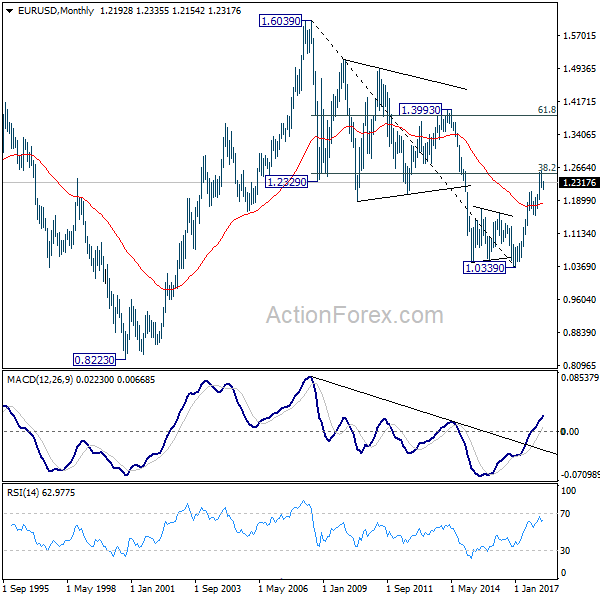
In the long term picture, 1.0339 is seen as an important bottom as the down trend from 1.6039 (2008 high) could have completed. It's still early to decide whether price action from 1.0339 is developing into a corrective or impulsive pattern. Reaction to 38.2% retracement of 1.6039 to 1.0339 at 1.2516 will give important clue to the underlying momentum.
USD/JPY Weekly Outlook
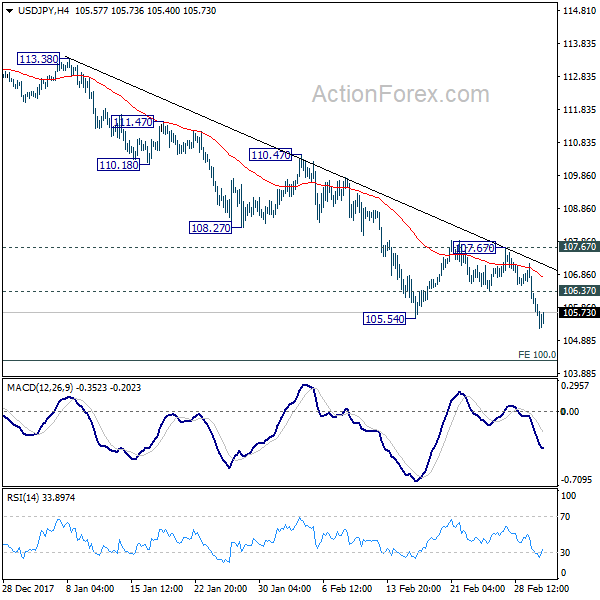
USD/JPY's medium term decline resumed by taking out 105.54 support last week. Initial bias remains on the downside this week. Current fall is part of the pattern from 118.65 and would target 100% projection of 118.65 to 108.12 from 114.73 at 104.20 next. Firm break there will target 98.97 key support level. On the upside, above 106.37 minor resistance will turn bias neutral first. But outlook will remain bearish as long as 107.67 resistance holds.
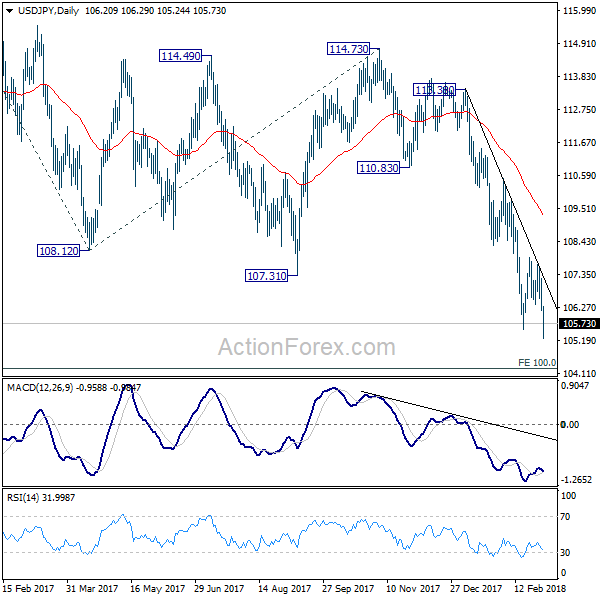
In the bigger picture, current development argues that the corrective pattern from 118.65 is extending. The solid break of 61.8% retracement of 98.97 to 118.65 at 106.48 now suggests that the pattern from 125.85 high is possibly extending. Deeper fall could be seen through 98.97 key support (2016 low). This bearish case will now be favored as long as 110.47 resistance holds.
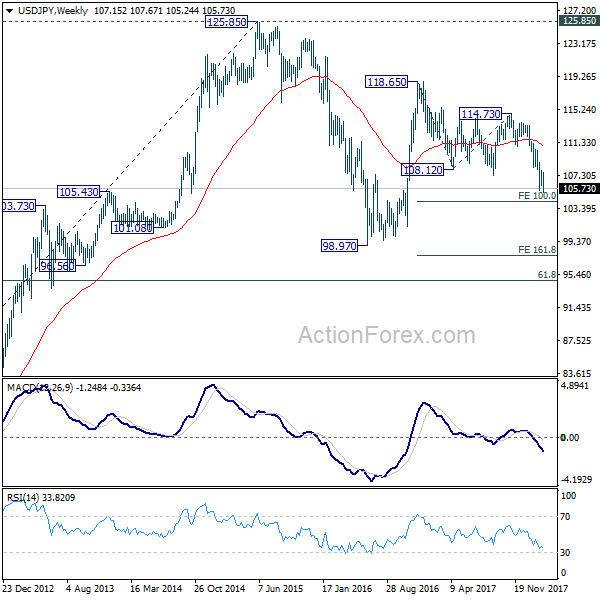
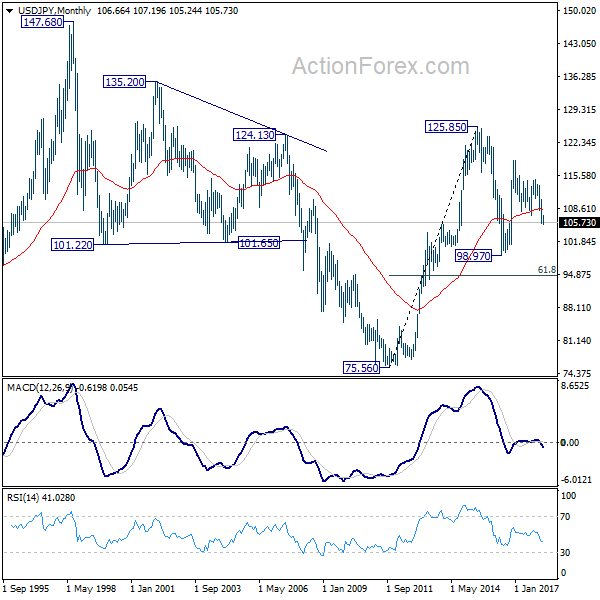
In the long term picture, the rise from 75.56 (2011 low) long term bottom to 125.85 top is viewed as an impulsive move, no change in this view. Price actions from 125.85 are seen as a corrective move which could still extend. In case of deeper fall, downside should be contained by 61.8% retracement of 75.56 to 125.85 at 94.77. Up trend from 75.56 is expected to resume at a later stage for above 135.20/147.68 resistance zone.
GBP/USD Weekly Outlook
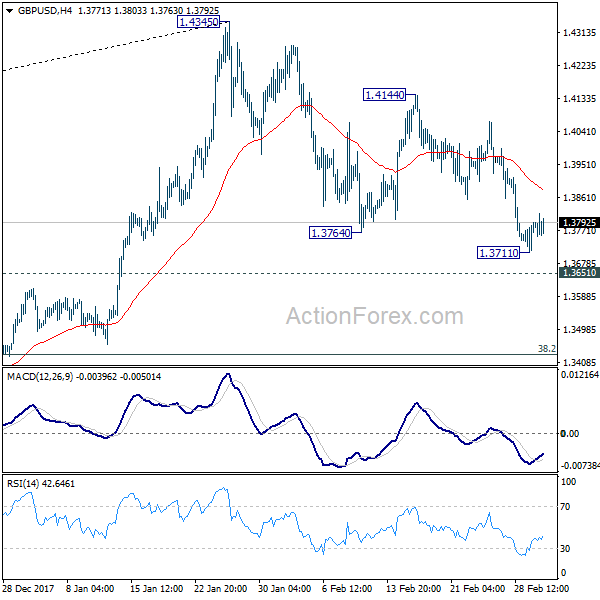
GBP/USD's decline from 1.4345 resumed last week and reached 1.3711. As a temporary low was formed, initial bias is neutral this week first. Further fall is still expected as long as 1.4144 resistance holds. Below 1.3711 will target 1.3651 resistance turned support and below. At this point, such fall is viewed as a corrective move. Hence, we'll look for strong support from 38.2% retracement of 1.1946 to 1.4345 at 1.3429 to contain downside and bring rebound.
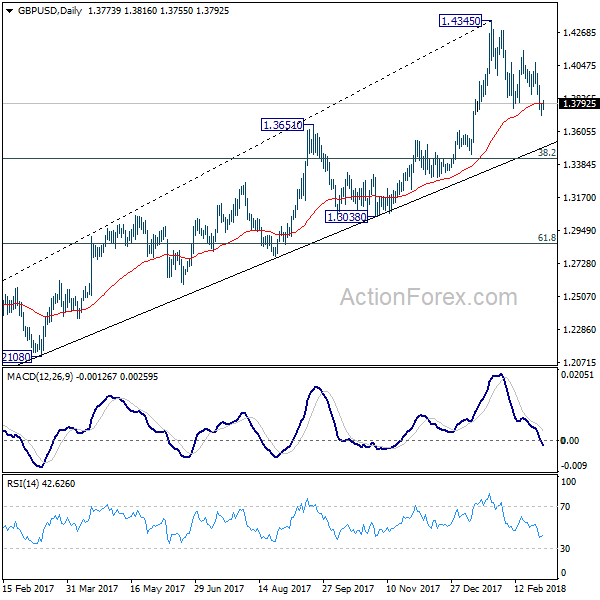
In the bigger picture, as long as 1.3038 support holds, medium term outlook in GBP/USD will remains bullish. Rise from 1.1946 is at least correcting the long term down from 2007 high at 2.1161. Further rally would be seen back to 38.2% retracement of 2.1161 (2007 high) to 1.1946 (2016 low) at 1.5466. However, GBP/USD fails to sustain above 55 month EMA (now at 1.4259) so far. Break of 1.3038 support, will suggest that rise from 1.1946 has completed and will turn outlook bearish for retesting this low.
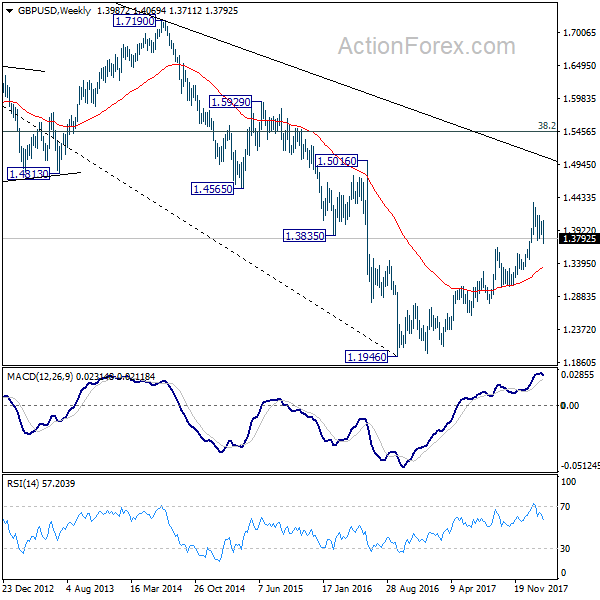
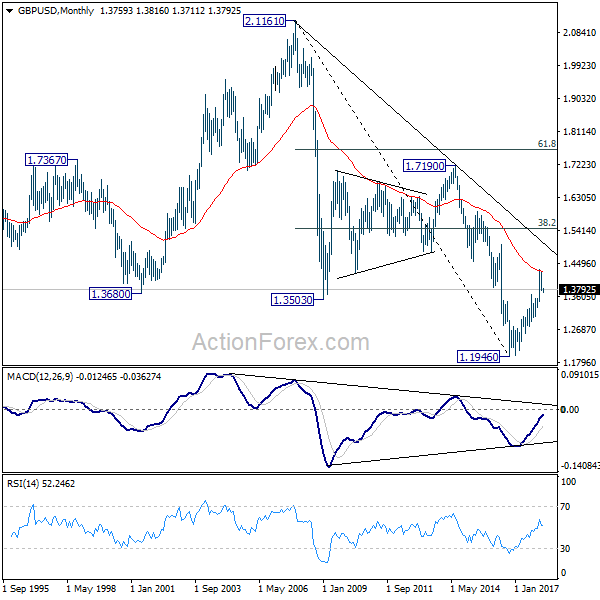
In the longer term picture, rise from 1.1946 should at least be correcting the whole long term down trend form 2.1161 and should target 38.2% retracement of 2.1161 (2007 high) to 1.1946 (2016 low) at 1.5466. It too early to tell if it's developing into a long term up trend. We'll monitor the upside momentum and reaction to 1.5466 to decide later.
USD/CHF Weekly Outlook
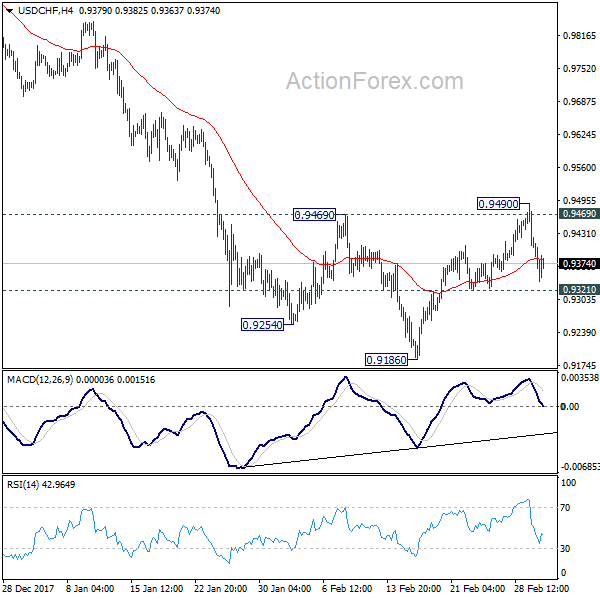
USD/CHF rose to 0.9490 last week but failed to sustain above 0.9469 resistance and dropped sharply since then. With 0.9321 minor support intact, initial bias is neutral this week first. On the downside, break of 0.9321 will indicate completion of the rebound from 0.9186. Intraday bias will be turned back to the downside for 0.9186 first. Break will resume larger down trend to 0.9115 projection level. On the upside, break of 0.9490 will revive the case of near term reversal and turn outlook bullish.
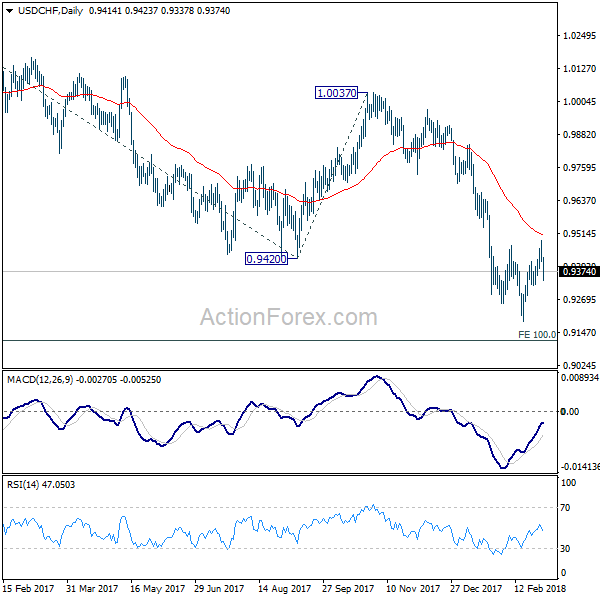
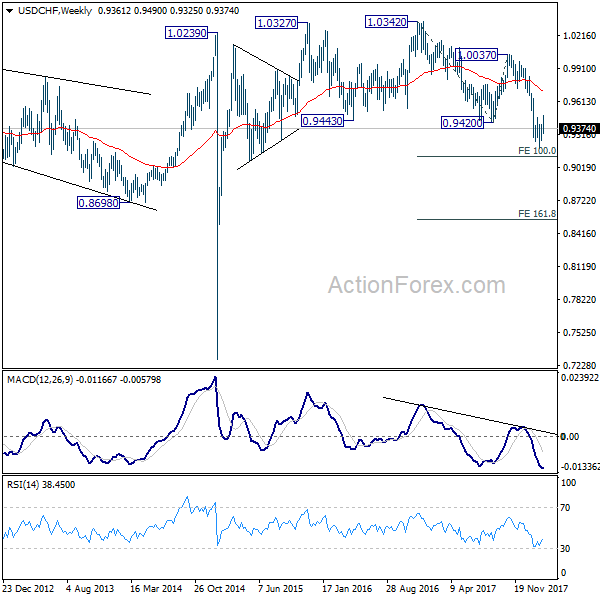
In the bigger picture, fall from 1.0342 is seen as a medium term down trend. Deeper decline should be seen to 100% projection of 1.0342 to 0.9420 from 1.0037 at 0.9115. Break will target 161.8% projection at 0.8545. In any case, sustained trading above 55 day EMA is needed to be the first sign of medium term reversal. Otherwise, outlook will stay bearish even in case of strong rebound.
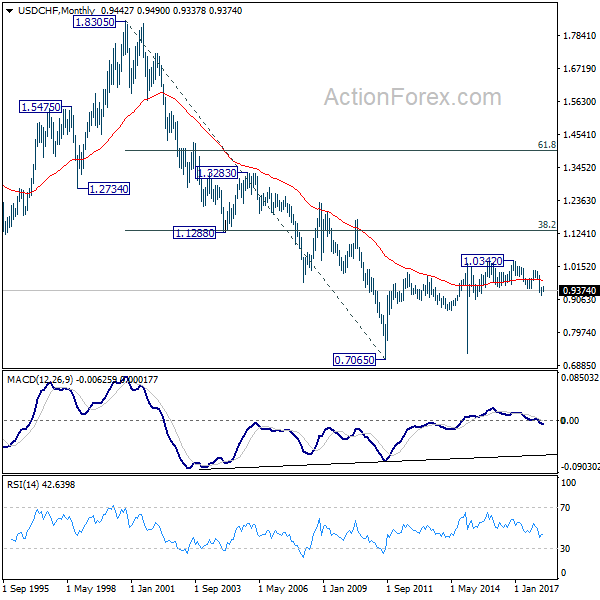
In the long term picture, the strong break of 0.9420 support and downside acceleration turns the long term outlook rather bearish. Corrective rebound from 0.7065 (2011 low) could have already completed at 1.0342. 0.8698 support will be a key level to watch. Sustained break there could bring retest of 0.7065.
AUD/USD Weekly Outlook
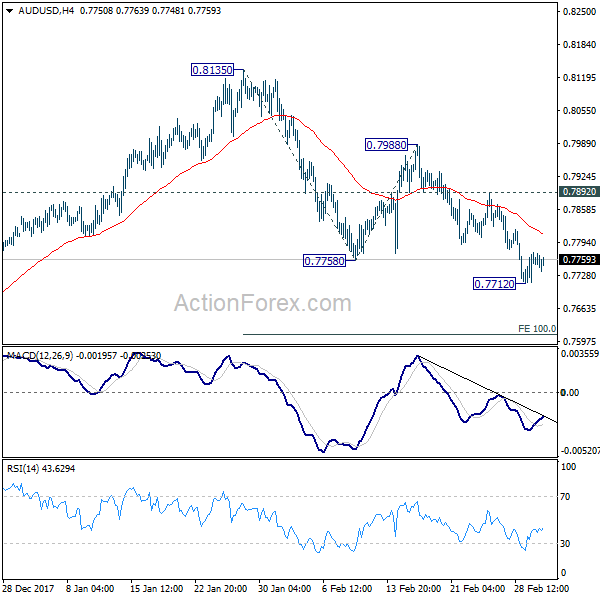
AUD/USD's fall from 0.8135 resumed by taking out 0.7758 and reached as low as 0.7712. As a temporary low was formed, initial bias is neutral this week first. Near term outlook remains bearish as long as 0.7892 resistance holds. Below 0.7712 will target 100% projection of 0.8135 to 0.7758 from 0.7988 at 0.7611.
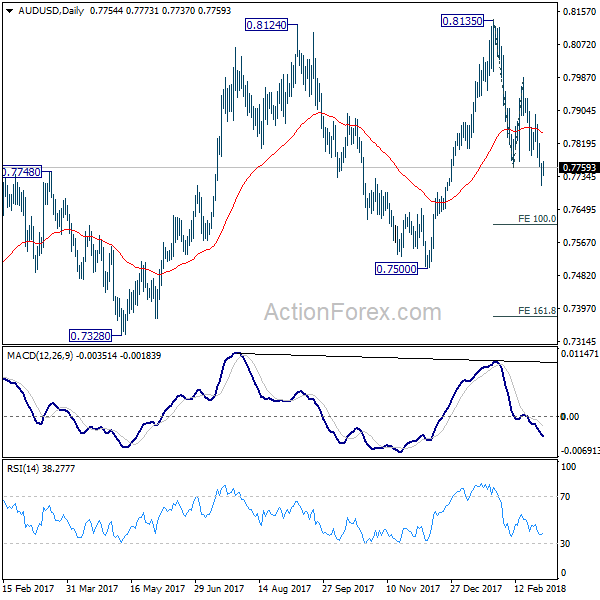
In the bigger picture, medium term rebound from 0.6826 is seen as a corrective move. It might still extend higher but we'd expect strong resistance from 38.2% retracement of 1.1079 to 0.6826 at 0.8451 to limit upside to bring long term down trend resumption. On the downside, break of 0.7500 support will now be an important signal that such corrective rebound is completed.
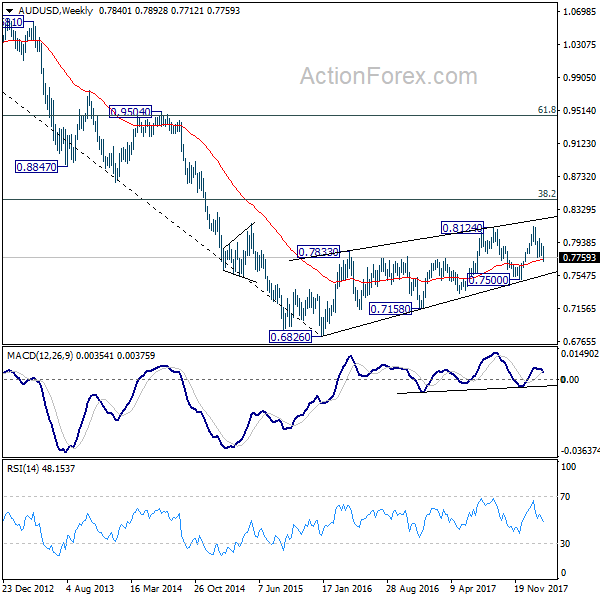
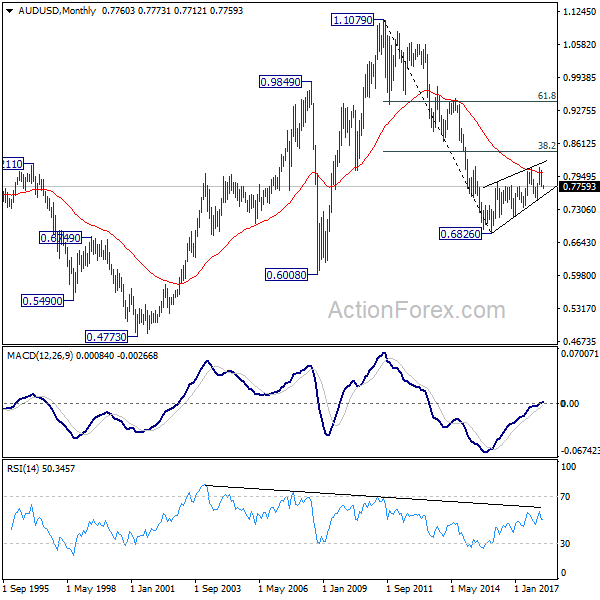
In the longer term picture, 0.6826 is seen as a long term bottom. Rise from there could either reverse the down trend from 1.1079, or just develop into a corrective pattern. At this point, we're favoring the latter. And, as long as 38.2% retracement of 1.1079 to 0.6826 at 0.8451 holds, we'd anticipate another decline through 0.6826 at a later stage. But strong support should be seen between 0.4773 (2001 low) and 0.6008 (2008 low).