Sample Category Title
Technical Outlook: SPOT GOLD – Action Is Directionless Ahead Of Fed Chair Powell Testimony
Spot Gold trades in directionless mode on Tuesday, with the action being so far shaped I Doji candle.
Strong upside rejection at $1341and daily close below a cluster of daily MA’s (10/20/30 SMA, laying between $1333 and $1337 was negative signal, but limited downside action was seen so far. mentum studies are bullish).
Directionless near-term mode is supported by mixed daily studies (MA’s are in negative setup, while momentum studies are bullish).
Overall action remains underpinned by rising and widening daily cloud (cloud top lies at $1314), but recovery from $1320 (22 Feb trough) was so far limited and lacks stronger bullish signal on close above cracked Fibo 38.2% of $1361/$1320 downleg ($1336).
Traders are focusing on today’s testimony of Fed Chairman Jerome Powell, which could generate fresh signals for the greenback.
Stronger wording about increasing pace of rate hikes in 2018 would be supportive for dollar and deflate yellow metal’s price, while softer tone from Powell would have negative impact on US currency and would boost Gold’s price.
Session low at/hourly cloud base mark initial support at $1331, followed by $1326 zone (lows of 26/23 Feb) which guard $1320 trough.
Fibo 38.2% resistance at $1336 is reinforced by daily Kijun-sen and marks the first pivot ahead of $1341 (Mon high/daily Tenkan-sen) and $1346 (Fibo 61.8% of $1361/$1320).
Res: 1336, 1341, 1346, 1348
Sup: 1331, 1326, 1320, 1317
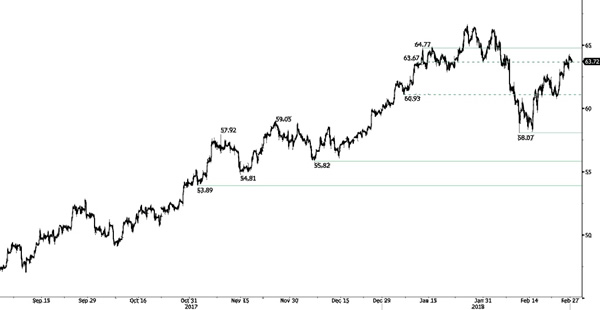
CRUDE OIL Consolidation
Crude oil upward trend is momentarily interrupted slightly below hourly resistance at 64.77 (11/01/2018 high) and is maintained at 63.60. Crude oil hourly support remains at 58.07 (09/02/2018 low). The technical structure suggests short-term sideway moves.
In the long-term, crude oil has recovered after its sharp decline last year. However, we consider that further weakness is very likely. For the time being, the pair lies in an upside trend since June 2017. Support lies at 42.20 (16/11/2016) while resistance is located at 77.83 (20/11/2014). Crude oil is trading largely above its 200 DMA.
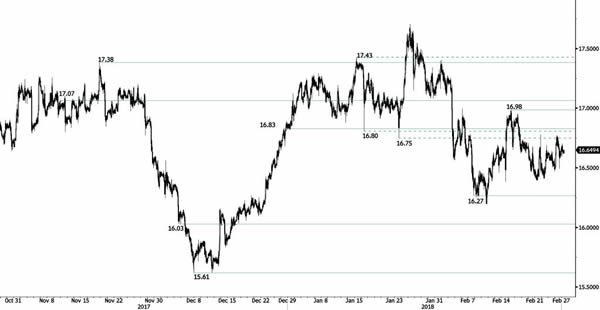
SILVER Declining
Silver is trading lower following a hike at 16.77 (26/02/2018), suggesting further short-term decline. Hourly support and resistance are given at 16.27 (07/02/2018 low) and 16.98 (15/02/2018).
In the long-term, the trend remains negative/ sideways. Further downside is very likely. The pair is trading below its 200 DMA. Resistance is located at 21.58 (10/07/2014 high). Strong support can be found at 11.75 (20/04/2009).
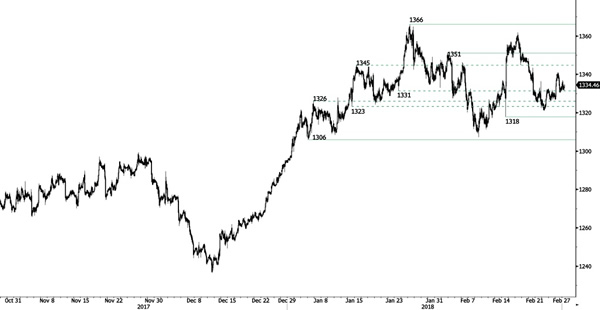
GOLD Stabilizing At 1333
Gold is trading lower following recent selling pressures, declining from 1341 high (26/02/2018). Hourly support and resistance are given at 1318 (14/02/2018 low) and 1351 (01/02/2018 high). The technical structure suggests further sideway moves.
In the long-term, the technical structure suggests that there is a growing upside momentum. A break of 1'392 (17/03/2014) is required to confirm it. A major support can be found at 1'045 (05/02/2010 low).
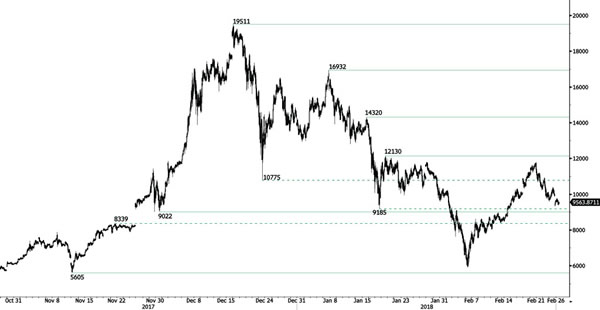
BITCOIN Riding Higher
Bitcoin recovers from recent decline below 9390, edging higher along 11500. Hourly support and resistance at 9022 (30/11/2018 low) and 12130 (18/01/2018 high) remain.
In the long-term, the digital currency has had an exponential growth but also presented important downturns. There is decent likelihood that the currency could stabilize between 7'000 - 12'000 in 2018. Bitcoin is trading above its 200 DMA (6'500 range).
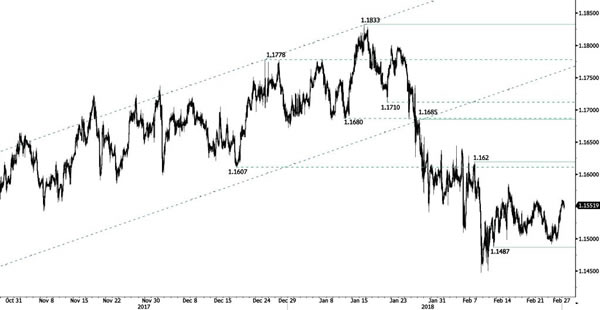
EUR/CHF Strengthening
EUR/CHF is consolidating at the 1.155 range after rising from 1.1496 low (26/02/2018). The pair is trading between hourly support and resistance given at 1.1487 (12/02/2018 low) and 1.162 (07/02/2018 high). The technical structure suggests short-term sideway moves.
In the longer term, the technical structure has reversed. Strong resistance is given at 1.20 (level before the unpeg). Yet, the ECB's slowing QE program is likely to cause buying pressures on the euro, which should weigh in favour of the EUR/CHF. Support can be found at 1.0234 (20/04/2015 low).
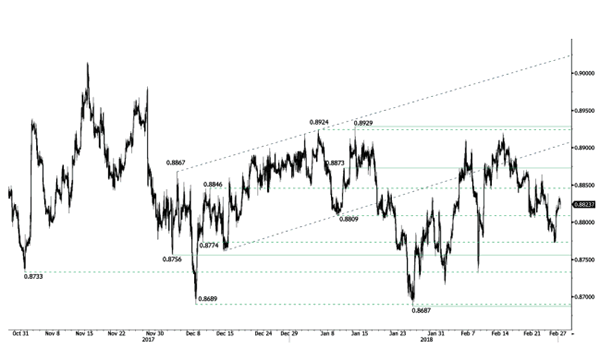
EUR/GBP Bouncing Higher
EUR/GBP resurgence above 0.882 slowly decreases, heading for 0.88. Hourly support is given at 0.8756 (04/12/2017 low) while hourly resistance remains at 0.8873 (10/01/2018 high). The technical structure suggests short-term downside moves.
In the long-term, the pair has largely recovered from 2015 lows. The technical structure suggests further upside pressure. Strong resistance can be found at 0.9500 (psychological level) while support remains at 0.8304 (05/12/2016 low). The pair is trading below its 200 DMA.
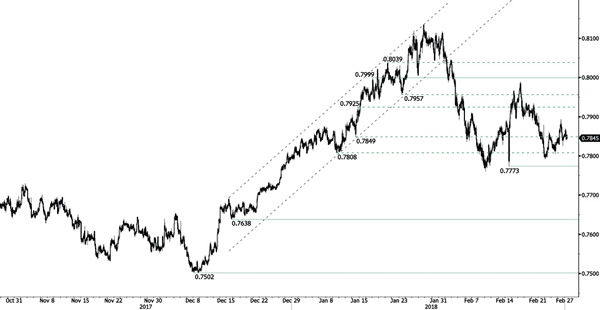
AUD/USD Weakening
AUD/USD recovery falters, the pair is heading lower along the 0.78 range. AUD/USD currently trades along hourly support and resistance at 0.7773 (14/02/2018 low) and 0.7999 (17/01/2018 high). The short-term technical structure suggests further downside moves.
In the long-term, the upward trend slows down after failing to reach key resistance at 0.8164 (14/05/2015 low). Key support stands at 0.6009 (31/10/2008 low). A break of the key resistance at 0.8164 (14/05/2015 high) is needed to invalidate our long-term bearish view.
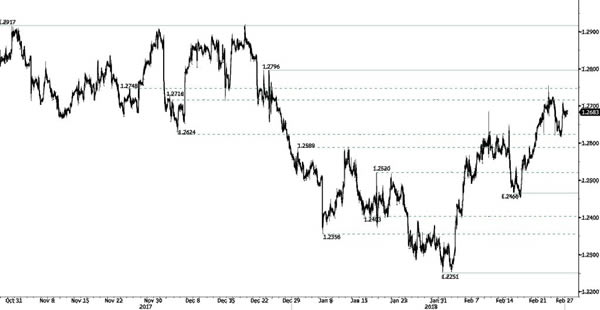
USD/CAD Sideways Trading
USD/CAD recent bounce brings the pair back to the 1.27 range, where it is currently stabilized. January upward pattern is maintained, approaching hourly resistance at 1.2796 (25/12/2017 high). Hourly support is maintained at 1.2466 (15/02/2018 low). The technical structure indicates that continued rise is expected in the short-term.
In the longer term, the pair is trading between resistance point at 1.3805 (05/05/2017 high) and support at 1.2128 (18/06/2015 low). Strong resistance is given at 1.4690 (22/01/2016 high). The pair is likely to head lower. The pairs is trading at its 200 DMA.
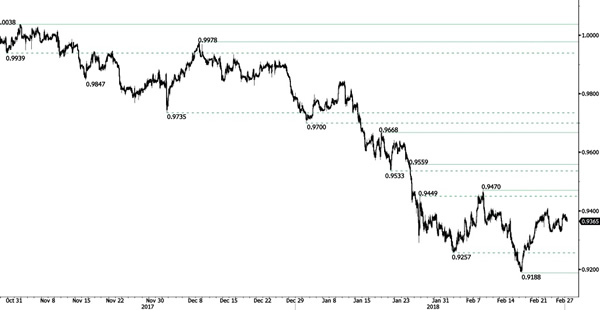
USD/CHF Approaching 0.94
USD/CHF sideways trading is maintained but presents potential for further rise along hourly resistance at 0.9470 (08/02/2018 high). Hourly support remains at 0.9188 (16/02/2018 low). The technical structure suggests short-term increase.
In the long-term, the pair is still trading in range since 2011 despite some turmoil when the SNB unpegged the CHF. Key support lies at 0.9072 (07/05/2015 low) while resistance at 1.0344 (15/12/2016 high) is distanced. The technical structure favours a long term bullish bias since the unpeg in January 2015.