
Sample Category Title
German Business Climate Report and Elections
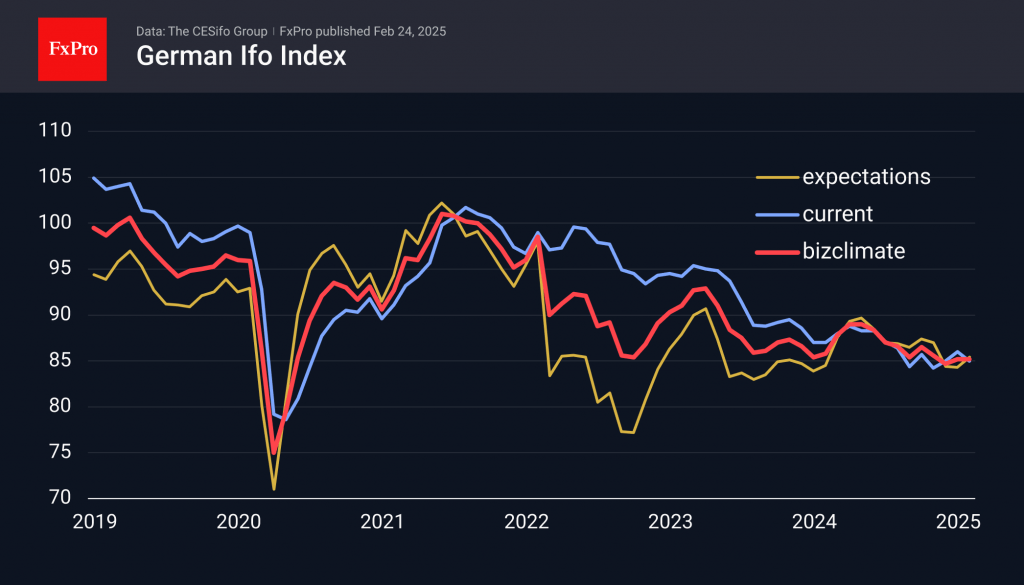
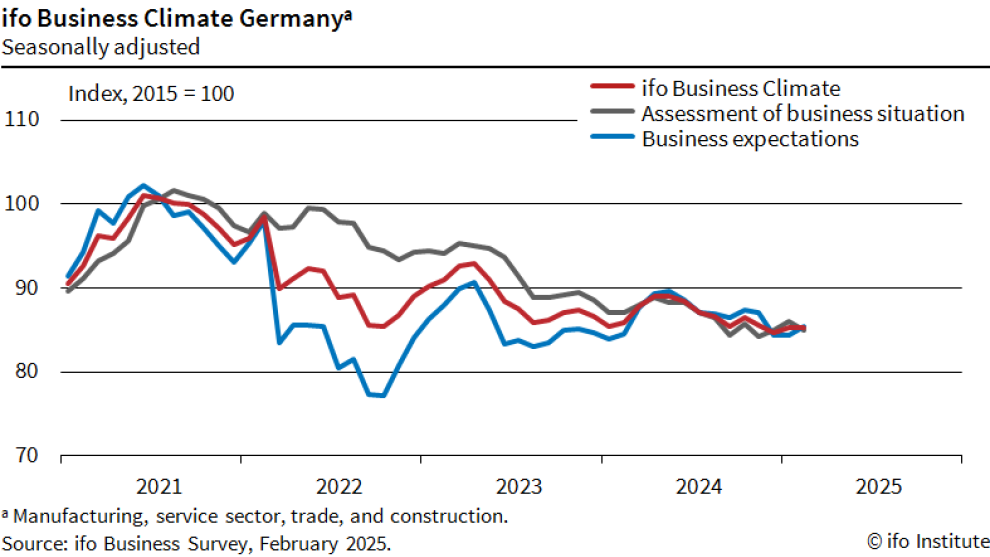
According to the latest Ifo report, the German business climate remained unchanged in February. The business climate index stayed at 85.2, with a deterioration in the assessment of the current situation offset by an increase in the expectations component. It is also noted that for almost a year, the index components have nearly converged into a single line, with all three slowly declining.
On average, market analysts anticipated positive development, so the outcome led to some pressure on the single currency, which fell below $1.05. Over the weekend, Germany’s parliamentary elections largely aligned with expectations, confirming the transition of power from Scholz to Merz. The latter announced a course of “independence from the US.”
The far-right AfD party came in second with 21% of the vote, but other parties declined to form a coalition with it, thus significantly reducing its influence. Markets reacted moderately positively to the election results, with EURUSD and the German DAX40 opening the day higher. However, a more cautious reading on business sentiment limited these gains.
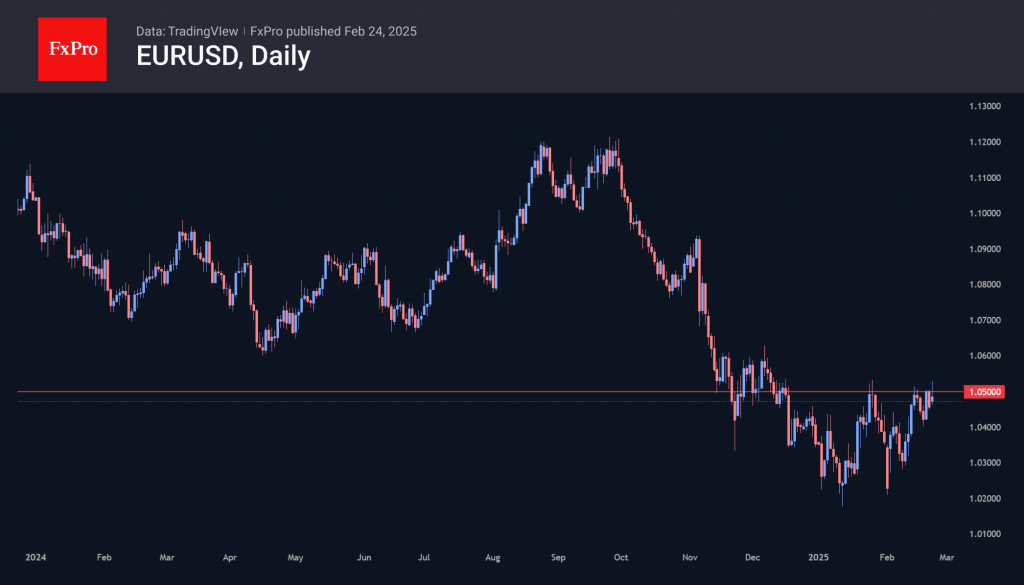
From a technical perspective, the EURUSD continues to encounter significant resistance at 1.05. A break below this level at the end of last year indicated a market shift towards a possible decline below parity. In January and February, the euro attempted to rise above this level but has so far encountered resistance.
GOLD (XAUUSD) Elliott Wave: Forecasting the Rally from the Equal Legs Area
Hello traders ! In this technical article, we’re going to take a quick look at the Elliott Wave charts of GOLD (XAUUSD ) , published in the members area of the website.
As our members know, XAUUSD has been showing impulsive bullish sequences in the cycle from 2579.36. We continue to favor the long side in this commodity. Recently, GOLD pulled back and found buyers at the equal legs area.
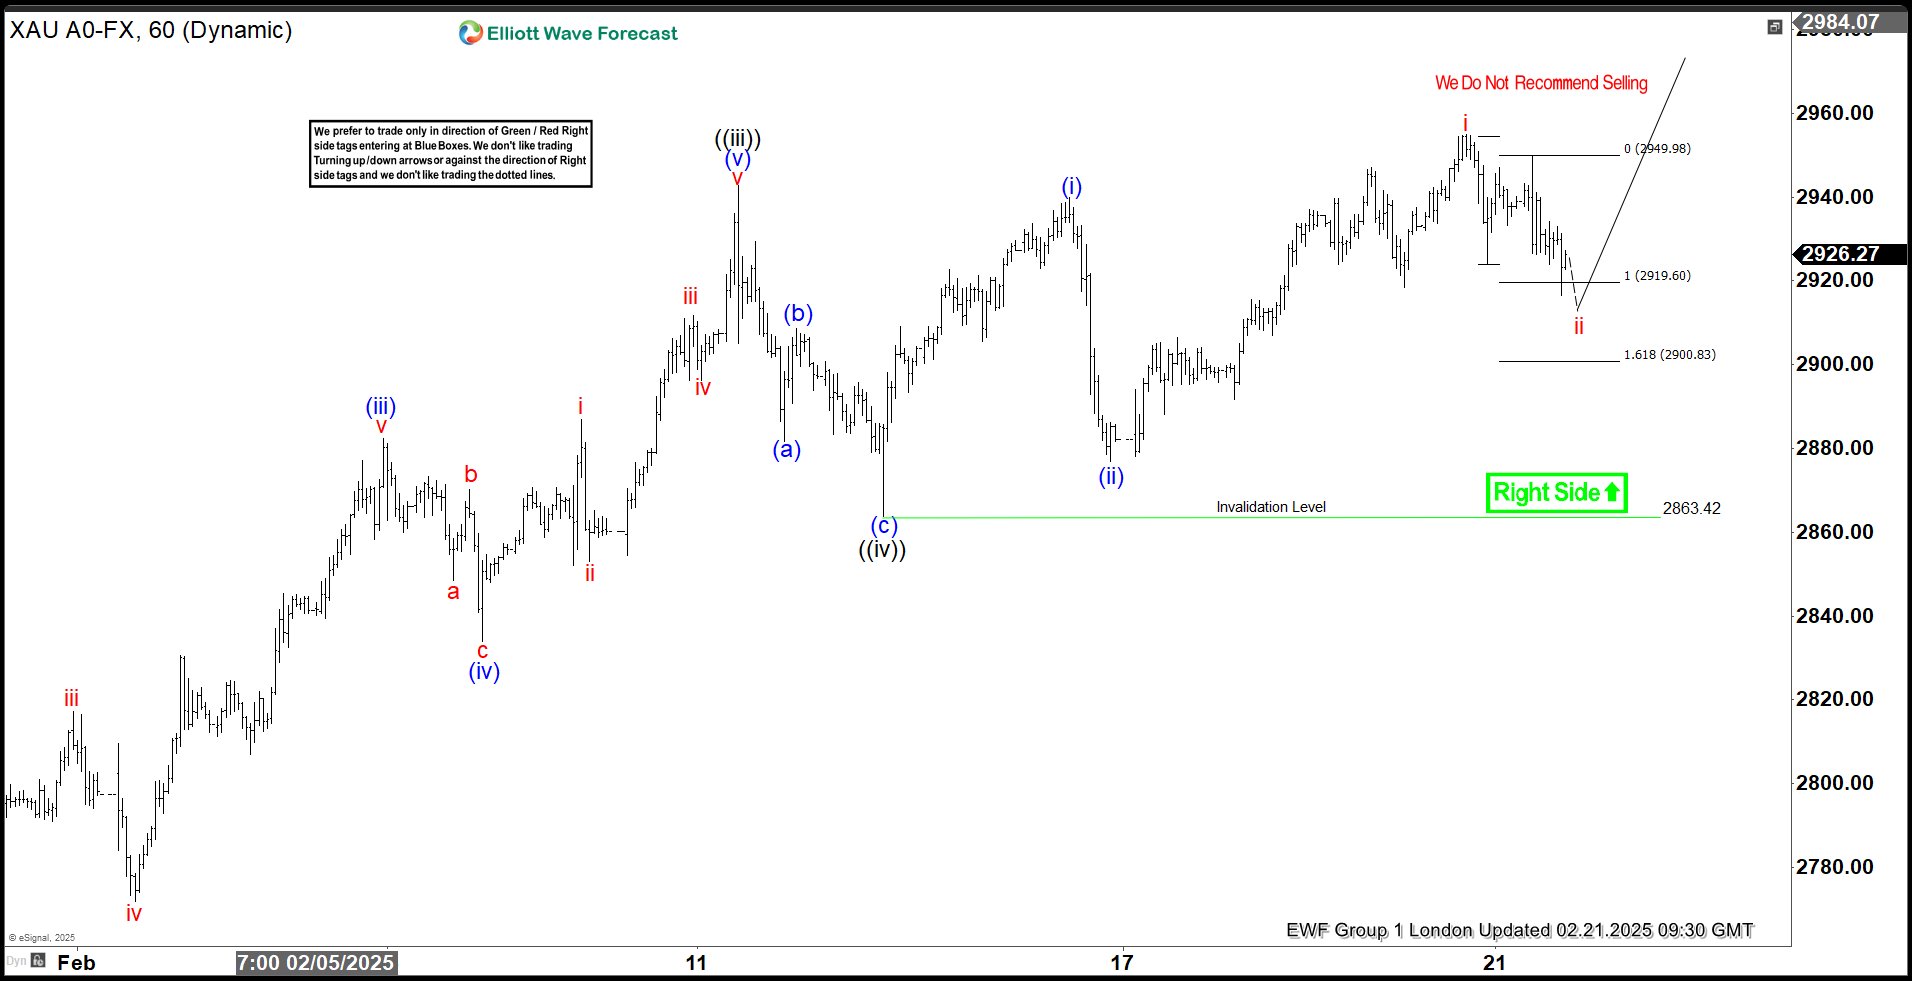
GOLD (XAUUSD) Elliott Wave 1 Hour Chart 02.21.2025
GOLD remains bullish as long as it holds above the 2863.42 pivot in the first degree. Currently, it is showing three waves down from the peak, reaching the extreme zone at 2919.6–2900.83. We expect buyers to step in at this area, leading to either a continuation toward new highs or at least a three-wave bounce.
90% of traders fail because they don’t understand market patterns. Are you in the top 10%? Test yourself with this advanced Elliott Wave Test
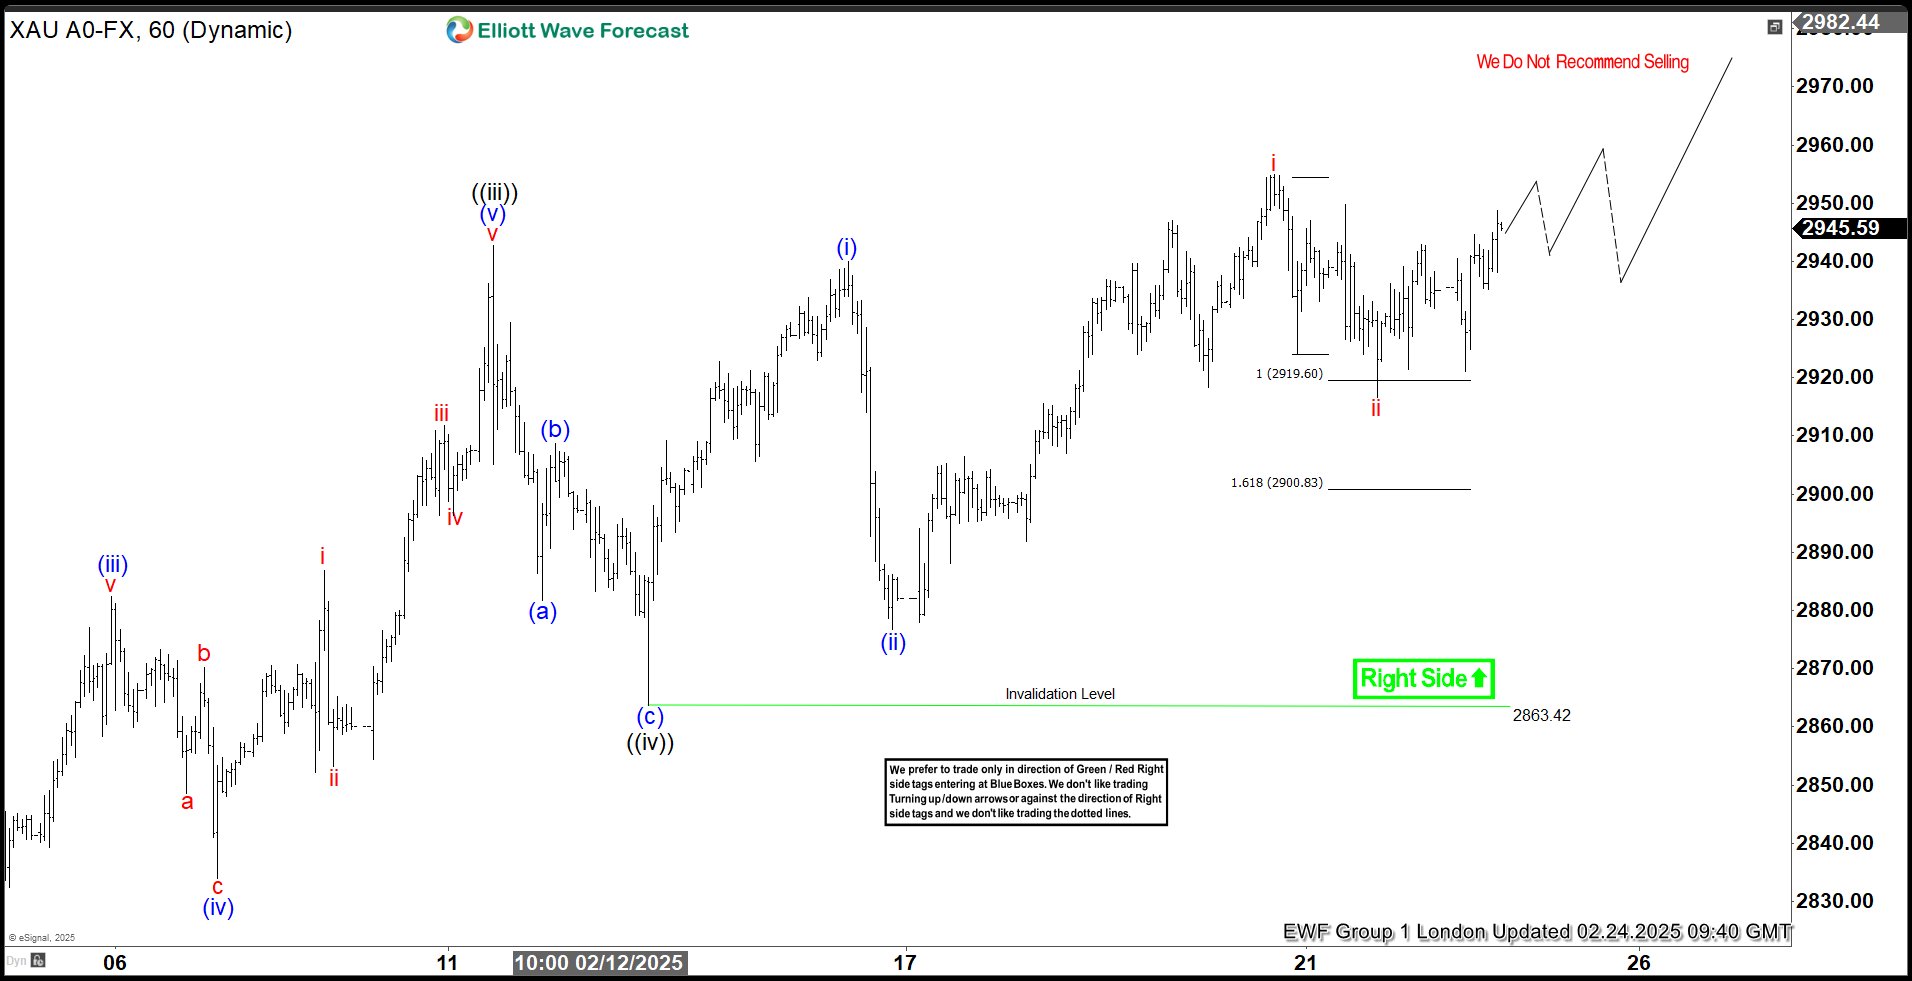
GOLD (XAUUSD) Elliott Wave 1 Hour Chart 02.21.2025
GOLD is showing us nice reaction from the equal legs area (2919.6–2900.83) . The commodity completed 3 waves down at the 2917.16 low. As expected, buyers stepped in, pushing prices higher. Now, we’d like to see a break above the February 20th peak to confirm further upside extension. A break above this level would open the door for a potential move toward the 2994.7+ area.
New Zealand Dollar Steady as Retail Sales Sparkle
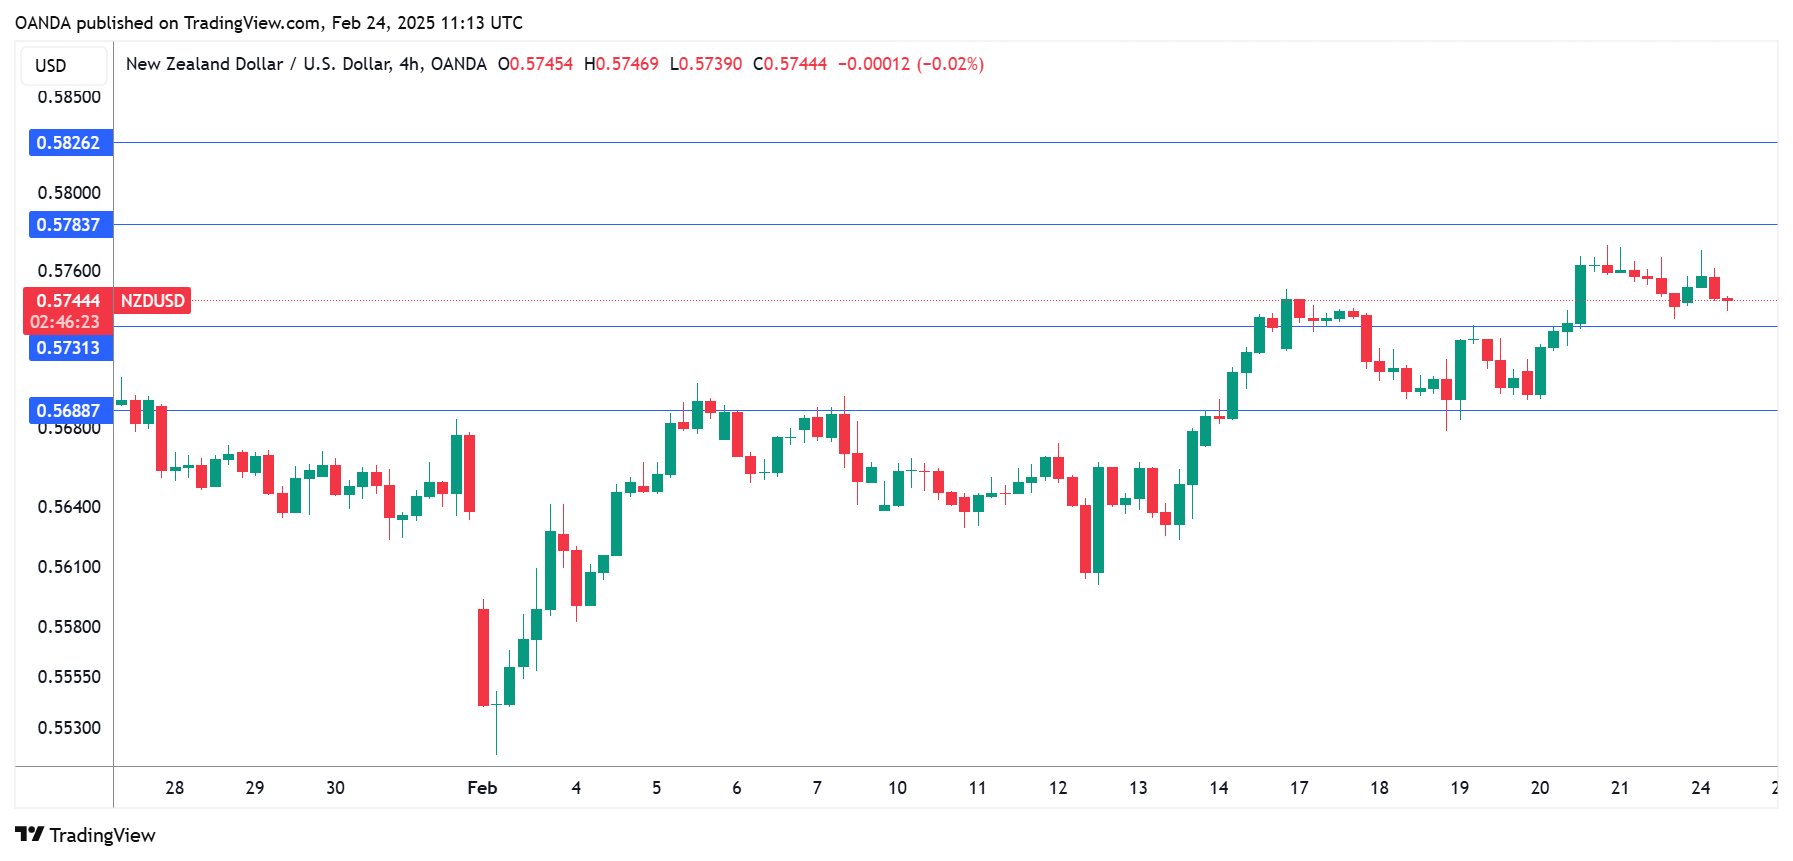
The New Zealand dollar is showing little movement on Monday. NZD/USD is trading at 0.5745 in the European session, up 0.07% on the day.
NZ retail sales hit 3-year high
The week started on a high note in New Zealand, as retail sales jumped 0.9% q/q in the fourth quarter of 2024, after a revised flat reading in the third quarter and above the market estimate of 0.6%. This was the strongest gain in three years. Most sub-categories posted gains as the improvement was felt across the economy. Annually, retail sales posted a small gain of 0.2% in the fourth quarter following a 2.2% decline in Q3. This was the first gain since Q3 of 2022.
The strong impressive rebound in retail sales is a sign that lower interest rates are filtering through the economy and boosting weak growth. The Reserve Bank of New Zealand has been aggressive, chopping rates by 50 basis points in October, November and February. The cash rate is down to 3.75%, its lowest level since Oct. 2022. Consumers are showing improved confidence due to lower borrowing costs and are opening up the purse strings.
The Reserve Bank of New Zealand plans to continue cutting rates but in a more gradual fashion. Governor Adrian Orr signaled at last week’s meeting that he expects to cut rates by 25 basis points in both April and May, provided that economic conditions evolve as projected.
In the US, the Services PMI for February surprised on the downside and contracted to 49.7, down from 52.9 in January and below the market estimate of 53.0. This marked the lowest level since January 2023. The services sector, which has been the major driver of the US economy, showed strong growth until the end of 2024 and has weakened for two straight months. The Manufacturing PMI improved to 51.6, up from 51.2 and above the market estimate of 51.5.
NZD/USD Technical
- 0.5731 is a weak support level. Below, there is support at 0.5688
- 0.5783 and 0.5826 are the next resistance lines
Eurozone CPI finalized at 2.5% in Jan, core CPI holds at 2.7%
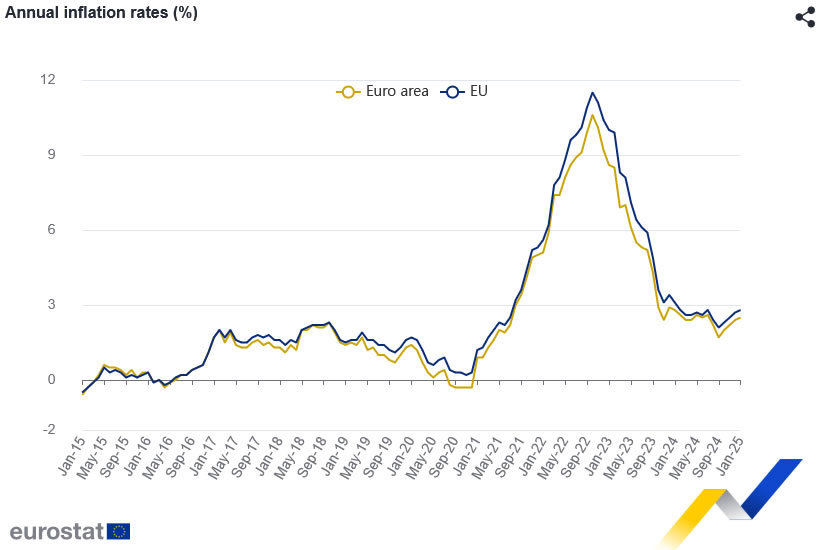
Eurozone headline inflation was finalized at 2.5% yoy in January, ticking up from 2.4% yoy in December. Core CPI, which excludes energy, food, alcohol, and tobacco, remained unchanged at 2.7% yoy.
The largest contributor to Eurozone inflation was the services sector, which added 1.77 percentage points (pp) to the overall rate. Food, alcohol, and tobacco contributed 0.45 pp, while energy added 0.18 pp, and non-energy industrial goods accounted for 0.12 pp.
At the EU level, CPI was finalized at 2.8% yoy. The lowest inflation rates were seen in Denmark (1.4%), Ireland, Italy, and Finland (all 1.7%), indicating softer price pressures in some core economies. On the other hand, Hungary (5.7%), Romania (5.3%), and Croatia (5.0%) recorded the highest inflation levels, underlining regional imbalances in price stability.
Compared to December, inflation fell in eight EU member states, remained unchanged in four, and rose in fifteen.
Crypto Bounces Ever Lower
Market Picture
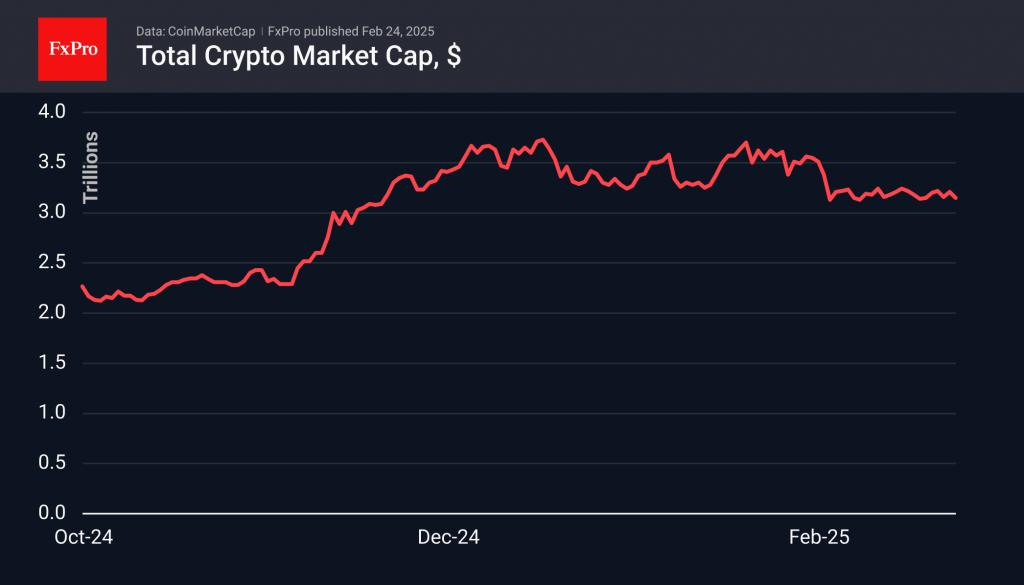
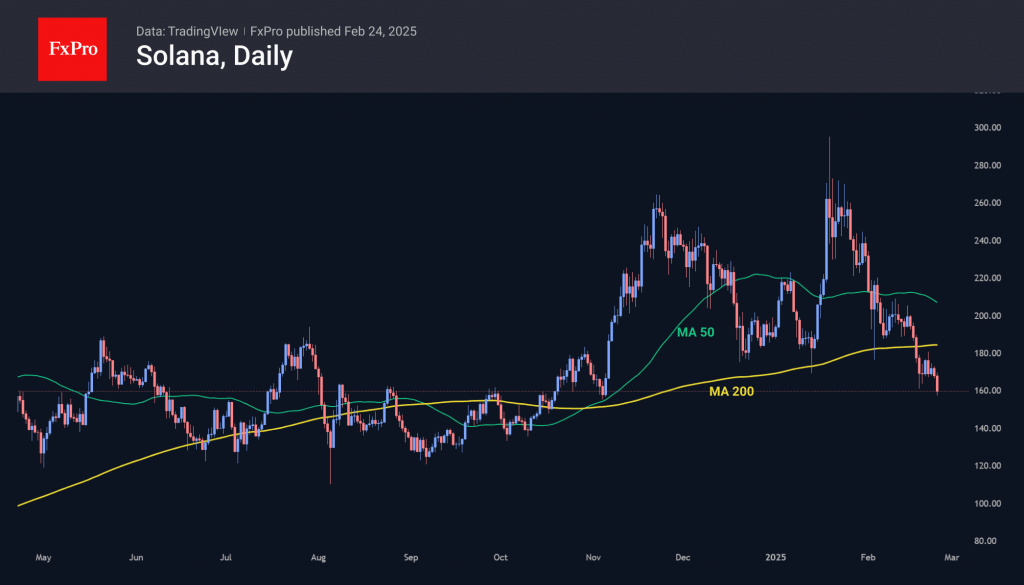
Bitcoin continues to move strictly to the side, while the crypto market dynamics generally resemble a bouncing ball, getting lower and lower over time. The local resistance has moved to the $3.20 trillion area, while the lower boundary has remained near $3.10 trillion for the last three weeks. Thus, the market is accumulating risks that we will get a compressed spring effect with a sharp move in one direction in the coming days.
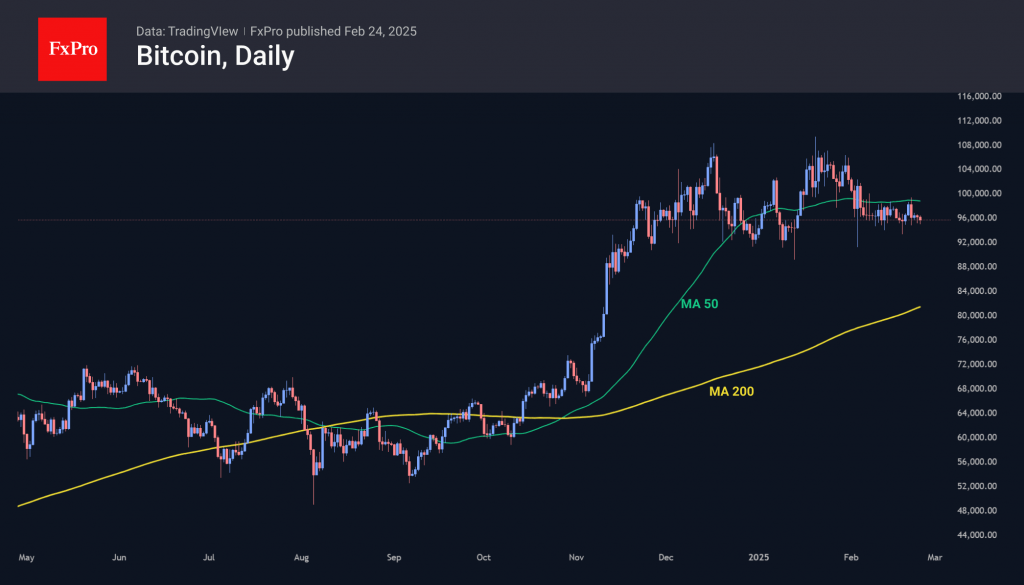
Bitcoin unsuccessfully tested the 50-day moving average near $98.5K on Friday once again, staying under it for the past 19 days but not going below $94.0K. It is noteworthy that the first cryptocurrency held its technical levels on Monday at the opening of financial markets in Europe, while the largest altcoins are losing ground. The latter’s dynamics are likely to be negatively impacted by cryptocurrency exchanges’ trust issues after Friday’s hack of Bybit’s wallet, even though the platform covered ETH’s shortfall relatively quickly.
The tech analysis paints a heavy picture for Solana, whose price has fallen to $157, its lowest since early November.
News Background
According to SoSoValue, net outflows from spot bitcoin-ETFs declined to $559.4 million for the week. In comparison, cumulative inflows since the approval of bitcoin-ETFs in January 2024 fell to $39.56 billion (-1.4% for the week). Net inflows into the ETH-ETF totalled a paltry $1.6 million for the week after a small outflow of $26.3 million a week earlier. Cumulative net inflows from ETF launches in July were unchanged at $3.15 billion.
The Bybit exchange lost $1.46 billion because of the hack. The Bybit CEO emphasised that only one multi-signature cold wallet was affected; the rest of the funds are fine. The attackers used a sophisticated transaction spoofing method to gain full control of the assets.
Venture capitalist, millionaire investor and founder of blockchain company Card1Ventures Gary Cardone announced his complete exit from the XRP cryptocurrency (at $2.71). According to him, he was driven by professional instincts.
Santiment believes that the average rate of return of wallets, the decrease in the number of “sleeping” coins and the volume of available bitcoins on exchanges indicate the rapid growth of the rate of the first cryptocurrency.
The spot Litecoin-ETF proposed by Canary Capital in January appeared on the Financial Services Clearing and Settlement Company’s (DTCC) asset list. Previously, such a procedure preceded the launch of the product.
EUR/USD Bulls Await Rescue Above 1.0500
- EURUSD stages a flash spike to 1.0527 in German election aftermath.
- Technical signals favor the bulls, but traders await victory above 1.0500.
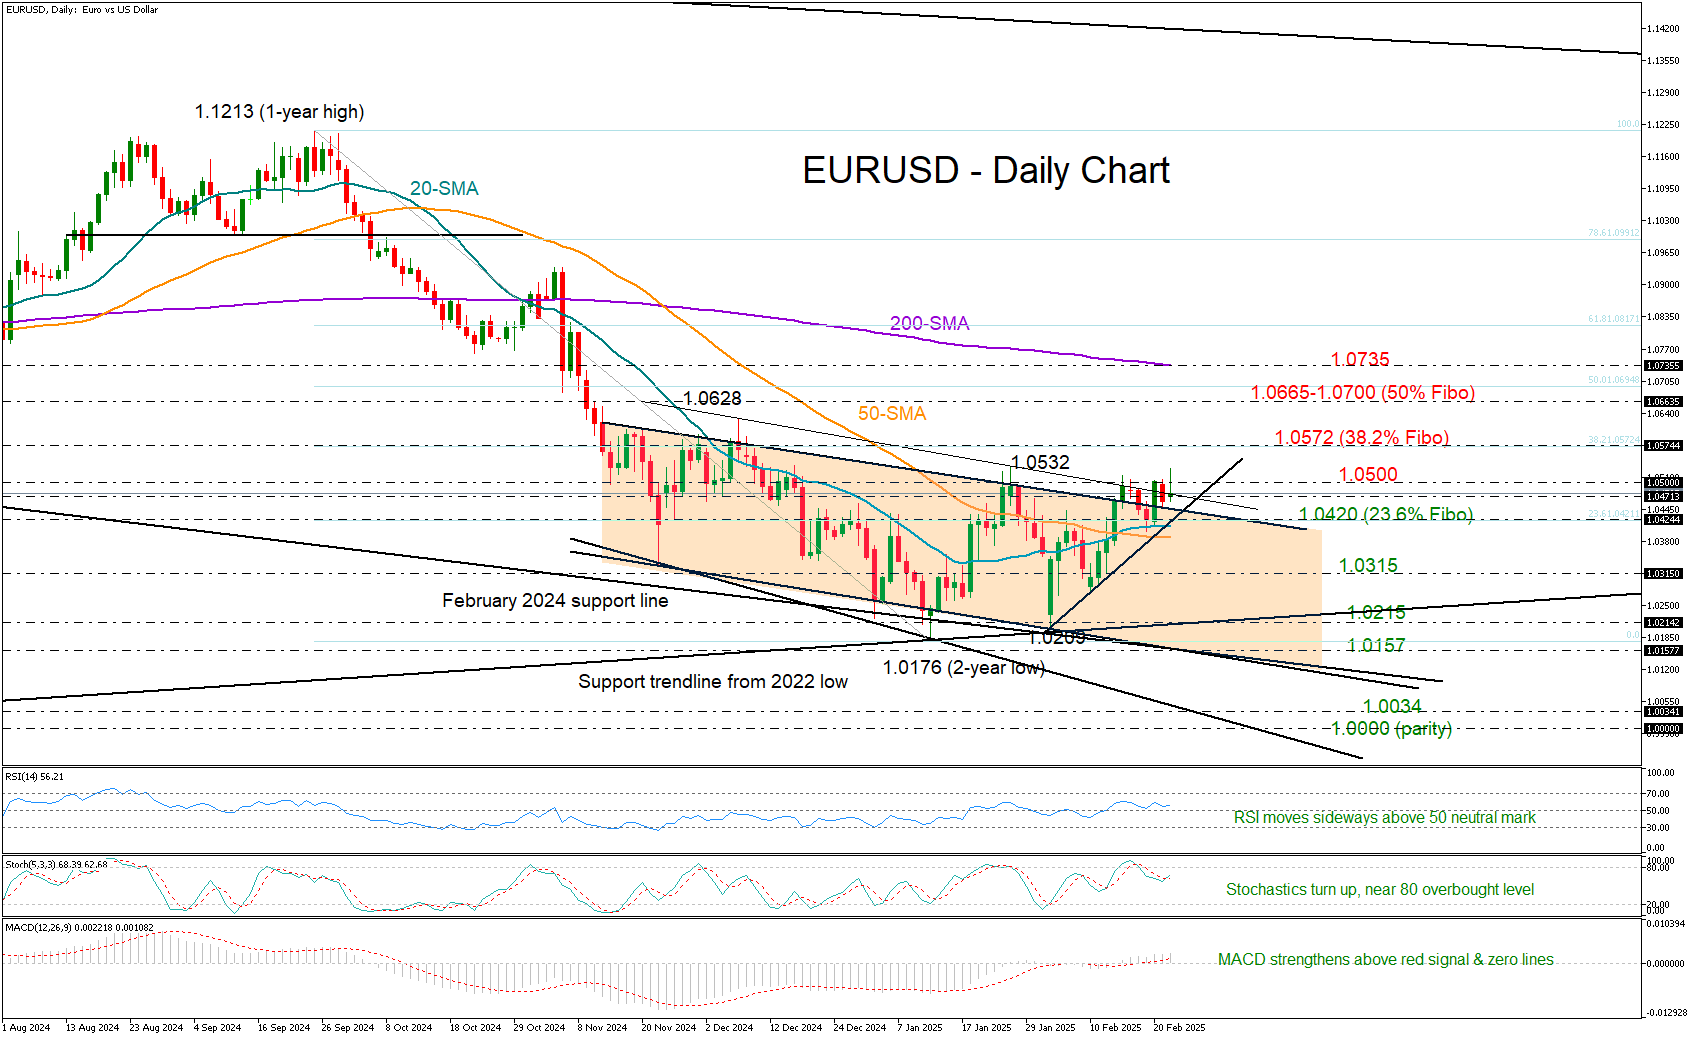
EURUSD is still struggling to secure a close above the 1.0500 ceiling, having briefly violated that threshold earlier today before losing steam marginally beneath January’s high of 1.0532 after the conservative CDU/CSU leader Friedrich Merz won Sunday’s election in Germany.
From a technical perspective, the short-term outlook remains bullish-to-neutral, with the RSI holding above its 50 mark and the stochastic oscillator pointing slightly higher but still below overbought levels. The MACD's momentum is positive, and a bullish crossover between the 20- and 50-day simple moving averages (SMAs) suggests buying interest is growing.
Given the support created within the trendline zone of 1.0450-1.0475, there is potential for an acceleration towards the 38.2% Fibonacci retracement of the September-January downleg at 1.0572 once the 1.0500 psychological level gives the green light. Further up, the bulls could speed up towards the 1.0665 barrier and the 50% Fibonacci mark of 1.7000, while the 200-day SMA could also come into play.
On the downside, the area around the 23.6% Fibonacci level of 1.0420, the 20-day SMA and the short-term support trendline could be critical for keeping buying appetite alive. If that floor collapses, the pair could forcefully drop towards 1.0315 and then straight down to the long-term ascending trendline drawn from the 2022 low at 1.0215. The lower boundary of the bearish channel at 1.0157, aligning with the falling trendline from February 2024, could serve as the next safety net.
In a nutshell, EURUSD has not exited the caution area, despite the improvement in technical signals. A sustainable rally above 1.0500 could be key for a bullish continuation.
German Ifo unchanged at 85.2, businesses waiting to see how things develop
Germany’s Ifo Business Climate Index was unchanged at 85.2 in February, falling short of expectations for a rise to 85.8. The data reflects that businesses are still "skeptical" about the outlook, "waiting to see how things develop", according to the Ifo Institute.
Current Assessment Index dropped from 86.0 to 85.0, missing the forecasted 86.5. However, Expectations Index showed slight improvement, rising from 84.3 to 85.4, exceeding the consensus of 85.2.
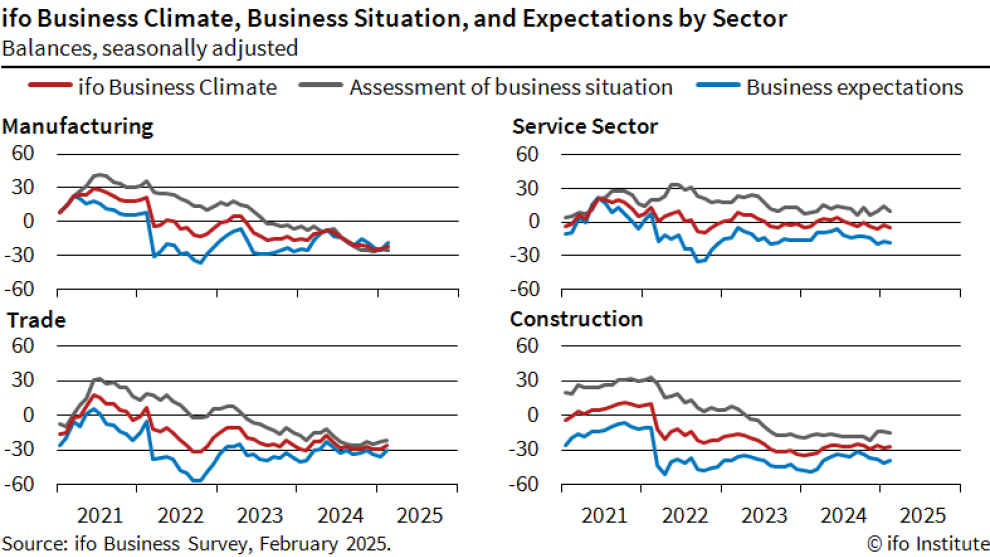
Sector-wise, the manufacturing index improved from -24.8 to -22.1, and trade sentiment rebounded from -29.5 to -26.2. The construction sector also saw a marginal improvement, rising from -28.1 to -27.6. However, services weakened, falling from -2.2 to -4.3.
EUR/USD Chart Analysis: Exchange Rate Hits Highest Level Since Early February
The EUR/USD chart shows the euro rising above its previous February peak of 1.05155, set on the 14th.
On one hand, the euro's strength is driven by Germany’s national elections over the weekend, where the opposition conservatives, led by Friedrich Merz, secured victory as expected. Investors are now focused on how quickly Merz’s party can form a coalition government to implement much-needed economic reforms.
On the other hand, the US dollar index has fallen to its lowest level since mid-December.
According to Reuters, the dollar’s weakness is influenced by:
→ Shifting market perceptions of its value amid Trump’s tariff policies in global trade.
→ Declining US Treasury yields due to expectations of further Fed rate cuts in 2025.
Technical Analysis of EUR/USD Chart
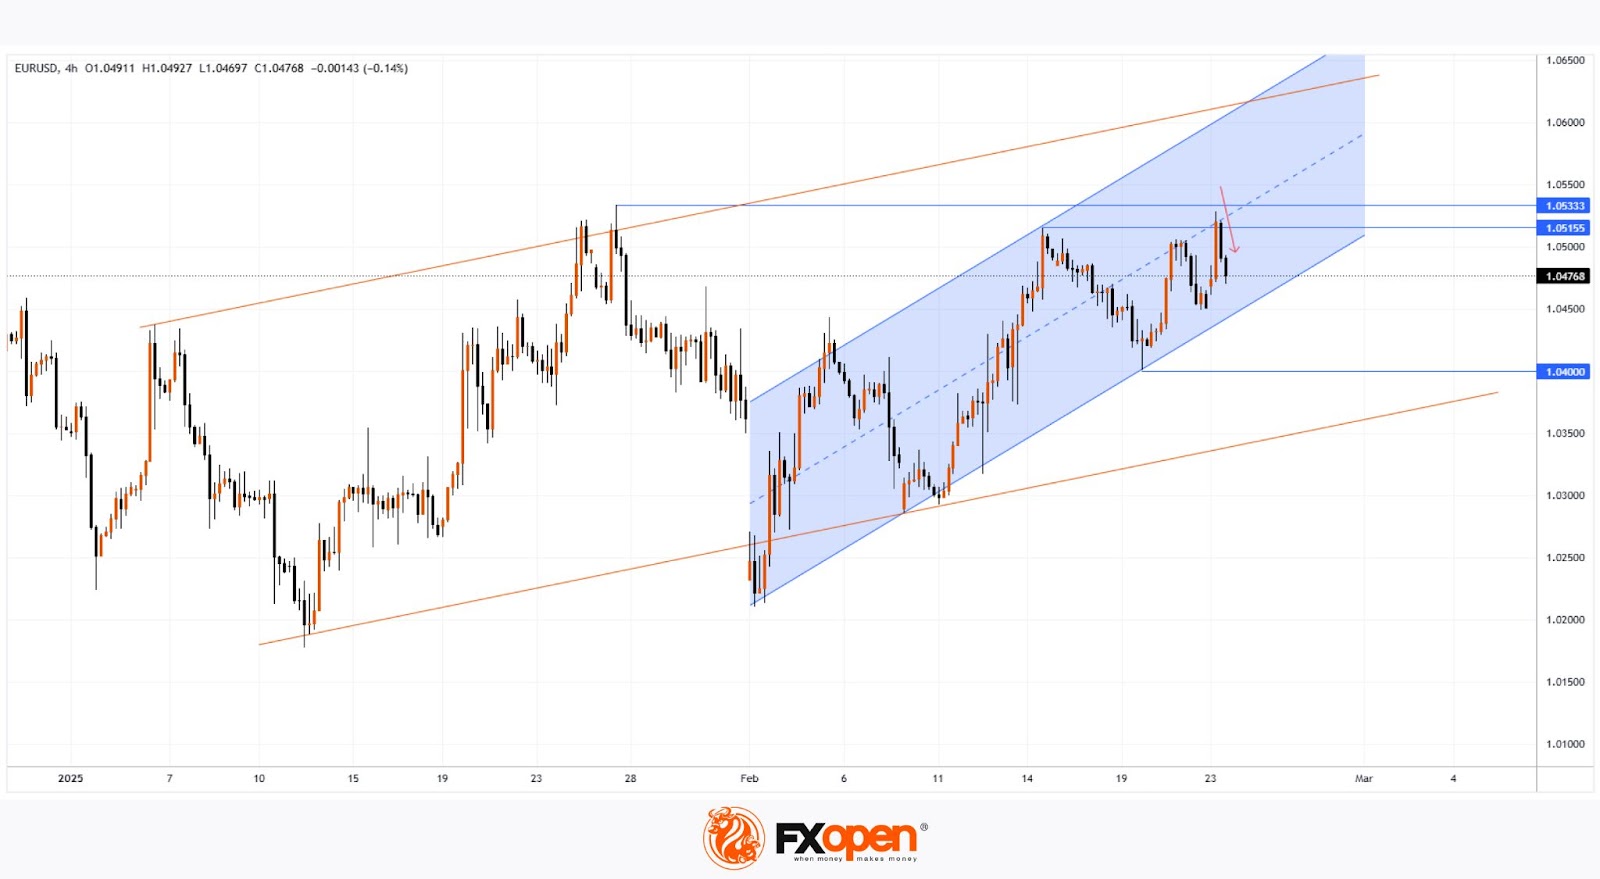
Price movements form an upward channel (marked in blue), but the red arrow highlights bearish activity near resistance levels at:
→ The yearly high around 1.05333.
→ The median line of the channel.
Given the lower liquidity at the start of trading, the initial breakout above the psychological 1.05000 level may have been false. Potential bearish pressure could push EUR/USD towards a support zone, including:
→ The 1.0400 level.
→ The lower boundary of a broader channel (marked in orange).
If bulls intend to maintain their February momentum, signs of buying activity may emerge near the lower boundary of the blue channel.
Trade over 50 forex markets 24 hours a day with FXOpen. Take advantage of low commissions, deep liquidity, and spreads from 0.0 pips. Open your FXOpen account now or learn more about trading forex with FXOpen.
This article represents the opinion of the Companies operating under the FXOpen brand only. It is not to be construed as an offer, solicitation, or recommendation with respect to products and services provided by the Companies operating under the FXOpen brand, nor is it to be considered financial advice.
AUD/USD and NZD/USD Hold Strong—Are More Gains Ahead?
AUD/USD is attempting a fresh increase from the 0.6350 support. NZD/USD is also rising and could aim for a move above the 0.5800 resistance.
Important Takeaways for AUD/USD and NZD/USD Analysis Today
- The Aussie Dollar found support at 0.6300 and recovered higher against the US Dollar.
- There is a connecting bullish trend line forming with support at 0.6365 on the hourly chart of AUD/USD at FXOpen.
- NZD/USD is consolidating above the 0.5720 support.
- There is a key bullish trend line forming with support at 0.5735 on the hourly chart of NZD/USD at FXOpen.
AUD/USD Technical Analysis
On the hourly chart of AUD/USD at FXOpen, the pair formed a base above 0.6300. The Aussie Dollar started a decent increase above the 0.6350 resistance against the US Dollar, as mentioned in the previous analysis.
The pair even cleared 0.6400 before there was a minor pullback. The recent low was formed at 0.6351 and the pair is again rising. The bulls pushed the pair above the 50% Fib retracement level of the downward move from the 0.6408 swing high to the 0.6351 low.
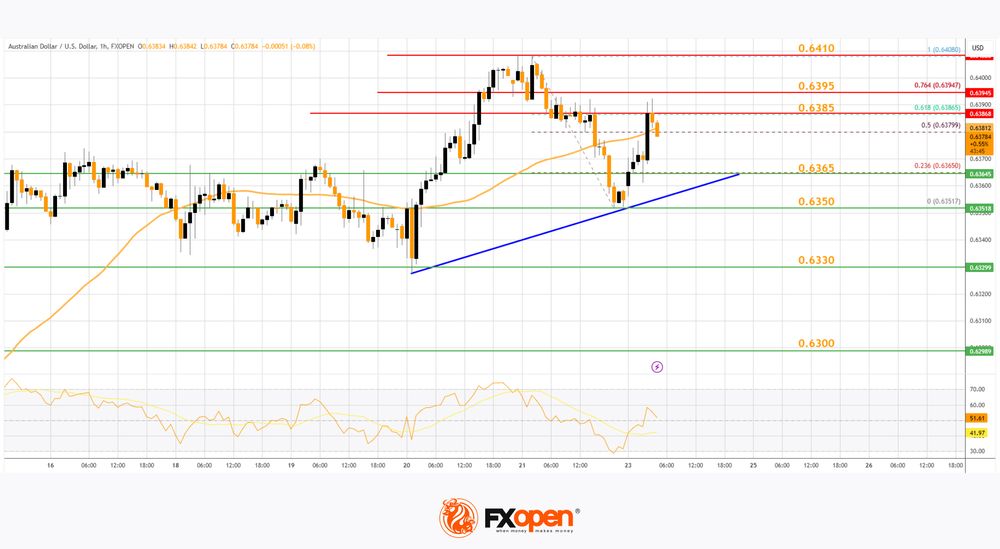
However, the pair is still below the 50-hour simple moving average. On the upside, the AUD/USD chart indicates that the pair is now facing resistance near the 0.6385 zone. It is close to the 61.8% Fib retracement level of the downward move from the 0.6408 swing high to the 0.6351 low.
The first major resistance might be 0.6395. An upside break above the 0.6395 resistance might send the pair further higher. The next major resistance is near the 0.6410 level. Any more gains could clear the path for a move toward the 0.6450 resistance zone.
If not, the pair might correct lower. Immediate support sits near the 0.6365 level. There is also a connecting bullish trend line forming with support at 0.6365.
The next support could be 0.6350. If there is a downside break below the 0.6350 support, the pair could extend its decline toward the 0.6330 zone. Any more losses might signal a move toward 0.6300.
NZD/USD Technical Analysis
On the hourly chart of NZD/USD on FXOpen, the pair also followed AUD/USD. The New Zealand Dollar formed a base above the 0.5675 level and started a decent increase against the US Dollar.
The pair climbed above the 0.5720 resistance. It tested the 0.5775 resistance before there was a pullback. The recent low was formed at 0.5734 and the pair is again rising above the 50-hour simple moving average.
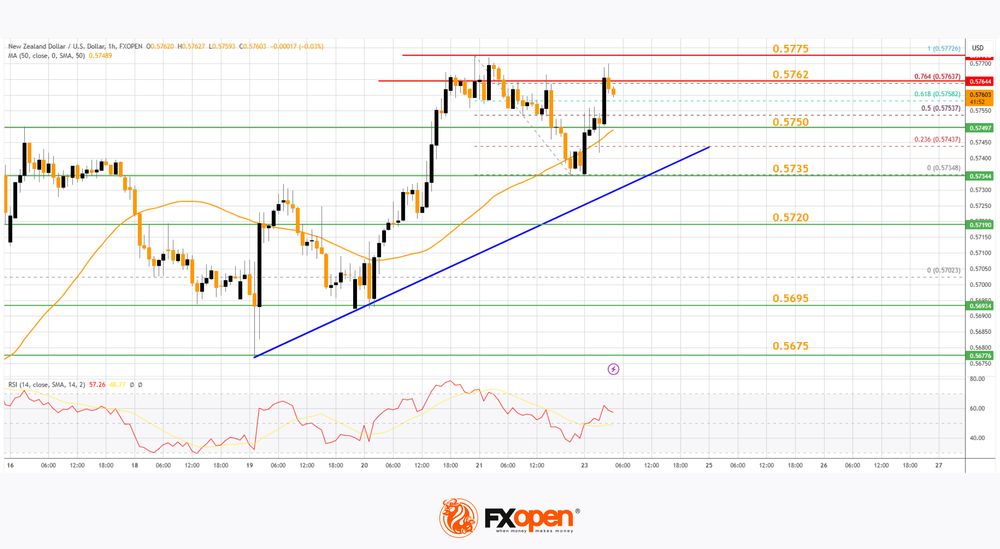
It cleared the 0.5750 resistance and the 50% Fib retracement level of the downward move from the 0.5772 swing high to the 0.5734 low. The NZD/USD chart suggests that the RSI is back above 50 signaling a positive bias.
On the upside, the pair is facing resistance near the 76.4% Fib retracement level of the downward move from the 0.5772 swing high to the 0.5734 low at 0.5762. The next major resistance is near the 0.5775 level.
A clear move above the 0.5775 level might even push the pair toward the 0.5800 level. Any more gains might clear the path for a move toward the 0.5880 resistance zone in the coming days.
On the downside, there is a support forming near the 0.5750 zone. If there is a downside break below the 0.5750 support, the pair might slide toward 0.5735. There is also a key bullish trend line forming with support at 0.5735. Any more losses could lead NZD/USD in a bearish zone to 0.5695.
Trade over 50 forex markets 24 hours a day with FXOpen. Take advantage of low commissions, deep liquidity, and spreads from 0.0 pips. Open your FXOpen account now or learn more about trading forex with FXOpen.
This article represents the opinion of the Companies operating under the FXOpen brand only. It is not to be construed as an offer, solicitation, or recommendation with respect to products and services provided by the Companies operating under the FXOpen brand, nor is it to be considered financial advice.
European Stock Futures Up With EUR/USD Approaching First Resistance at 1.0533
Markets
US stock markets suffered a late swoon last Friday. They started on a bad footing, loosing around 0.5% in the first trading hour with disappointing US eco data triggering an orderly correction. The February US composite PMI unexpectedly fell to its lowest level since March 2023 (50.4) from 52.7 in January (vs 53.2 expected). The first sub-50 reading in the services sector since January 2023 was accountable for the setback. Details showed a darkening picture of stalling business activity, heightened uncertainty, pessimism on the outloook and rising prices. The latter also featured in European and UK PMI’s released earlier on the day and also showed up in a significant upward revision to long term (5-10y) US inflation expectations in the Michigan consumer survey (3.5% from 3.3%, highest since early ‘90s). The first print of that February survey already pointed at elevated short term inflation expectations (4.3% from 3.3%).
The mood on US stock markets soured after European close with key indices ending 1.7% (Dow) to 2.2% (Nasdaq) lower. An article in the South China Morning Post spooked investors going into the weekend. A Chinese team found a new bat coronavirus that could infect humans the same way as Covid-19. Safe haven flows ignited a rally in US Treasuries into the close with daily yield losses of around 7 bps across the curve. The US dollar got stock in between the risk climate and the loss of interest rate support with EUR/USD ending the week at 1.0458.
The German CDU/CSU won parliamentary elections yesterday, receiving 28.52% of the vote share (+4.38%pts). The liberal FDP (4.33%) and far-left Sahra Wagenknecht Alliance (4.97%) fail to make the 5% threshold to enter parliament, opening the way for a grand coalition between the CDU/CSU and Social Democrats (16.41%; -9.29%pts). That’s the most market-friendly election outcome. European stock futures are up this morning with EUR/USD approaching first resistance at 1.0533 (YTD top). German Bunds lose ground. Should BSW in final counting manage to get over 5%, the Greens (11.61%; -3.11%pts) come into play, toughening the coalition process and weakening the government. Extreme left (Die Linke 8.77% + BSW) and extreme right (AfD 20.80%) together gather over a third of votes. Voter turnout was high at 84%. News on a March 6 emergency EU Defense Summit this morning also boosts sentiment. Belgian central bank governor Wunsch warned in the FT that the eurozone risks sleepwalking into too many rate cuts. He’s not (yet) pleading for a pause in April, but the option should be kept open. ECB Schnabel was the first to hint in that direction last week. Wunsch thinks that downside and upside inflation risks are relatively limited this year. Towards year-end, he felt relatively comfortable of market expectations of a 2% ECB policy rate.
News & Views
The European Union estimated that Trump’s first salvo of tariffs that impacts the bloc may be a hit of as much as EUR28bn of its exports. The US president has announced a 25% import levy on steel and aluminum that could take effect as soon as March 12, including in finished products and with no exceptions. Trump also vowed to slap reciprocal tariffs based on trade policies by US partners. The impact is fourfold the hit in 2018, when the US introduced 25% tariffs on selected steel goods and 10% on aluminum. The EU’s response back then was suspended after Biden came to power and the two sides reached an agreement but said it could quickly reactive them if needed.
US Treasury Secretary Bessent in an op-ed for the Financial Times explained in more detail the deal US president Trump is seeking with Ukraine in developing its natural resources and minerals. He is responding to what he is saying is a misrepresentation or just plain wrong information. “The US would not be taking ownership of physical assets in Ukraine. Nor would it be saddling Ukraine with more debt.”, Bessent said. Instead the “terms of our partnership propose that revenue received by the government of Ukraine from natural resources, infrastructure and other assets is allocated to a fund focused on the long-term reconstruction and development of Ukraine where the US will have economic and governance rights in those future investments.” The Treasury Secretary says such a structure brings the necessary transparency, accountability, corporate governance and legal framework and leaves no room for corruption and insider deals. The agreement is still in draft form and negotiations continued during the weekend.