Sample Category Title
Forex Analysis: Gold And GBPUSD Analysis
The precious metal has broken out from its descending wedge around 1331.00 and moved higher to create a lower high at 1361.80.The price then dropped back lower to support at 1344.16. Resistance above can be found at 1361.80 and the January high at 1365.30. A break above this resistance targets 1375.50 and 1389.00 with a large resistive zone around 1400.00. However a break above 1412.50 clears the way towards 1450.00 and 1464.00.
Support on the Gold chart can be seen at 1344.16 with the 50 period MA below at 1339.74 and the 100 period MA at 1335.90. The next level of support then comes in at 1333.66 and then 1327.5, which is the level that the 200 period MA is currently at. The descending red trend line top of the wedge is currently around 1322.00. The 1320.00 has been used as support on a number of occasions over the last two weeks and below this level is 1311.41. The support area around 1300.00 has been used on the many times in the past number of years and continues to impact price moves.
Gold 4 Hour chart

The GBPUSD pair has formed a descending broadening wedge since late January as it follows developments with the recent Stock market decline and economic data releases. Weakness in the US Dollar has been a strong theme but the UK Economy is flagging warning signs as the Brexit choke hold continues. On Friday UK Retail missed expectation to the downside. The Inflation Report Hearings will take place on Wednesday afternoon and this will provide an insight into BOE thinking on future monetary policy.
Resistance for the pair can be found at the red trend line wedge top around 1.41378. Above this level resistance is coming in at 1.41796 and this year’s high of 1.43450. Further on above these levels 1.45187 can prove difficult with 1.46626 and 1.47690 in extension. Supports below the current price level come in at 1.40000 and 1.38354 with the 50 DMA at 1.37849. The September high of 1.36568 is a significant level on the daily chart with a move below here suggesting a more sustained drop. The 100 Day MA is found alongside the wedge bottom at 1.35752 with 1.34500 below containing the rising Black supporting trend line. The 200 DMA is found at 1.33456 with the 1.32246 and 1.30586 support levels below.
GBPUSD Daily chart

Elliott Wave Analysis: GBPAUD Update
GBPAUD made a nice five-legged drop from 1.8000 level, which can be regarded as the first sign for a locked in top, and for a minimum three-wave bearish reversal to be underway. After the five wave drop, we have seen a temporary pullback as in an A-B-C matter that looks now completed, and points towards new lows. On that note a breach below the lower channel line would signal a bearish continuation.
GBPAUD, 4H
NZDUSD Intraday Analysis
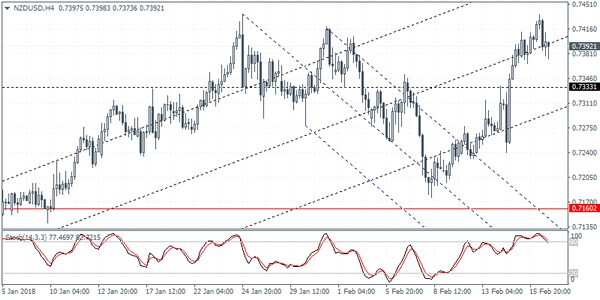
NZDUSD (0.7392): Price action in the New Zealand dollar looks somewhat similar to most of the other major currency pairs. After posting a fresh high, NZDUSD has also formed a double top pattern at the highs. This could suggest a near term decline. As a result, NZDUSD could be seen testing 0.7333 where support could be tested after it previously failed as resistance. But in the event that this support fails, then NZDUSD could be pulling back to post further downside correction. Support at 0.7160 is likely to be tested.
GBPUSD Intraday Analysis
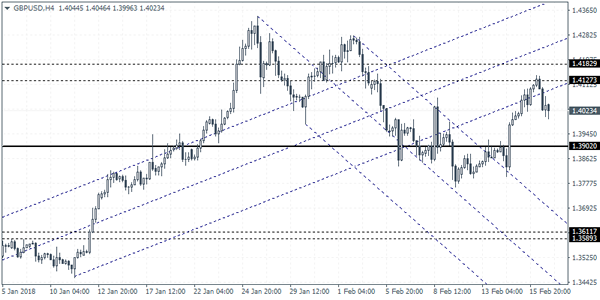
GBPUSD (1.4023): The British pound was seen easing back on Friday as price touched the previous support level of 1.4121 to establish resistance. The reversal at this level on the daily time frame indicates a pull back. We expect price to slip back to 1.3902 in the near term. There is a chance that GBPUSD could remain range bound within the current levels. But, if price action fails to hold the declines near the support of 1.3902 watch for prices to correct towards 1.3611 - 1.3600 region where the support is likely to be tested.
EURUSD Intraday Analysis
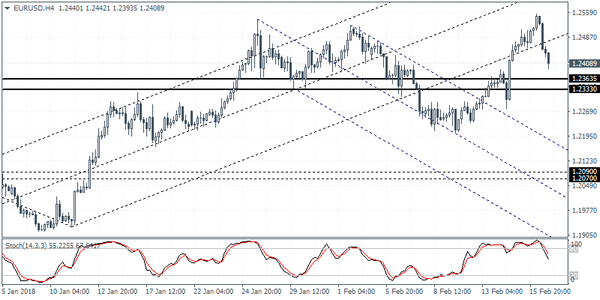
EURUSD (1.2408): The EURUSD was seen easing back on Friday after price action rallied to a fresh three year high. By Friday's close, the euro currency was seen closing with a strong bearish price action alongside a potential double top pattern. In the near term, the declines could be extended to the downside towards 1.2363 - 1.2330 level. Establishing support here could offer some short term bounce to the upside. However, the euro currency will need to break past the previously posted highs for any conviction of further gains. To the downside, watch for a break below 1.2363 - 1.2330 level, as this could suggest a decline based on the daily chart's double top pattern.
USD Rebounds Ahead Of FOMC Minutes Due This Week
The U.S. dollar posted a rebound on Friday after briefly slipping sending most of the other major currencies to post fresh highs. However, the declines were short lived as the dollar managed to reverse the levels. The FOMC meeting minutes will be released on Wednesday and the markets are anticipating that the Fed could hike rates as early as March.
On the economic front, data from the UK showed that retail sales rose only 0.1% on the month missing estimates of a 0.5% increase. The previous month's data was revised slightly higher to show a 1.4% decline. Data on Friday was mostly dominated by the U.S. housing data. Building permits, housing starts posted modest gains while the import prices rose 1.0% on the month.
Looking ahead, the economic data is light with the U.S. markets closed due to a bank holiday. Eurozone current account data is due during the day while the Bank of England Governor Mark Carney will be speaking later in the evening.
New Zealand will be reporting its PPI numbers towards the close
Elliott Wave Analysis: BTCUSD Recovering Above 10000
BTCUSD is rallying higher, now seen in wave c or three, as part of a trend reversal. We see price breaching above the 9468 level, which is a confirmation for more upside. That said, once wave c or three fully show up, a new temporary correction as blue wave iv may start to unfold with possible support near the 10000 level.
BTCUSD, 4H
EURUSD Only Intraday Bullish Above 1.2430 Level
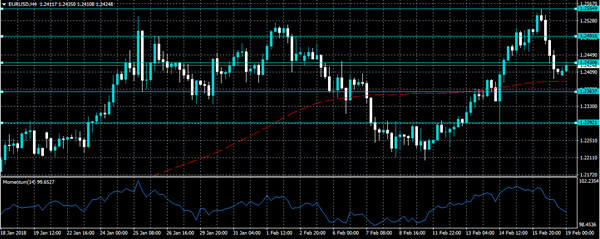
The euro continues to trade on the backfoot against the greenback in early week trading, as the U.S dollar index stages a comeback from three-year trading lows. The EURUSD pair currently trades around the 1.2420 region, with downside pressures likely to remain whilst price-action holds beneath the pairs 200-month moving average, located at 1.2430. With a lack of high-impacting macroeconomic data on Monday, the pair is likely to be increasingly technically driven, with the 1.2390 to 1.2430 price-range the key for the next directional move.
The EURUSD pair is only intraday bullish above the 1.2430 level, above this level key resistance is found at the 1.2490 and 1.2554 levels.
A strong move below the 1.2390 level will likely support further EURUSD selling, with key technical support found at the 1.2367 and 1.2291 levels
USDJPY Bullish Momentum Intact Above 105.91
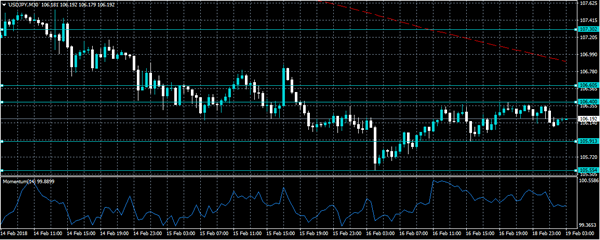
The U.S dollar continues to trade above the 106 handle against the Japanese yen in early Monday trading, as the U.S dollar index holds onto Friday’s strong trading gains. The USDJPY is currently trading around the 106.20 region, with liquidity and volume lacking in the pair as most Asian markets remain closed for the Chinese New Year. The current intraday bullish momentum in the pair is likely to continue, with USDJPY buyer’s medium-term upside price objective focused on the key 106.60 level.
The USDJPY pair remains bullish above the 105.91 level, further upside towards 106.40 and 106.60 looks increasingly possible.
If the USDJPY pair trades below the 105.91 level, sellers may push price-action back towards the 105.55 support region.
Little Market Movements Expected As Volatility Subsides
The Australian dollar is in recovery mode against the dollar following the drop that happened late last month. The currency has managed to recover from a low of 0.7789 to the current high of 0.795. All eyes are now on the Reserve Bank of Australia (RBA), which will release the minutes of the previous meeting. Traders will want to read the RBA's tea leaves about the status of the economy and the pace of future interest rates.
The EUR/USD pair is little changed following no major political developments during the weekend. Today, with no major economic data expected, and with the US being on holiday, there is a likelihood that the pair could trade within a narrow range. Looking ahead, traders will focus on Germany's consumer climate data which will be released tomorrow. They will also focus on the Fed minutes which will be released on Wednesday.
The cable is little changed, following an uneventful weekend in the US and in the UK. Traders are now focusing on Wednesday, when Governor Mark Carney will deliver a speech. They will want to get the clues about how the BoE expects to keep the rising inflation rate in check.
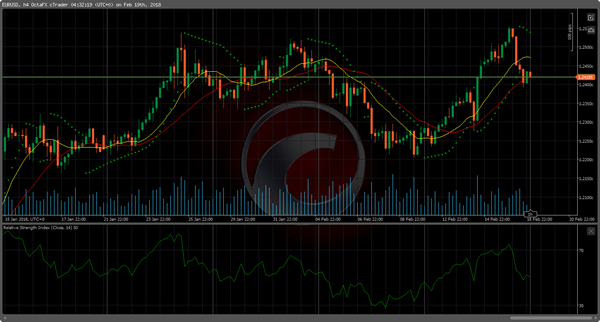
EUR/USD
The pair has fallen from the multi-year high level of 1.2561 to a low of 1.2414. The slight fall has come at a time when volatility is easing as traders shrug off the risks of rising inflation. The pair is trading in the middle of the 25-day and 14-day moving average, with the RSI falling to 50. The most likely scenario is where the pair recovers from the dip to get to the 1.2472 level.
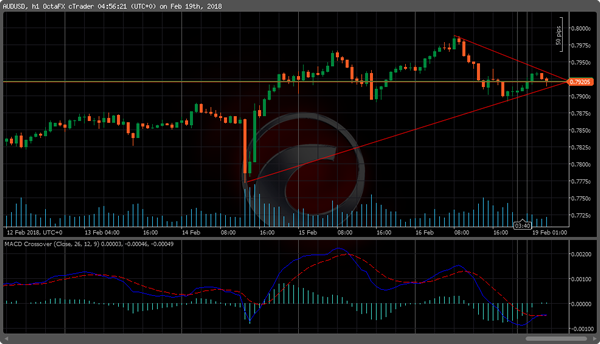
AUD/USD
The AUD/USD pair has formed a symmetrical triangle, which places it at an ideal position for a break out. The pair is currently trading at 0.7920. At the same time, the pair's MACD shows a neutral stance following last week's slight correction. The pair's RSI is at 48. Today, the pair could continue trading within a range, with a breakout in either direction coming tomorrow after the release of RBA's minutes.
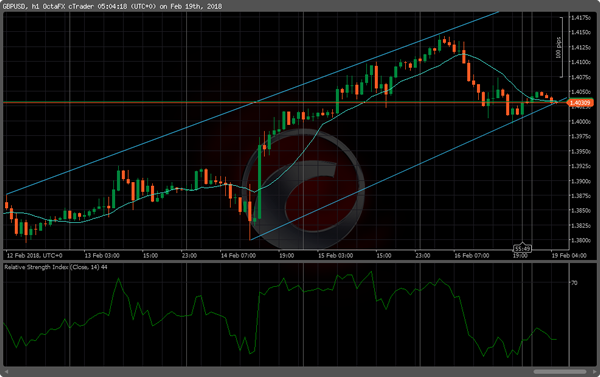
GBP/USD
The pair is currently trading at the 1.4031 level, which is down from the monthly high of 1.4146. The pair is trading at the 14-day moving average level, which is also at an important support as shown below. The most likely scenario is where the pair trades above the support level and tries to recover the lost gains. If this scenario works out, the next price target will be 1.4150.