Sample Category Title
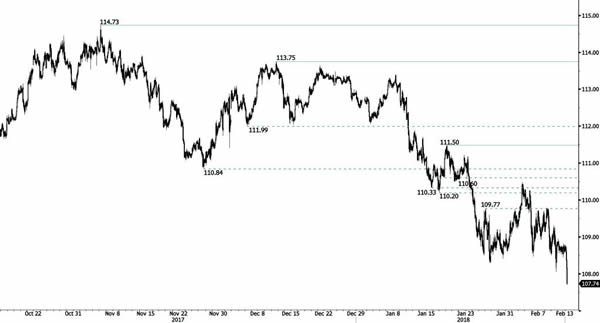
USD/JPY Decline Resumes
USD/JPY is weakening further. Hourly support at 107.63 (08/09/2017 low) is now broken, suggesting the pair could even reach resistance at 107.32 (08/09/2017 low). Hourly resistances can be found at 111.50 (18/01/2018) and 113.75 (12/12/2017 high). The technical structure suggests further short-term downside moves.
We favor a long-term bearish bias. Support given at 107.32 (08/09/2017 low) is nearing. A gradual rise towards the major resistance at 125.86 (05/06/2015 high) seems unlikely. Expected to decline further support at 101.20 (09/11/2016 low).
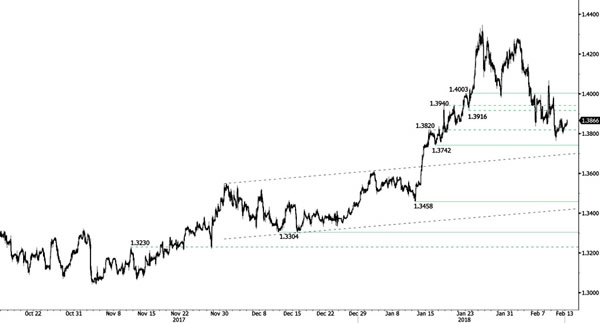
GBP/USD Bullish Momentum
GBP/USD is bouncing since recent sideways moves, trading between resistance at 1.4003 (23/01/2018 high) and support at 1.3742 (16/01/2018 low). The technical structure suggests further potential upside move.
The long-term technical pattern is reversing. The Brexit vote had paved the way for further decline but the pair is moving to 2016 highs. Long-term support and resistance are given at 1.1841 (07/10/2017 low) and 1.5018 (24/06/2016 high).
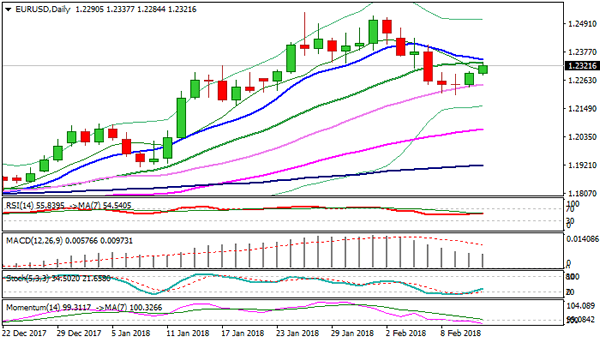
EUR/USD Heading Higher
EUR/USD is approaching resistance at 1.2356 (24/01/2018 high). Support is located at 1.2165 (17/01/2018 low). The technical structure suggests further upside moves.
In the longer term, the momentum is turning largely positive. We favor a continued bullish bias. Key resistance is holding at 1.2886 (15/10/2014 high) while strong support lies at 1.1554 (08/11/2017 low).
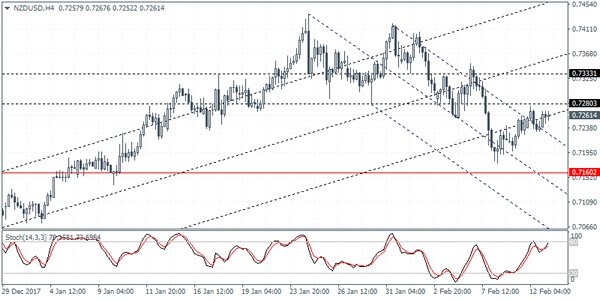
NZDUSD Intraday Analysis
NZDUSD (0.7261): The NZDUSD currency pair has been modestly drifting higher. Following the breakdown below 0.7333 level, price action formed a minor support level at 0.7280. A retest back to this level could see NZDUSD forming resistance. A reversal at this level will signal the downside price action. NZDUSD could be seen targeting the support at 0.7160. To the upside, a breakout above 0.7280 will keep NZDUSD trading flat within the resistance and support levels. Further gains can be expected only on a breakout above 0.7333 level.
GBPUSD Intraday Analysis
GBPUSD (1.3841): The British pound stayed flat with price action confined to Friday's range. Price was seen to be briefly consolidating near 1.3855 level where resistance is likely being formed. In the event that GBPUSD breaks above this level, we can expect price action to test 1.3978 which marks the next level of resistance. To the downside, the support seen at 1.3611 - 1.3589 will be tested in the near term. This will potentially mark the correction to the rally following which we could see renewed momentum taking shape.

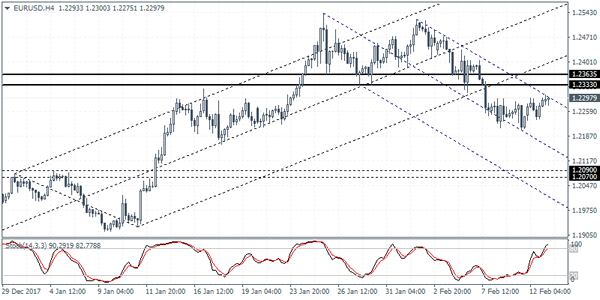
EURUSD Intraday Analysis
EURUSD (1.2297): The EURUSD was seen retracing its declines following Friday's doji pattern. The rebound to the upside could see a follow through in the short term with the potential lower high being formed on the current retracement. Resistance is seen near 1.2333 - 1.2363 level which could see price posting a reversal. This could potentially pave way for further declines to the initial support level at 1.2090 - 1.2070. Alternately, in the event that EURUSD breaks above 1.2363, we could anticipate further room to the rally above the resistance level.
UK Consumer Price Index Data On The Tap
The U.S. dollar was seen trading rather flat on Monday. Lack of economic data and a modest recovery in the equity markets saw most of the currencies trading in a range. Earlier today, BJ Governor Kuroda said that the central bank must maintain its QE program as it takes time for inflation to reach the BoJ's 2% inflation target rate. Kuroda was addressing the Lower House Budget Committee.
Looking ahead, the economic data today will focus on the annual CPI data from the UK and will cover the period of January. Economists forecast that headline CPI in the UK rose 2.9% on the year. This marks a slower pace of increase in inflation for the second month. Core CPI is however expected to rise 2.6% on the year.
In the U.S. trading session, FOMC member Loretta Mester will be speaking while later in the evening, Japan will be releasing its preliminary GDP data. Economists forecast that GDP advanced 0.2% on the quarter, down from 0.6% previously.
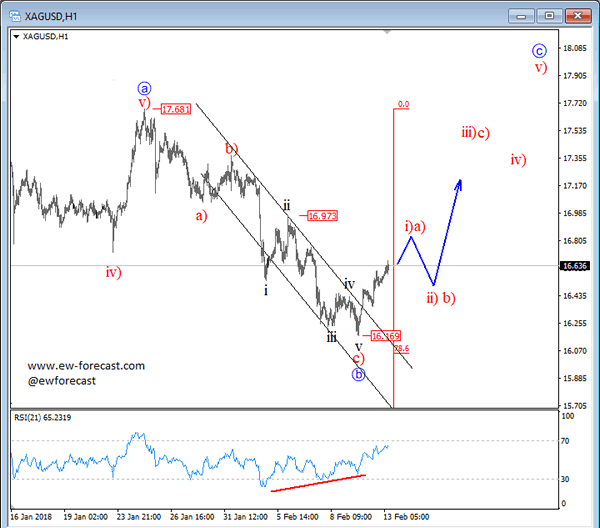
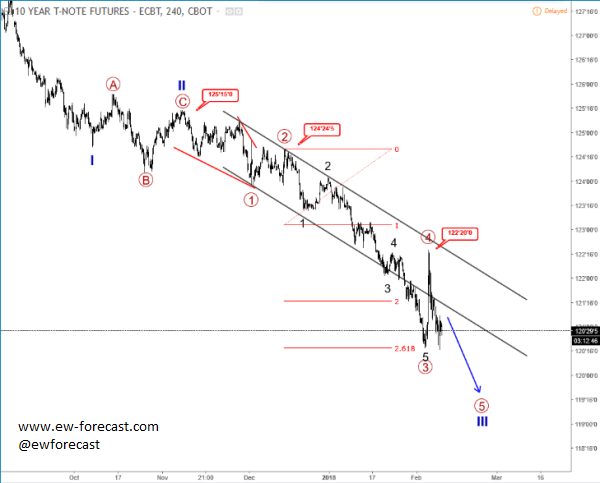
Elliott Wave Analysis: Silver Trading Out Of A Downward Channel, 10 Years Us Looking Towards 120’0
We can see silver turning up, out of a downward channel, which can be the first sign of a temporary trend reversal. This reversal should be structured by minimum three waves to the upside. All said, the Relative strength index also shows divergence and indicates a three-wave rally.
Silver, 1h
10 year US notes made a sharp and strong reversal recently, which we labelled as corrective wave 4, that found resistance at 122'20 level and reversed lower. The current drop can now be part of sub-wave 5 of III.
10 Year US notes, 4H
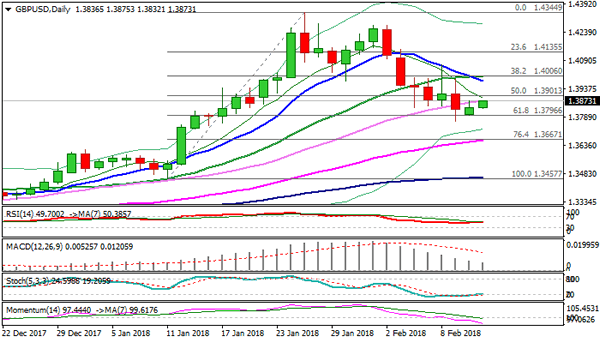
Technical Outlook: Cable Stands At The Front Foot Ahead Of UK Inflation Data
Cable remains positive in early Tuesday's trading and pressures Monday's high at 1.3875, but recovery attempts from Friday's low at 1.3764 so far did not show stronger gains and remain capped by broken ascending 30SMA (currently at 1.3873).
Lack of clearer direction signals comes from mixed daily indicators as slow stochastic is emerging from oversold zone and pointing higher, while 14-d momentum continues to trend lower, deeply in negative territory.
Traders are cautious ahead of today's key event for sterling, release of UK CPI data. Inflation is forecasted at 2.9% in January vs 3.0% in Dec and under six-year high at 3.1%, posted in Nov.
Stronger than expected release would inflate pound as strong inflation would support hawks advocating scenario for rate hike in May.
Disappointing numbers, on the other side, would increase pressure and risk extension of pullback from 1.4344 peak.
Bulls need break above 30SMA (1.3873) and daily Kijun-sen (1.3901) to generate fresh bullish signal for extension towards psychological 1.4000 barrier (20SMA) and 1.4020 (daily Tenkan-sen).
Res: 1.3873, 1.3901, 1.3960, 1.4000
Sup: 1.6832, 1.3796, 1.3764, 1.3700
Technical Outlook: EURUSD – Near-Term Bias Remains With Bulls For Recovery Extension
The Euro remains constructive on Tuesday and cracked pivotal barrier at 1.2326 (Fibo 38.2% of 1.2522/1.2205 bear-leg), signaling stronger upside after completion of Doji reversal pattern on daily chart.
Recovery needs to break above converged 20/10SMA’s at 1.2335/49 for fresh bullish signal and extension towards next pivots at 1.2363 (daily Tenkan-sen) and 1.2400 (Fibo 61.8% of 1.2522/1.2205 pullback.
North-heading daily RSI and slow stochastic are supportive, however, bearish momentum is building and requires caution.
Rising 30SMA continues to underpin (currently at 1.2247) and only break here would weaken near-term structure.
Res: 1.2349, 1.2363, 1.2400, 1.2447
Sup: 1.2284, 1.2247, 1.2205, 1.2161