Sample Category Title
EURUSD – Vulnerable On Correction Though With Caution
EURUSD - The pair closed lower the past week leaving risk of more weakness on the cards. We faces price hesitation with a move higher in the new week. On the upside, resistance comes in at 1.2300 level with a cut through here opening the door for more upside towards the 1.2350 level. Further up, resistance lies at the 1.2400 level where a break will expose the 1.2450 level. Conversely, support lies at the 1.2200 level where a violation will aim at the 1.2150 level. A break of here will aim at the 1.2100 level. Below here will open the door for more weakness towards the 1.2050. Its weekly RSI is bearish and pointing lower suggesting more weakness. All in all, EURUSD faces further pullback threats.
GOLD – Weakens, Remains On The Defensive
GOLD - The commodity saw price weakness for a second week in a row the past week. On the downside, support comes in at the 1,310.00 level where a break will turn attention to the 1,300.00 level. Further down, a cut through here will open the door for a move lower towards the 1,290.00 level. Below here if seen could trigger further downside pressure towards the 1,280.00 level. Conversely, resistance resides at the 1,320.00 level where a break will aim at the 1,330.00 level. A turn above there will expose the 1,340.00 level. Further out, resistance stands at the 1,350.00 level. All in all, GOLD looks to weaken further.
This Too Shall Pass
This too shall pass
It seems anytime I left my desk last week the market was sure to fall apart but after witnessing 25 years + of market corrections, I know storms don’t last forever, and as far as the recent bout of market mayhem is concerned, this too shall pass.
Traders quickly conjectured that the ‘crash’ was mainly due to over-crowded positioning in short equity volatility trades and, therefore, was a relatively isolated event. But this does not mean equity markets are out of the weeds just yet.
With US cash flow models factoring in higher US bond yields, equity markets repricing was always on the cards, but unequivocally the rapidity of the move higher in yields was stifling and stop losses were combatively triggered. And when factored with the unbridled use of leverage in equity positions it likely caused everyone to head for the exits due to cash and margin requirements. The great unknown in the debate is just how much equity froth is based on leverage and to what extent will higher US bond yields squeeze these positions either from a cash position or through asset rotation perspectives.
It was a crazy week for US rate markets, but with powerful US economic signals and interest rates most certainly to rise quicker than expected, last week tumult could be little more than the start of the equity rollercoaster. If cumulative boost from tax reform and fiscal stimulus nudges GDP outline 1.5% higher over the next six to 9 months how does the Fed possibly stick to their three dot plot projections for 2018?
Bond markets are only in the early stages of buying into the global reflation theme, and increasing inflation expectations are driving nominal yields higher. Last week there was a significant topside move in US yields which suggest we could easily tack on another 30-35 basis points 2’s through 10’s given the US fiscal stimulus backdrop. But even without inflation, global central banks will move rates higher, and this will add to higher yield environment, higher inflation or not.
The Feds seem undeterred from the path of gradual normalisation by the recent market turmoil, and we should not expect a Powell ” Put.” given the economic indicators remain strong. And with FED Dudley chiming in, the recent Stock market volatility is ” no big potatoes.” , just imagine a big potato !!
Oil Markets
U.S. crude oil fell below $59 a barrel for the first time in 2018.Rising US production and a resurgent dollar have stacked pressure on oil prices amid a broad financial market sell-off. And on Friday WTI nosedived after the U.S. rig count rose by 26 rigs in the week through Feb. 9 to a total of 791, supporting the EIA revised production forecast that the US would reach the lofty 11 million bpd by the end of 2018
Also, the possible demise of the OPEC agreement has traders on pins and needles after The head of Russian energy giant Gazprom Neft on Friday said producers could adjust their commitments under the deal as soon as next quarter.
Gold Markets
Without question last week was a stressful week in the Gold markets which saw a little appeal for traditional haven assets as Wall streets sinkhole expanded.
At the moment higher US yields continue to weigh negatively on gold’s appeal over the short term, but the recent market tumult likely has overleveraged equity positions scrambling for margin top-ups, and to a degree, there was cause for some cross-asset unwinds including gold allocations which were probably used to fund margins.
In the more extended run with inflation expectations increasing on the back of US stimulus, this should be a consideration for growing one’s gold portfolio.
At the retail levels, Mainland Gold consumption is rising in preparation for Chinese Lunar New Year holidays, not to mention a last-minute splurge for Valentine’s day should keep retailers busy.
Currency Markets
Currency markets were more or less a mixed bag last week, a potpourri of events but not one convincing driver. And with little to glean from Friday close, currency traders could remain sidelined watching equities markets swings in wonderment at least until this week’s US CPI. Given all this rukus started with an uptick in the wage growth component from this months NFP release; this weeks US inflation data will be a monster of a print.
Japanese Yen
Funding positions continue to unwind which at least in the case of JPY, is having a more significant influence over USDJPY than higher US yields. The reappointment of Kuroda could retrace some speculations on the policy adjustments; the Yen will remain the puppet whose strings are manipulated by equities and fixed income price movements.
Australian Dollar
RBA and SOMP behind us and signalling nor rush to hike for a considerable period given the slight dovish lean in the inflation outlook. The AUD should, therefore, be back trading off risk sentiment, commodity prices and ultimately the underlying USD movements. While the Aussie bounced higher above 78 on positive US equity close on Friday, we should expect commodity currencies trade poor amid the recent volatile market. Rallies will likely remain subdued near-term, so the Aussie should remain vulnerable.
Long Euro short Aussie trade set up should return in vogue over the short term given divergent central bank policy expectations.
Malaysian Ringgit
The market continues to grapple with growth versus the inflation narrative, and as this volatility irons itself out, Asian markets tend to exhibit a higher sensitivity to global fluctuations.
And while the Ringgit is better positioned than regional peers to withstand the recent uptick in Global volatility due to strong Marco foundations and the BNM on the path to interest rate normalisation, The domestic economic landscape will come under intense glare when Q4 GDP is released on Wednesday.
While March a rate hike expectations are low due to the dovish inflation overtones expressed by BNM in January, but a notable above consensus print on this weeks GDP will increase the odds of a rate hike later in 2018 and strengthen the Ringgit. ( Consensus is 5.8 )
While oil prices continue to move lower due to US supply concerns, I believe this is more technical driven as dollar index is holding above 90 cents, putting pressure on all commodities. Once this period of excess volatility decreases, the global growth narrative should reassert and commodity prices should rise.
EUR/USD Weekly Outlook
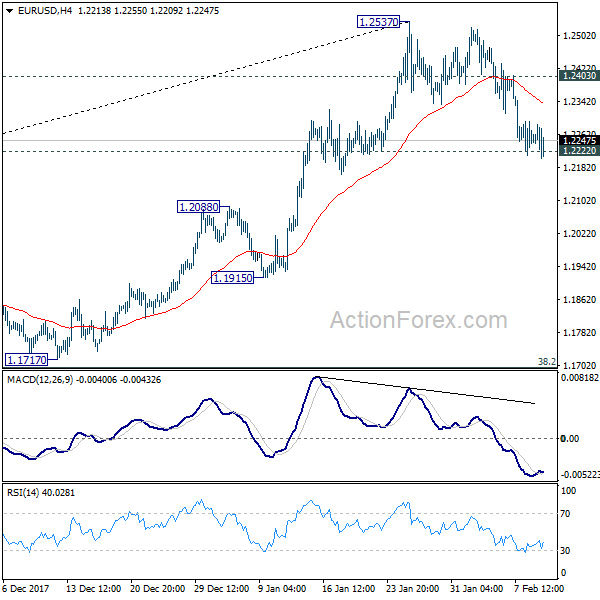
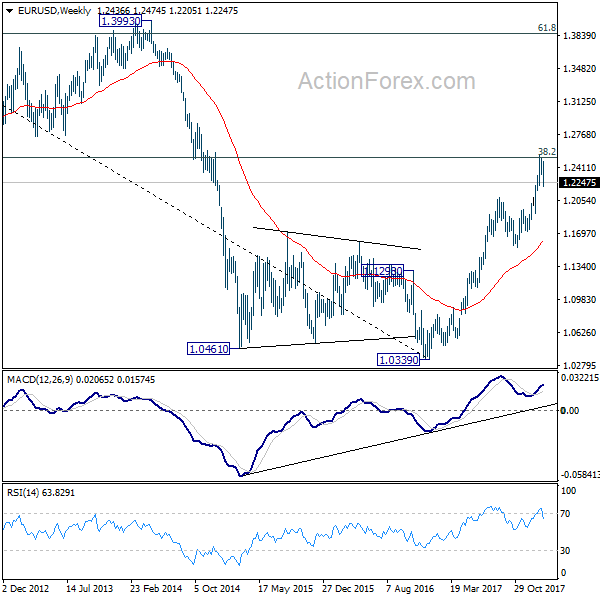
EUR/USD dropped to as low as 1.2205 last week but failed to sustain below 1.2222 key support so far. Initial bias remains neutral this week first, with focus on 1.2222. Sustained break there should confirm rejection from 1.2516 key fibonacci level, as well as near term reversal, on bearish divergence condition in 4 hour MACD. That could also signal completion of medium term up trend from 1.0339. In that case, near term outlook will be turned bearish for 38.2% retracement of 1.0339 to 1.2537 at 1.1697. On the upside, though, above 1.2403 minor resistance will revive bullishness and turn focus back to 1.2537.
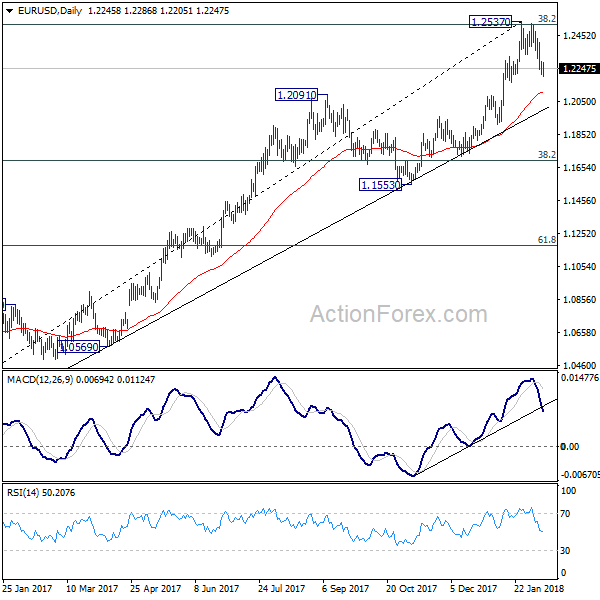
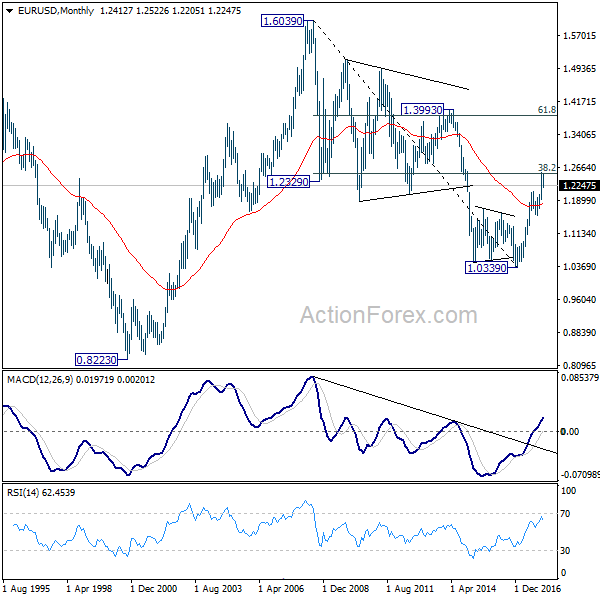
In the bigger picture, key fibonacci level at 38.2% retracement of 1.6039 (2008 high) to 1.0339 (2017 low) at 1.2516 remains intact. Hence, rise from 1.0339 medium term bottom is still seen as a corrective move for the moment. Rejection from 1.2516 will maintain long term bearish outlook and keep the case for retesting 1.0039 alive. However, sustained break of 1.2516 will carry larger bullish implication and target 61.8% retracement of 1.6039 to 1.0339 at 1.3862.
In the long term picture, 1.0339 is seen as an important bottom as the down trend from 1.6039 (2008 high) could have completed. It's still early to decide whether price action from 1.0339 is developing into a corrective or impulsive pattern. Reaction to 38.2% retracement of 1.6039 to 1.0339 at 1.2516 will give important clue to the underlying momentum.
USD/JPY Weekly Outlook
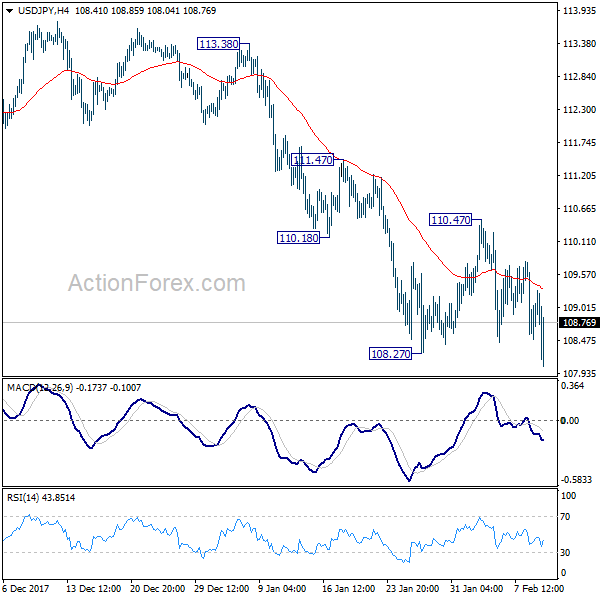
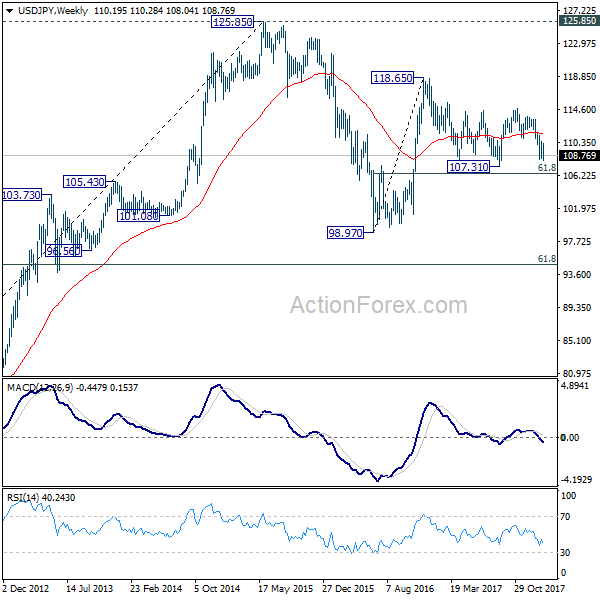
USD/JPY's break of 108.27 low last week indicates resumption of larger fall from 114.73. Initial bias remains on the downside this week. Such decline is part of the pattern from 118.65 high and should target 106.48 fibonacci level. On the upside, break of 110.47 resistance is needed to indicate near term reversal. Otherwise, outlook will stay bearish in case of recovery.
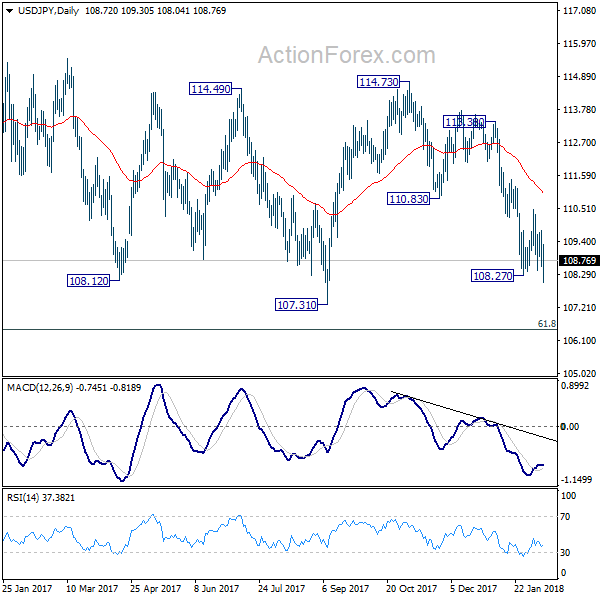
In the bigger picture, current development argues that the corrective pattern from 118.65 is extending. There is risk of dropping further to 61.8% retracement of 98.97 to 118.65 at 106.48. But this level should provide strong support to contain downside and bring resumption of rise from 98.97. However, sustained break of 106.48 will now likely send USD/JPY through 98.97 to resume the corrective fall from 125.85 (2015 high).
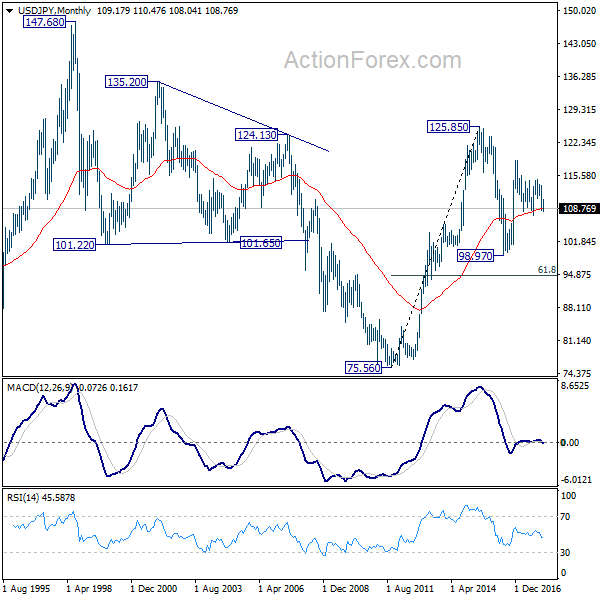
In the long term picture, the rise from 75.56 (2011 low) long term bottom to 125.85 top is viewed as an impulsive move, no change in this view. Price actions from 125.85 are seen as a corrective move which could still extend. In case of deeper fall, downside should be contained by 61.8% retracement of 75.56 to 125.85 at 94.77. Up trend from 75.56 is expected to resume at a later stage for above 135.20/147.68 resistance zone.
GBP/USD Weekly Outlook
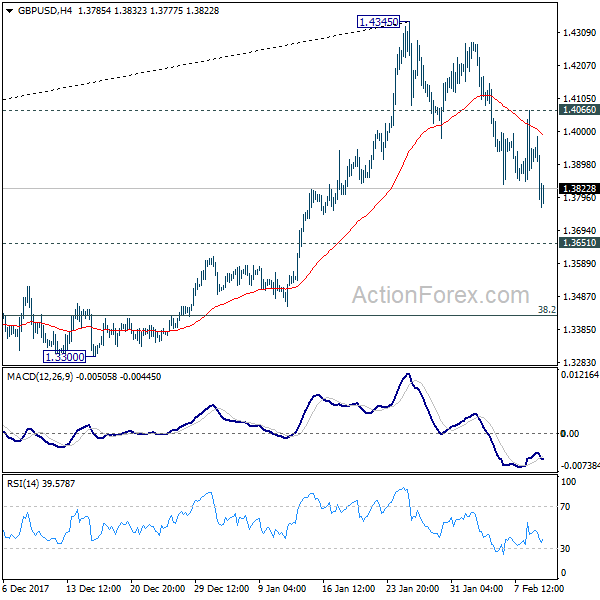
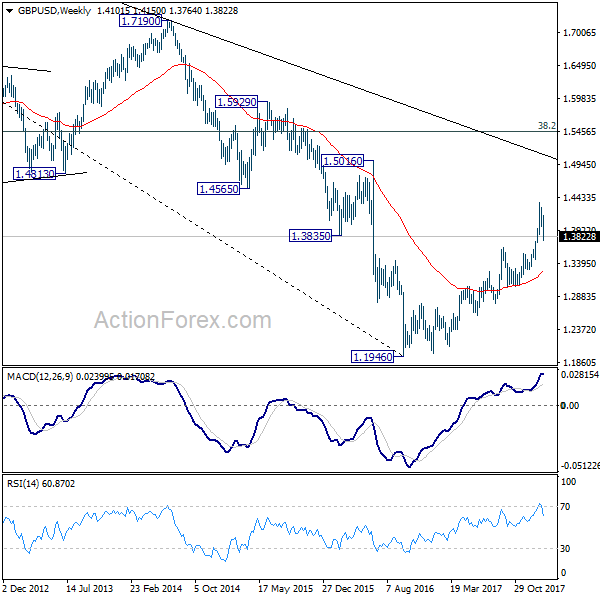
GBP/USD's corrective fall from 1.4345 extended lower last week. Initial bias remains on the downside this week for 1.3651 resistance turned support. At this point, it's still unsure whether decline from 1.4345 is correcting rise from 1.3038, or that from 1.1946, or it's reversing the trend. Break of 1.3651 will turn focus to key fibonacci level at 1.3429. For the moment, further decline will remain expected as long as 1.4066 minor resistance holds.
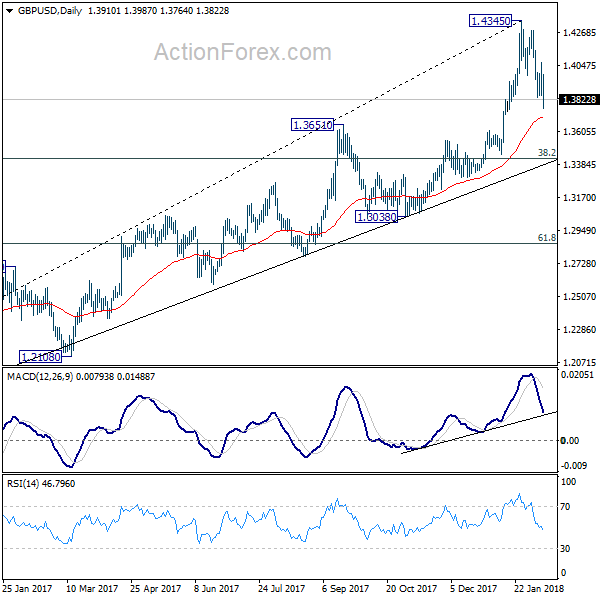
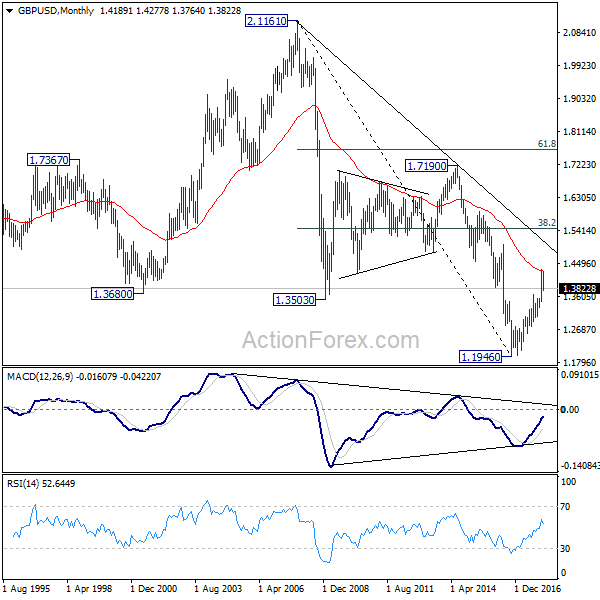
In the bigger picture, as long as 1.3038 support holds, medium term outlook in GBP/USD will remains bullish. Rise from 1.1946 is at least correcting the long term down from 2007 high at 2.1161. Further rally would be seen back to 38.2% retracement of 2.1161 (2007 high) to 1.1946 (2016 low) at 1.5466. However, GBP/USD fails to sustain above 55 month EMA (now at 1.4279 so far. Break of 1.3038 support, will suggests that rise from 1.1946 has completed and will turn outlook bearish for retesting this low.
In the longer term picture, rise from 1.1946 should at least be correcting the whole long term down trend form 2.1161 and should target 38.2% retracement of 2.1161 (2007 high) to 1.1946 (2016 low) at 1.5466. It too early to tell if it's developing into a long term up trend. We'll monitor the upside momentum and reaction to 1.5466 to decide later.
USD/CHF Weekly Outlook
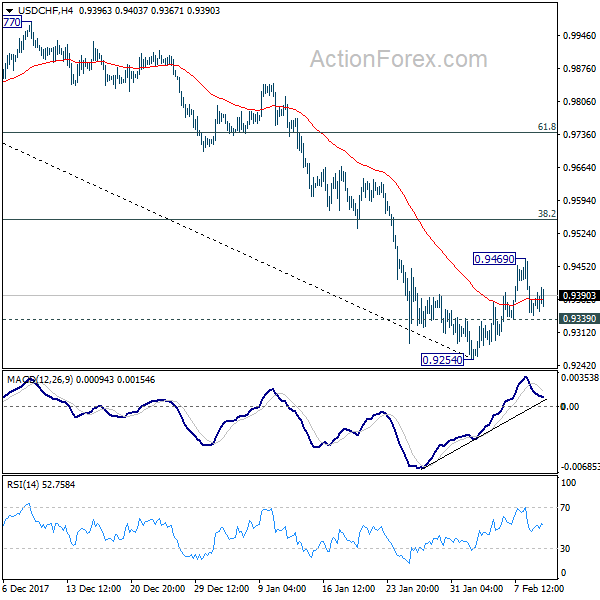
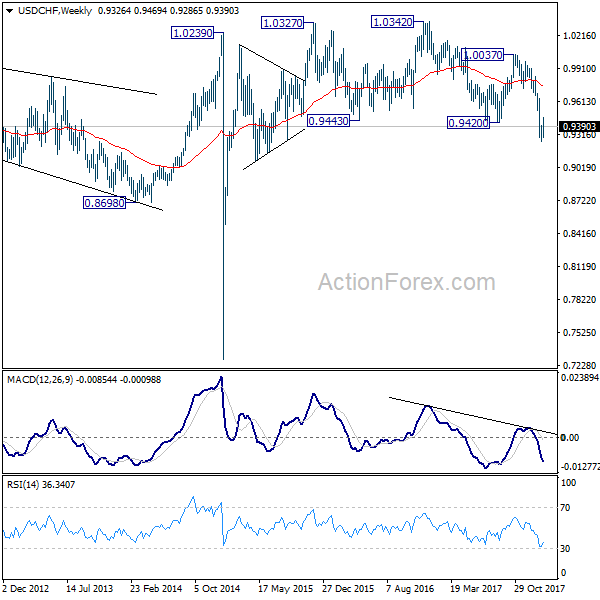
USD/CHF recovered to 0.9469 last week but lost momentum and retreated. Initial bias is neutral this week first. At this point, there is no clear sign of trend reversal yet. Therefore, in case of another rise, we'd be e cautious on strong resistance from 38.2% retracement of 1.0037 to 0.9254 at 0.9553 to limit upside and bring decline resumption. On the downside, below 0.9339 minor support will turn bias to the downside for 0.9254. Nonetheless, firm break of 0.9553 will bring stronger rebound to 55 day EMA (now at 0.9616).
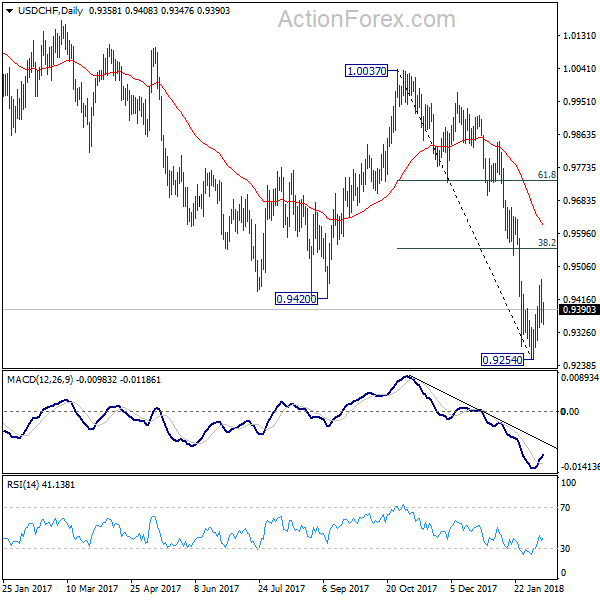
In the bigger picture, fall from 1.0342 is developing into a medium term down trend. Deeper decline should be seen to 100% projection of 1.0342 to 0.9420 from 1.0037 at 0.9115. Break will target 161.8% projection at 0.8545. In any case, sustained trading above 55 day EMA is needed to be the first sign of medium term reversal. Otherwise, outlook will stay bearish even in case of strong rebound.
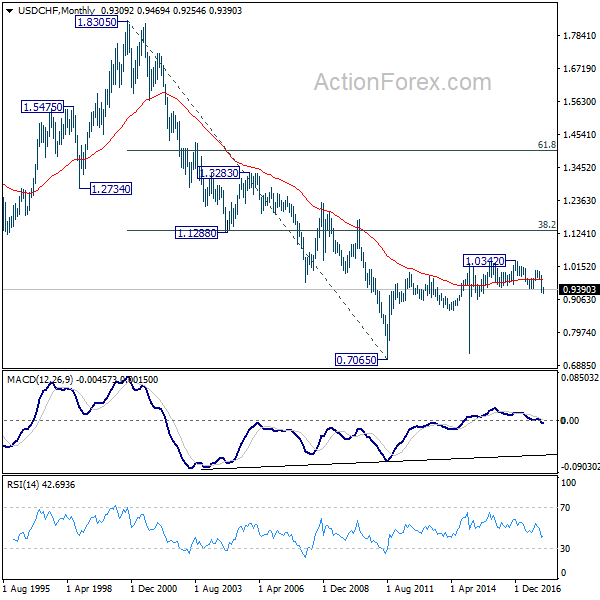
In the long term picture, the strong break of 0.9420 support and downside acceleration turns the long term outlook rather bearish. Corrective rebound from 0.7065 (2011 low) could have already completed at 1.0342. 0.8698 support will be a key level to watch. Sustained break there could bring retest of 0.7065.
AUD/USD Weekly Outlook
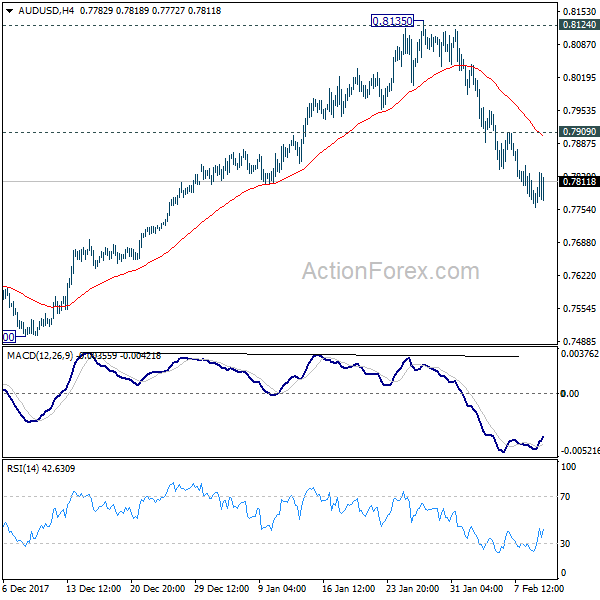
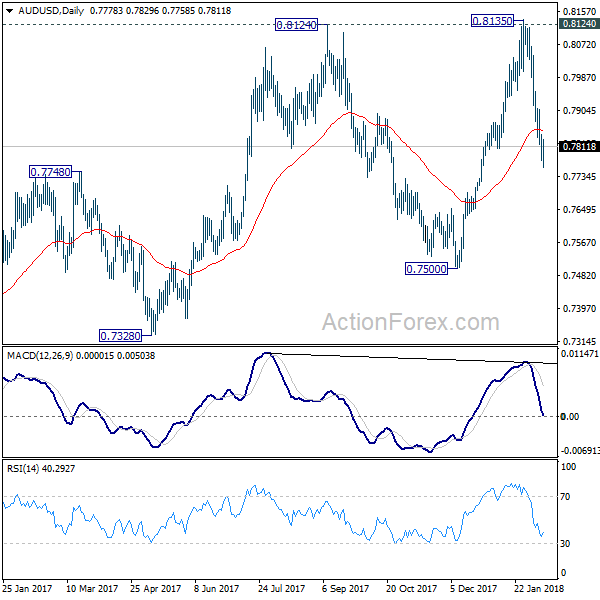
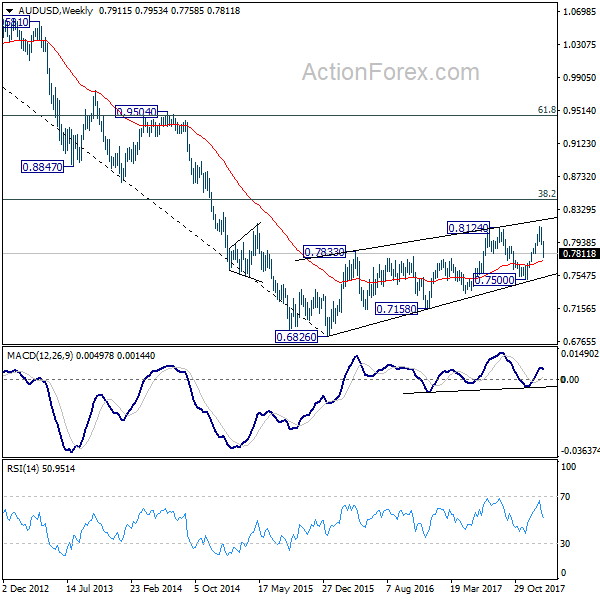
AUD/USD's decline from 0.8135 extended to as low as 0.7758 last week. Initial bias remains on the downside this week for 0.7500 key support. At this point, there is no clearly sign of larger trend reversal yet. Hence, we'd look for strong support from 0.7500 to contain downside and bring rebound. On the upside, above 0.7909 minor resistance will turn bias back to the upside for retesting 0.8135 high.
In the bigger picture, medium term rebound from 0.6826 is seen as a corrective move. It might still extend higher but we'd expect strong resistance from 38.2% retracement of 1.1079 to 0.6826 at 0.8451 to limit upside to bring long term down trend resumption. On the downside, break of 0.7500 support will now be an important signal that such corrective rebound is completed.
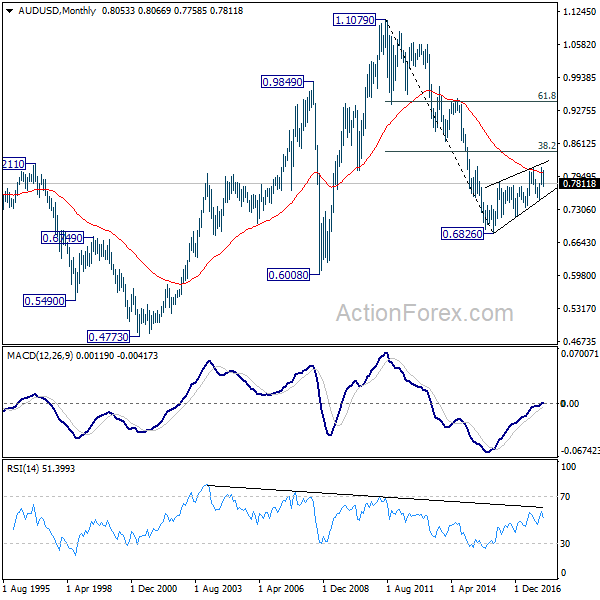
In the longer term picture, 0.6826 is seen as a long term bottom. Rise from there could either reverse the down trend from 1.1079, or just develop into a corrective pattern. At this point, we're favoring the latter. And, as long as 38.2% retracement of 1.1079 to 0.6826 at 0.8451 holds, we'd anticipate another decline through 0.6826 at a later stage. But strong support should be seen between 0.4773 (2001 low) and 0.6008 (2008 low).
USD/CAD Weekly Outlook
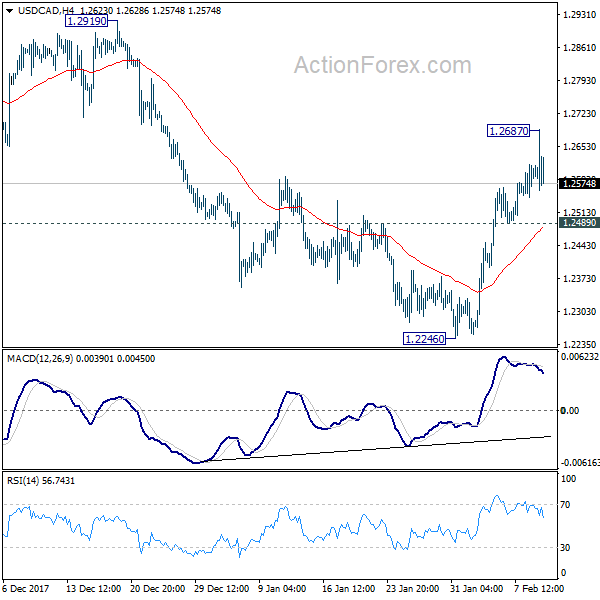
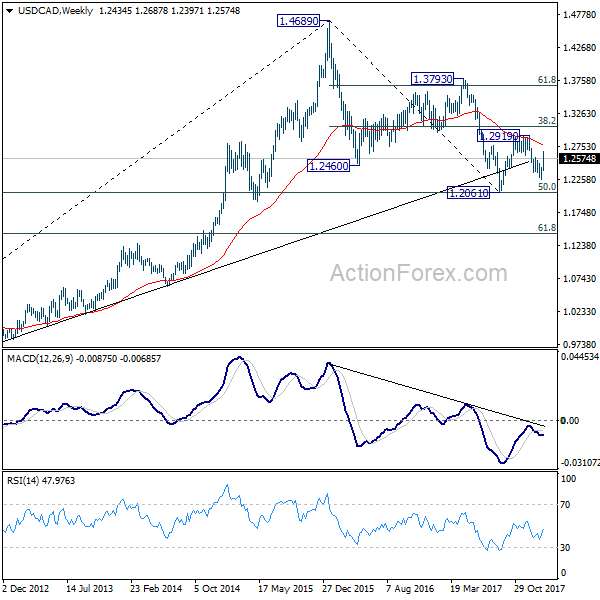
USD/CAD rebounded to as high as 1.2687 last week but formed a temporary top then on loss of momentum. Initial bias is neutral this week first. Further rise is in favor as long as 1.2489 minor support holds. Above 1.2687 will extend the rise from 1.2246 to 1.2919 resistance next. However, below 1.2489 will turn bias back to the downside for 1.2246 again.
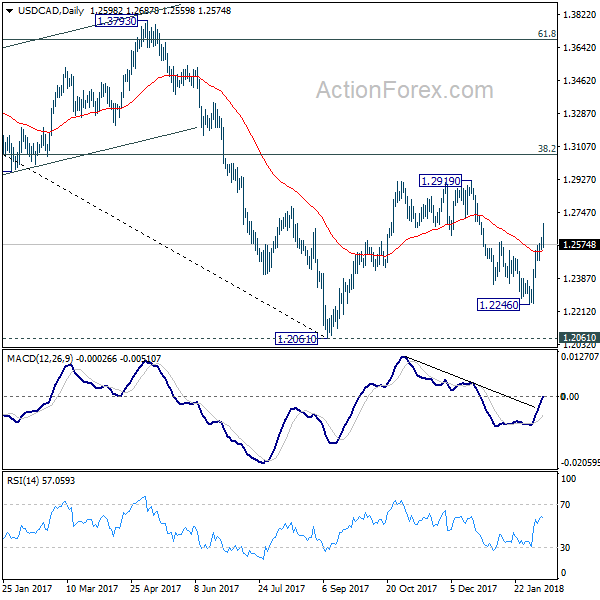
In the bigger picture, the rebound from 1.2246 is mixing up the medium term outlook. Nonetheless, USD/CAD is staying below falling 55 day EMA, hence, the bearish case is in favor. That is, fall from 1.4689 is not completed yet. Sustained break of 1.2061 key support will carry larger bearish implication and target 61.8% retracement of 0.9406 to 1.4689 at 1.1424. However, firm break of 1.2919 will revive the case of medium term reversal and turn outlook bullish.
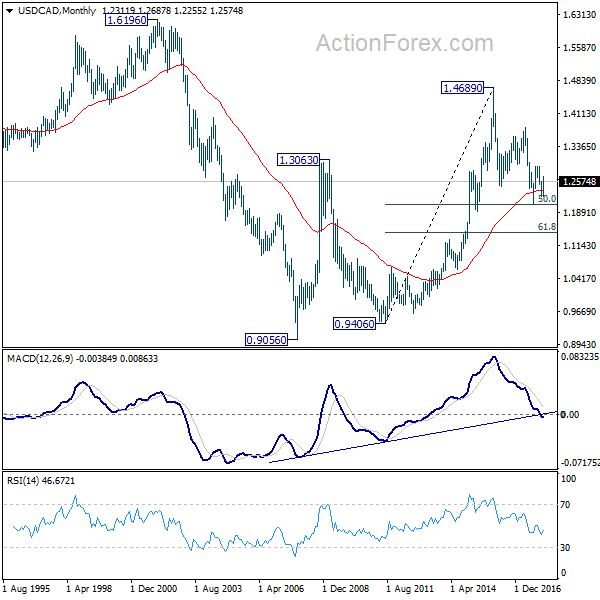
In the longer term picture, 50% retracement of 0.9406 (2011 low) to 1.4689 (2015 high) at 1.2048 remains a key support level to watch. As long as this level holds, we'll treat fall from 1.4689 as a correction and expect another rally through this level. However, sustained break of 1.2048 will turn favors to the case that rise from 0.9056 (2007 low) is a three wave corrective move that's completed at 1.4689. And retest of 0.9056/9406 support zone could be seen in medium to long term.
GBP/JPY Weekly Outlook
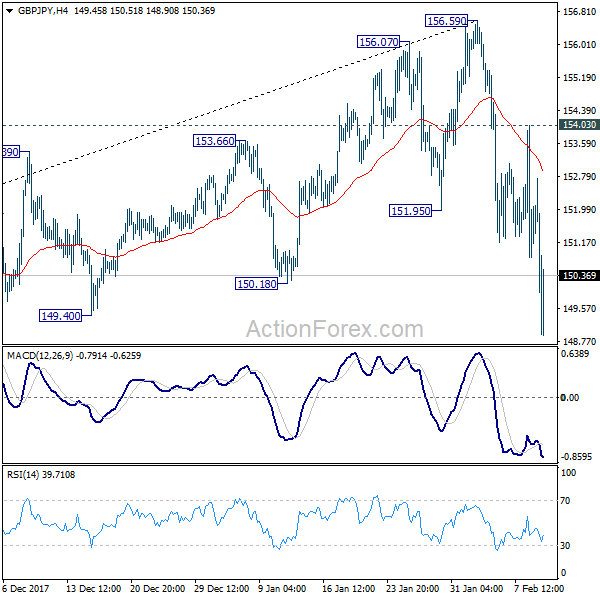
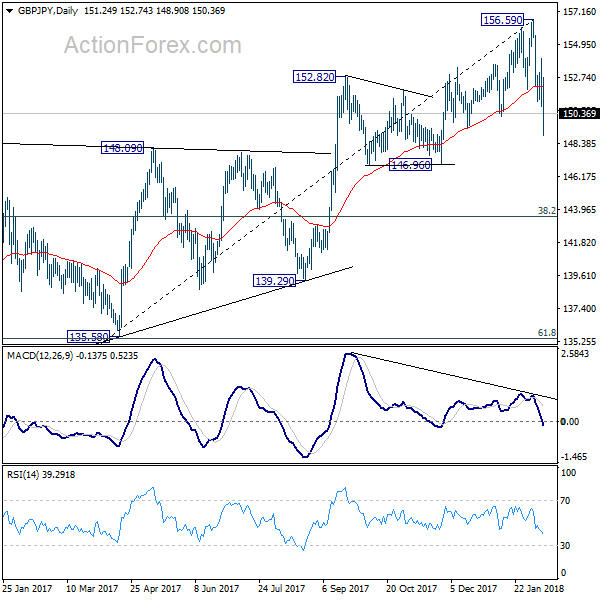
GPB/JPY's sharp decline and break of 151.95 support last week indicates that a short term top is at least formed at 156.59. Initial bias stays on the downside this week for 146.96 support. Considering bearish divergence condition in daily MACD, firm break of 146.96 will be another sign of medium term trend reversal. On the upside, break of 154.03 resistance is needed to confirm completion of the fall. Otherwise, outlook will remain cautiously bearish even in case of recovery.
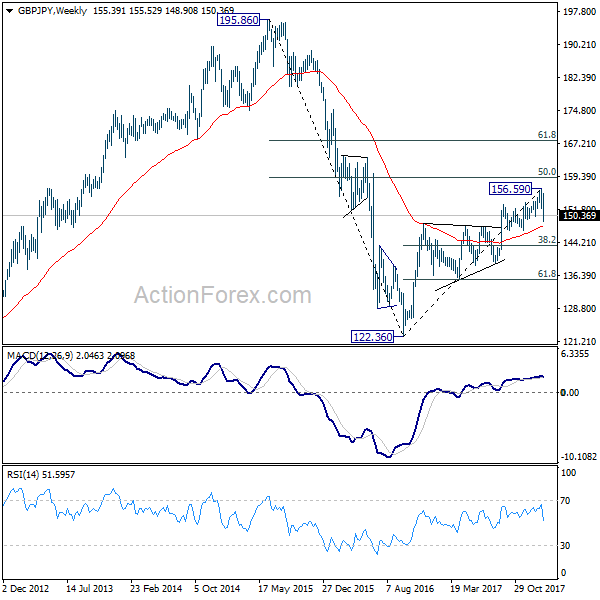
In the bigger picture, as long as 146.96 key support holds, medium term outlook remains bullish. Rise from 122.36 is in favor to extend to 61.8% retracement of 195.86 to 122.36 at 167.78. However, break of 146.96 support will indicate trend reversal after rejection by 55 month EMA. In that case, deeper fall would be seen to 38.2% retracement of 122.36 to 156.59 at 143.51 and then 61.8% retracement at 135.43.
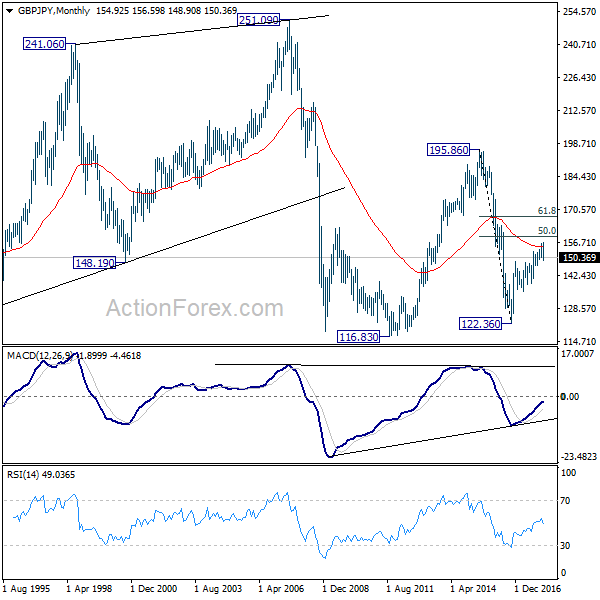
In the longer term picture, down trend from 195.86 (2015 high) has already completed at 122.36. Focus is now on 55 month EMA (now at 154.75). Firm break there will suggest that rise from 122.36 is developing into a long term move that target 195.86 again. And, price actions from 116.83 (2011 low) is indeed a sideway pattern that could last more than a decade. However, rejection from the 55 month EMA will turn focus back to 122.36 low.