Sample Category Title
GBPJPY Plunges Near 2-Month Lows
GBPJPY has plunged sharply lower since Wednesday, almost reaching a two-month low near the 150.00 strong psychological level. Meanwhile, the price has been developing within an upward sloping channel since September, while in the short term technical indicators support a bearish picture.
From the technical point of view, the market could increase negative momentum in the short term. The Relative Strength Index (RSI) is sloping down in the negative territory approaching the oversold area, while the MACD oscillator is holding in the bearish area and is on track to break below its signal line.
If price action remains negative, the next level to have in mind is the 149.40 support level. A slip below the aforementioned level could open the door for the key barrier of 149.00.
On the flip side, if the price creates a bullish movement, then the focus could shift to the upside towards the 23.6% Fibonacci retracement level around 151.60 of the up-leg from 135.50 to 156.60. If this level is breached, it could increase bullish pressure until the price touches the 154.00 psychological barrier.
GBPUSD Strongly Bearish Below 1.3892 Level
The British pound has slumped to a new weekly low against the U.S dollar, hitting 1.3820 during the European trading session, following much weaker than expected UK data and renewed strength in the greenback. The GBPUSD pair saw strong technical selling immediately following worse than expected monthly UK Trade, Industrial Production and Manufacturing numbers. Going forward, RSI and Momentum indicators are currently pointing down, as downside pressures build as we move into the U.S trading session.
The GBPUSD pair remains bearish while trading below the 1.3892 level, further losses towards 1.3800 and 1.3775 now appears likely.
Should the GBPUSD pair move above the 1.3892 level, we may see a relief rally towards the 1.3982 and 1.4000 levels.
EURUSD Further Bearish Below 1.2240 Level
The euro has moved towards the bottom-end of its recent trading range against the U.S dollar, as European equity markets continued to slump lower on Friday. EURUSD price-action is currently probing the key 1.2240 support level, after being swiftly rejected the 1.2280 region earlier. The greenback continues to be supported by overall risk-off trading sentiment, with the U.S dollar index now bouncing back well above the key 90.00 technical level.
The EURUSD pair may see further selling below the 1.2240 level, downside support is now located at the 1.2212 and 1.2180 levels.
Should the EURUSD pair fail to close under the 1.2240 level on a higher-time frame basis, intraday buyers will likely try push price-action back towards the 1.2275 and 1.2305 resistance points.
USD/JPY Mid-Day Outlook
Daily Pivots: (S1) 108.29; (P) 109.03; (R1) 109.50; More...
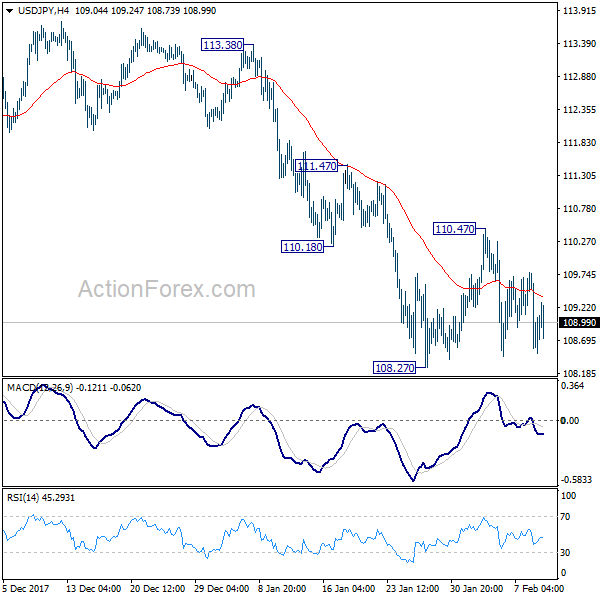
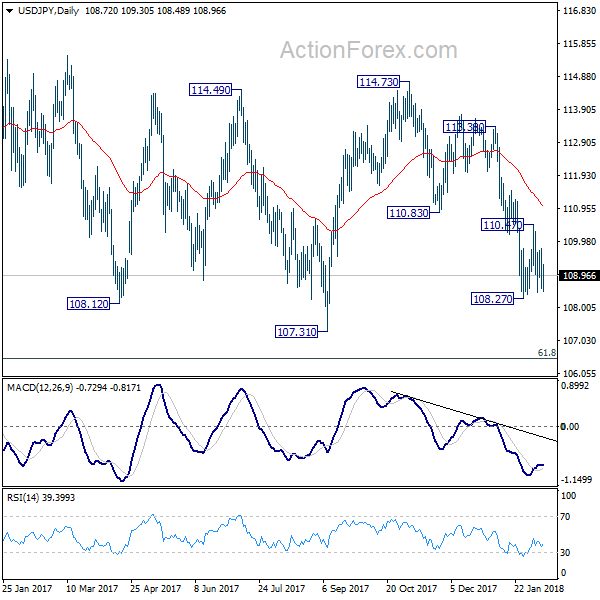
USD/JPY is still bounded in range of 108.27/110.47 and intraday bias remains neutral. As noted before, larger decline from 114.73 is possibly still in progress. Break of 108.27 will also resume the medium term correction from 118.65. That will send USD/JPY through 107.31 to 106.48 fibonacci level. Nonetheless, above 110.47 will turn intraday bias back to the upside and bring stronger rebound.
In the bigger picture, current development argues that the corrective pattern from 118.65 is extending. There is risk of dropping further to 61.8% retracement of 98.97 to 118.65 at 106.48. But this level should provide strong support to contain downside and bring resumption of rise from 98.97. However, sustained break of 106.48 will now likely send USD/JPY through 98.97 to resume the corrective fall from 125.85 (2015 high).
USD/CHF Mid-Day Outlook
Daily Pivots: (S1) 0.9320; (P) 0.9394; (R1) 0.9435; More...
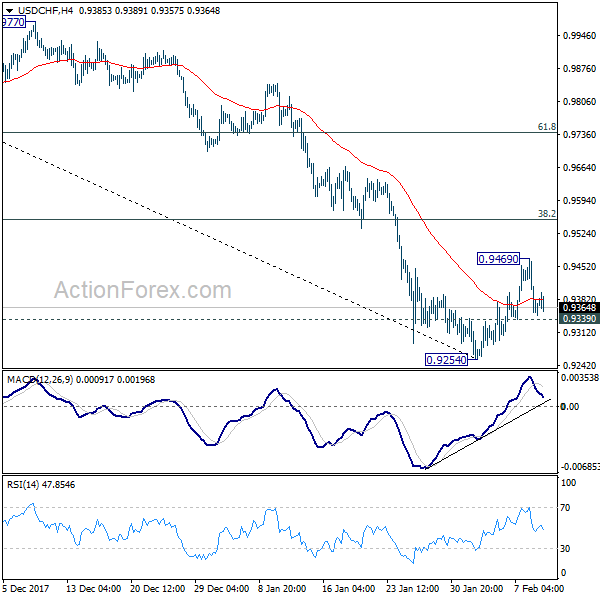
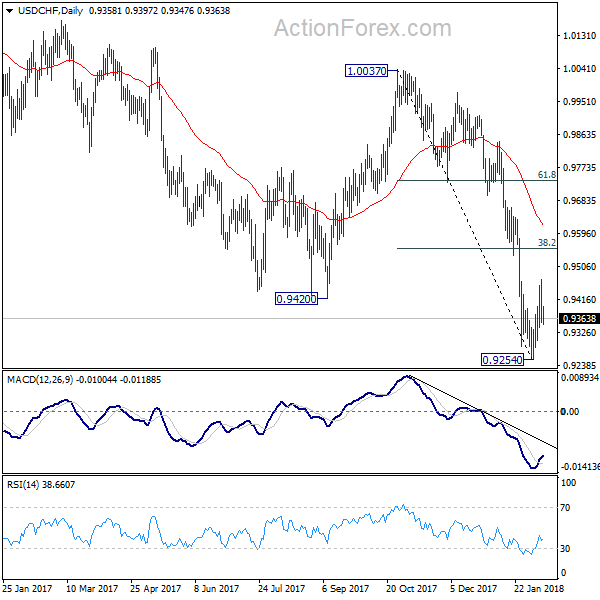
Intraday bias in USD/CHF remains neutral for the moment. On the upside, above 0.9469 will extend the rebound from 0.9254. But at this point, there is no clear sign of trend reversal yet. We'd be cautious on strong resistance from 38.2% retracement of 1.0037 to 0.9254 at 0.9553 to limit upside and bring decline resumption. On the downside, below 0.9339 minor support will turn bias to the downside for 0.9254. Nonetheless, firm break of 0.9553 will bring stronger rebound to 55 day EMA (now at 0.9616).
In the bigger picture, the strong break of 0.9420 support suggests that fall from 1.0342 is developing into a medium term down trend. Deeper fall should be seen to 100% projection of 1.0342 to 0.9420 from 1.0037 at 0.9115. Break will target 161.8% projection at 0.8545. In any case, break of 0.9640 resistance is needed to be the first sign of medium term bottoming. Otherwise, outlook will stay bearish even in case of strong rebound.
EUR/USD Mid-Day Outlook
Daily Pivots: (S1) 1.2207; (P) 1.2250 (R1) 1.2290; More....
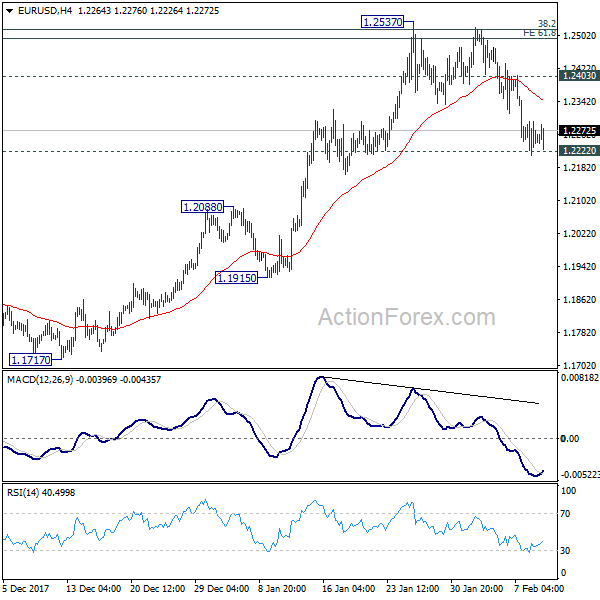
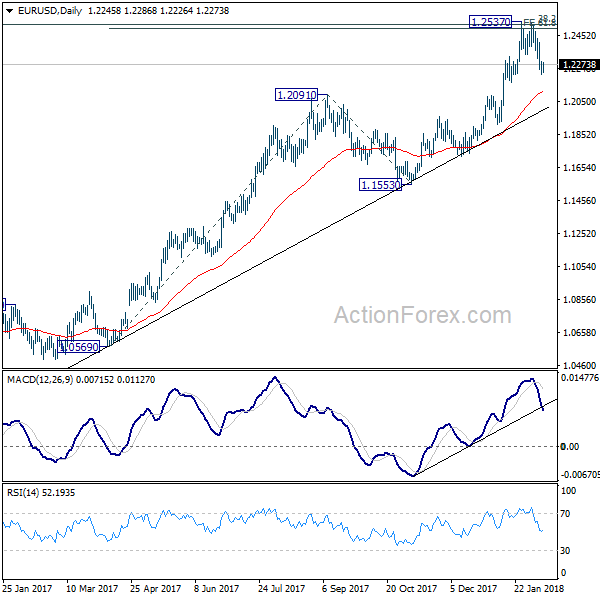
Focus remains on 1.2222 support in EUR/USD. Sustained break of 1.2222 should confirm rejection from 1.2494/2516 key fibonacci level, as well as near term reversal, on bearish divergence condition in 4 hour MACD. That could also signal completion of medium term up trend from 1.0339. In that case, near term outlook will be turned bearish for 1.2091 resistance turned support first. On the upside, though, above 1.2403 minor resistance will revive bullishness and turn focus back to 1.2537.
In the bigger picture, rise from 1.0339 medium term bottom is still seen as a corrective move for the moment. But key fibonacci level at 38.2% retracement of 1.6039 (2008 high) to 1.0339 (2017 low) at 1.2516 is looking vulnerable. Sustained break of 1.2516 will carry larger bullish implication and target 61.8% retracement of 1.6039 to 1.0339 at 1.3862. Nonetheless, rejection from 1.2516 will maintain long term bearish outlook and keep the case for retesting 1.0039 alive.
GBP/USD Mid-Day Outlook
Daily Pivots: (S1) 1.3814; (P) 1.3940; (R1) 1.4035; More.....
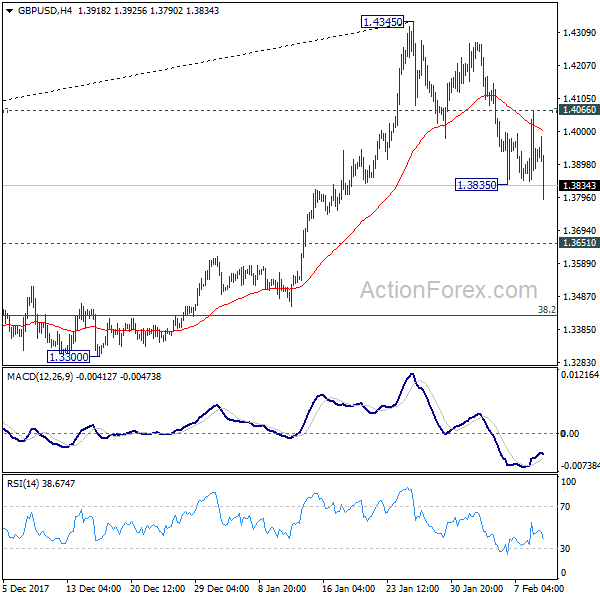
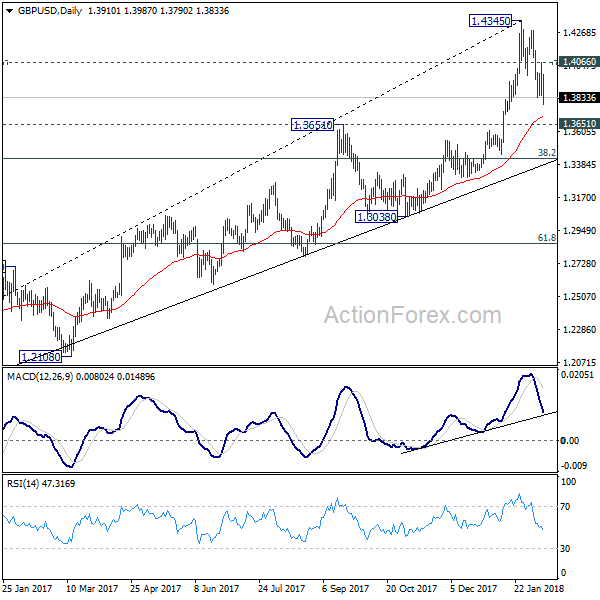
GBP/USD's recovery was limited by 4 hour 55 EMA. Subsequent break of 1.3835 indicates resumption of decline from 1.4345 and intraday bias is turned to the downside for 1.3651 resistance turned support. At this point, it's still unsure whether decline from 1.4345 is correcting rise from 1.3038, or that from 1.1946, or it's reversing the trend. Break of 1.3651 will turn focus to key fibonacci level at 1.3429. For the moment, further decline will remain expected as long as 1.4066 minor resistance holds.
In the bigger picture, sustained break of 1.3835 key resistance level indicates that rebound from 1.1946 is at least correcting the long term down from from 2007 high at 2.1161. Further rise should now be seen back to 38.2% retracement of 2.1161 (2007 high) to 1.1946 (2016 low) at 1.5466. Medium term outlook will stay bullish 38.2% retracement of 1.1946 to 1.4345 at 1.3429, in case of deep pull back.
Sterling Reversed Post BoE Gains, Tumbles Broadly on Barnier’s Brexit Transition Warning
Sterling tumbles sharply today after EU Brexit negotiator Michel Barnier warned that a transition deal is "not a given". That came as Barnier concludes the week long technical discussion between civil servants of UK and EU. And he pointed out there are three "substantial" disagreements remained over the transition period. Firstly, UK wants the rights of EU citizens coming in during the transition period to be different from those who come in before. Secondly, UK wants to retain the right to object to new EU laws during the period. Thirdly, it's uncertain how UK could have a role in new EU justice and home affairs policies during the transition.
US budget deal approved after midnight drama
After some mid-night drama and temporary government shutdown, the US Congress finally approved the 2 year budget deal that would also suspend the debt limit through March 1, 2019. A delay was forced upon by Rand Paul in the Senate as he demanded a vote to keep budget caps in place. Finally, Senate voted 71 to 28 while House voted 240 to 186. Included in the bill is a short term funding for the government through March 23. And the lawmakers now have six weeks to detail the legislation regarding funding at the new level.
RBA lowered unemployment forecast
In the monetary statement published today, RBA lowered unemployment rate forecasts but kept projections on growth and inflation unchanged. Year average GDP growth is projected to be at 3% in 2018 and 3.25% in 2019. CPI is projected to be at 2.25% by the end of 2018 and stay at 2.25% by the end of 2019. Unemployment rate, though, is forecast to drop from current 5.5% to 5.25% by the end of 2018, revised down from 5.50%. Unemployment is forecast to stay at 5.25% till end of 2019.
RBA noted that "financial market volatility has picked up in recent days, most notably in equity markets as market participants have begun to reassess the outlook for global inflation and the withdrawal of monetary accommodation". And, "an important consideration for the outlook is how far inflation picks up as the global economy strengthens." It added that "a larger-than-expected increase in inflation would have implications both for financial market pricing and exchange rates."
On the data front
Canada employment dropped -88k in January, much worse than expectation of 10k rise. Unemployment rate also jumped 0.2% to 5.9%. UK industrial production dropped -1.% mom, rose 0.0% yoy in December, manufacturing production rose 0.3% mom, 1.4% yoy. Trade deficit widened to GBP -13.6b in December. Swiss unemployment rate was unchanged at 3.0% in January. Japan tertiary industry index dropped 00.2% mom in December, M2 rose 3.4% yoy in January. Australia home loans dropped -2.3% mom in December. China CPI slowed to 1.5% yoy in January, PPI slowed to 4.3% yoy.
Also from Australia, home loans dropped more than expected by -2.3% mom in December.
GBP/USD Mid-Day Outlook
Daily Pivots: (S1) 1.3814; (P) 1.3940; (R1) 1.4035; More.....
GBP/USD's recovery was limited by 4 hour 55 EMA. Subsequent break of 1.3835 indicates resumption of decline from 1.4345 and intraday bias is turned to the downside for 1.3651 resistance turned support. At this point, it's still unsure whether decline from 1.4345 is correcting rise from 1.3038, or that from 1.1946, or it's reversing the trend. Break of 1.3651 will turn focus to key fibonacci level at 1.3429. For the moment, further decline will remain expected as long as 1.4066 minor resistance holds.
In the bigger picture, sustained break of 1.3835 key resistance level indicates that rebound from 1.1946 is at least correcting the long term down from from 2007 high at 2.1161. Further rise should now be seen back to 38.2% retracement of 2.1161 (2007 high) to 1.1946 (2016 low) at 1.5466. Medium term outlook will stay bullish 38.2% retracement of 1.1946 to 1.4345 at 1.3429, in case of deep pull back.
Economic Indicators Update
| GMT | Ccy | Events | Actual | Forecast | Previous | Revised |
|---|---|---|---|---|---|---|
| 23:50 | JPY | Japan Money Stock M2+CD Y/Y Jan | 3.40% | 3.60% | 3.60% | |
| 00:30 | AUD | Home Loans M/M Dec | -2.30% | -1.00% | 2.10% | 1.60% |
| 00:30 | AUD | RBA Monetary Policy Statement | ||||
| 01:30 | CNY | CPI Y/Y Jan | 1.50% | 1.50% | 1.80% | |
| 01:30 | CNY | PPI Y/Y Jan | 4.30% | 4.20% | 4.90% | |
| 04:30 | JPY | Tertiary Industry Index M/M Dec | -0.20% | 0.10% | 1.10% | |
| 06:45 | CHF | Unemployment Rate Jan | 3.00% | 3.00% | 3.00% | |
| 09:30 | GBP | Industrial Production M/M Dec | -1.30% | -0.90% | 0.40% | 0.30% |
| 09:30 | GBP | Industrial Production Y/Y Dec | 0.00% | 0.40% | 2.50% | 2.60% |
| 09:30 | GBP | Manufacturing Production M/M Dec | 0.30% | 0.30% | 0.40% | 0.20% |
| 09:30 | GBP | Manufacturing Production Y/Y Dec | 1.40% | 1.20% | 3.50% | 3.80% |
| 09:30 | GBP | Construction Output M/M Dec | 1.60% | -0.10% | 0.40% | 0.10% |
| 09:30 | GBP | Visible Trade Balance (GBP) Dec | -13.6B | -11.5B | -12.2B | -12.5B |
| 12:00 | GBP | NIESR GDP Estimate Jan | 0.50% | 0.50% | 0.60% | |
| 13:30 | CAD | Net Change in Employment Jan | -88.0K | 10K | 78.6K | |
| 13:30 | CAD | Unemployment Rate Jan | 5.90% | 5.80% | 5.70% | |
| 15:00 | USD | Wholesale Inventories M/M Dec F | 0.20% | 0.20% |
Dollar Edges Up as US Government Re-Opens; European Stocks Tumble Again
Here are the latest developments in global markets:
FOREX: The dollar was gaining versus its major counterparts during early European trading hours, posting moderate gains after the US Congress reached a bipartisan deal on a two-year spending bill. The plan promises to increase the debt ceiling and funding on military and domestic programs, though, the markets are concerned that the bill will widen nation's deficit. The dollar index edged up to 90.33 (+0.12%), while dollar/yen and dollar/swissie changed hands higher at 109.13 (+0.35%) and 93.74 (+0.16%) respectively after deep falls yesterday. Pound/dollar could not sustain Thursday's rally triggered by hopes that the BOE will raise interest rates faster than expected following hawkish BOE comments. Today's encouraging British industrial production figures could not support the pair either, with pound/dollar giving up yesterday's gains and slipping back to 1.3875 (-0.22%). Euro/pound was up at 0.8820 (+0.25%), while euro/dollar pared earlier gains sliding to at 1.2241 (-0.03%). Dollar/loonie extended its uptrend towards a fresh five-week high of 1.2615 (+0.04%). Aussie/dollar was slightly up at 0.7785 (+0.09%) (large option expiries are expected to take place today), while kiwi/dollar was last seen at 0.7222 (+0.08%).
STOCKS: The fresh sell-off in the US and Asian equity markets amid rising bond yields and inflation fears spread to the European stocks once again. The pan-European STOXX 600 which lost over 4.0% this year, was trading 0.40% lower at 1045 GMT driven by losses in financials, utilities, and energy, while the blue-chip Euro STOXX 50 was down by 0.36%. The Spanish IBEX 35 declined by 0.35%, the French CAC 40 fell by 0.19%, and the German DAX 30 inched down by 0.09%. US stock futures were in the red, pointing to a negative open.
COMMODITIES: Oil prices were on track to post the worst weekly performance in ten months as concerns over a rising global supply rose after the Energy Information Administration (EIA) stated on Wednesday that the US crude oil production per day touched a record high. Thursday's news that OPEC's member Iran is planning to raise production the next four years added further pressure to the market. WTI crude oil dived by 1.0% on the day to $60.52/barrel, remaining near five-week lows and Brent dropped by 0.62% to $64.41/barrel. In precious metals, gold retreated by 0.32% to $1,314.70/ounce.
Day ahead: Canada's employment data pending
Looking at the economic calendar, Canada will see the release of employment figures at 1330 GMT. However, forecasts show that analysts remain cautious on the labor market despite recent evidence surpassing their projections. Particularly, they believe that the number of employees will increase by 10,000 in January after a strong rise of 78,600 in December, while regarding the unemployment rate, projections are for the measure to inch up by 0.1 percentage points to 5.8%. Note that the Canadian unemployment rate is currently at the lowest level seen in four decades.
In other data, the US will publish readings on wholesale inventories for the month of December at 1500 GMT, while Baker Hughes will report on the US oil rig counts at 1800 GMT, adding further volatility to oil prices.
Regarding today's public appearances, Jon Cunliffe, the Bank of England's Deputy Governor for Financial Stability will be speaking at 1645 GMT.
Corporations continue to release quarterly results as the equity market turmoil persists.
Global Equity Markets Resume Rollercoaster Ride, Gold Sinks Lower
It has certainly been a chaotic trading week for the global equity markets, amid fears of mounting inflationary pressures and higher interest rates.
Asian shares suffered heavy losses during early trading on Friday following Wall Street's steep declines overnight.
Wall Street experienced severe losses on Thursday with the Dow Jones Industrial Average plunging more than 1000 points. Now US stock markets have officially entered "correction territory", investors are wondering whether the long-awaited stock market correction could be upon us. This fear will also likely encourage investors to reconsider whether to potentially purchase stocks at these lower levels, with it being a possibility that the current selloff might be more than just a short-term correction.
Sterling bulls run out of steam
Sterling weakened against the Dollar on Friday, as market excitement over the Bank of England raising interest rates sooner than expected slowly fizzled out.
Although the possibility of higher UK rates could continue supporting the Pound, headwinds around global market volatility and ongoing Brexit uncertainty have the ability to limit upside gains. There was a more muted reaction from investors following the manufacturing and industrial production figures for December, suggesting that investors are not paying as much attention towards the UK economy when speculating over which way Sterling could possibly go next.
From a technical perspective, the GBPUSD failed to achieve a daily close above the 1.4000 level on Thursday. Sustained weakness below 1.4000 suggests that sellers can drive the Pound lower over the coming sessions.
Dollar smiles into weekend
The Dollar edged higher against a basket of major currencies on Friday, thanks to renewed market expectations of higher US interest rates this year.
While there is scope for the Dollar to venture higher amid heightened US rate hike expectations, political uncertainty in Washington could expose the currency to downside risks. Taking a look at the technical picture, the Dollar Index is slowly turning bullish on the daily charts. A solid breakout and weekly close above 90.55 could encourage an incline towards 91.00 and 92.40, respectively.
Commodity spotlight - Gold
Gold weakened on Friday with prices sinking towards $1314 despite equity markets across the globe suffering heavy losses.
It is becoming increasingly clear that the yellow metal remains pressured by a stabilising Dollar and rising expectations of higher US interest rates. Investors would usually expect Gold to benefit from increased stock market volatility, but this has so far not been the case.
If speculation continues to increase over developed central banks increasing respective interest rates, Gold is at risk to further selling pressure.
Focusing on the technical picture, the yellow metal is bearish on the daily charts. Previous support at $1324.15 could transform into a possible "top", potentially encouraging further declines towards the lower $1300s.