Sample Category Title
Euro Steady, Nervous Investors Brace For More Stock Market Losses
The euro has posted slight gains in the Friday session, erasing the losses on Thursday. Currently, the pair is trading at 1.2266, up 0.16% on the day. On the release front, there are no major releases on the schedule. French Industrial Production improved to 0.5%, above the estimate of 0.1%. Italian Industrial Production impressed with a gain of 1.6%, well above the estimate of 0.7%. In the US, the sole event is Final Wholesale Inventories, which is expected to slow to 0.2%.
A rebound in the global economy has been a boon for eurozone exports, and this has boosted the bloc’s manufacturing setor. This was underscored by strong manufacturing reports out of France and Italy in December. Industrial production in both countries improved compared to November, beating the estimates. The Italian reading of 1.6% marked the strongest gain since August 2016. We’ll get a look at Eurozone Industrial Production next week. The November reading surged to 1.0%, marking a 3-month high.
The euro has been under pressure for most of the week, and is down 1.5 percent against the US dollar. The greenback has benefited from sharp volatility in global stock markets this week. The week started with a massive sell-off, and the markets have been in the red for most of the week. This has weighed on the euro, with investors anticipating a faster pace of rate hikes from the Federal Reserve in order to ward off inflation. The Fed had forecast raising interest rates three times in 2018, but if inflation does move higher and the US economy continues its robust performance, we could see four rate hikes this year.
After months of political uncertainty, Germany appears on the verge of forming a new government. On Wednesday, the socialist SDP and Angela Merkel’s conservatives announced that they had finalized a coalition agreement. In the last government, the SDP was the junior partner of the conservatives, but this time around the SDP has extracted major concessions from Merkel, notably control of the powerful finance ministry. This will likely mark a shift in Germany’s eurozone policy, which had been marked by a conservative stance under former finance minister Wolfgang Schaeuble. The weaker members of the eurozone, such as Greece, will likely find a more sympathetic ear for financial help from the SDP than they did from Schauble. The coalition agreement still requires the consent of a majority of the 464,000 members of the SDP, but is expected to pass this final hurdle.
Technical Outlook: AUDUSD – Broader Bears May Take A Breather Ahead Of Key 0.7850/40 Support Zone
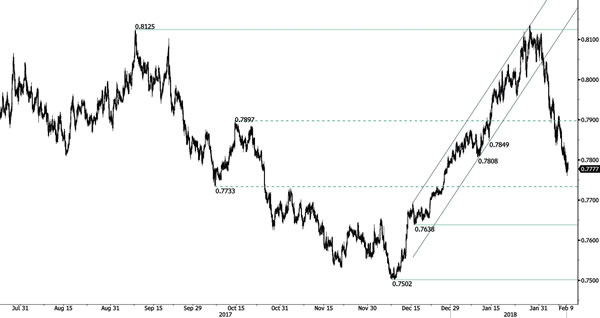
The Australian dollar bounced from new 2018 low at 0.7758 posted on Friday, signaling hesitation ahead of strong supports at 0.7750/40 (200SMA/Fibo 61.8% of 0.7500/0.8135/rising daily cloud top). The pair is moving in steep two-week descend from 0.8135 peak, which could take a breather on oversold studies and week-end profit-taking. Initial barrier at 0.7800 has been tested, with 0.7850 zone coming next and extended upticks to be capped under 0.7900 zone (Fibo 38.2% of 0.8135/0.7758 fall/06/07 Feb double upside rejection) to keep overall bears intact.
Res: 0.7800, 0.7847, 0.7910, 0.7937
Sup: 0.7758, 0.7750, 0.7740, 0.7687
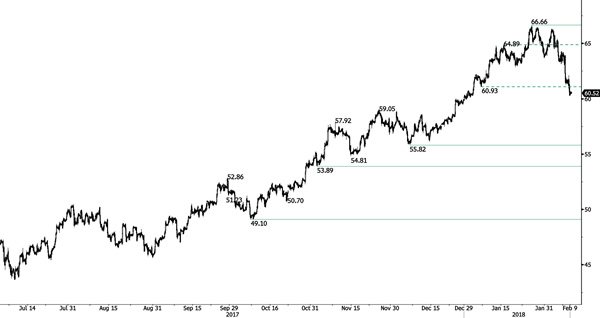
CRUDE OIL Decline Still In Place
Crude oil has broken the key support at 60.93 (05/01/2018 low). Hourly resistances stand at 62.80 (08/02/2018). Strong support is located at 55.82 (06/12/2017 low). Expected to keep increasing as demand remains strong.
In the long-term, crude oil has recovered after its sharp decline last year. However, we consider that further weakness is very likely. For the time being the pair lies in an upside trend since June 2017. Support lies at 42.20 (16/11/2016) while resistance is located at 77.83 (20/11/2014). Crude oil is trading largely above its 200 DMA.
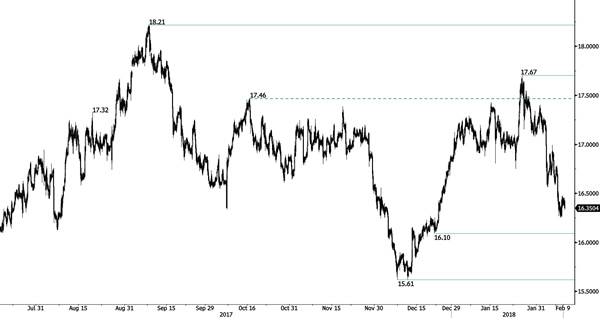
SILVER Weak Bounce
Silver keeps heading lower and trades now below 16.50. The short-term technical structure is turning negative. Hourly resistance lies at 18.21 (08/09/2017 high). The technical structure suggests further short-term decrease.
In the long-term, the trend remains negative/ sideways. Further downside is very likely. The pair is trading below its 200 DMA. Resistance is located at 21.58 (10/07/2014 high). Strong support can be found at 11.75 (20/04/2009).
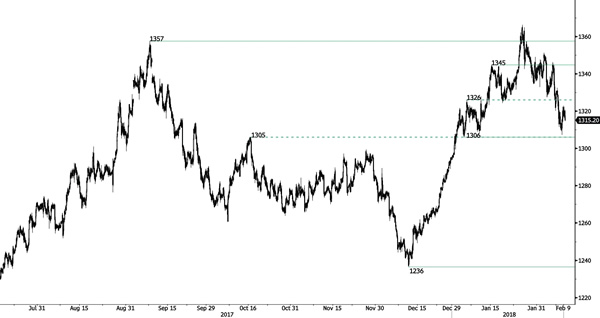
GOLD Recovery Bounce
Gold is recovering after its recent strong sell-off. Resistance is located at 1326 (04/01/2018). Support is now at 1306 (12/01/2018 low). The technical structure suggests however further downside moves.
In the long-term, the technical structure suggests that there is a growing upside momentum. A break of 1'392 (17/03/2014) is required to confirm it. A major support can be found at 1'045 (05/02/2010 low).
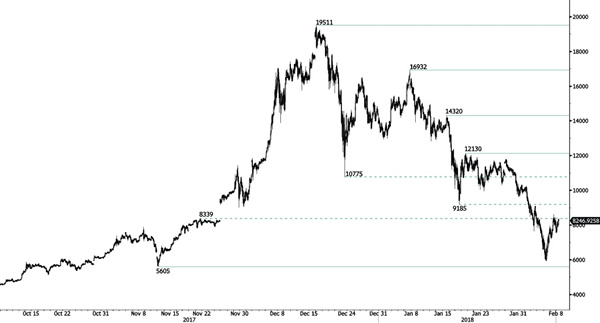
BITCOIN Solid Recovery Bounce
Bitcoin is now retracing above 8200. Strong support stands at 5605 (13/11/2017 low) .Hourly resistance remains at 18628 (08/02/2018). The short-term technical structure suggests further upside moves.
In the long-term, the digital currency has had an exponential growth but also presented important downturns. There is decent likelihood that the currency could stabilize between 7'000 - 12'000 in 2018. Bitcoin is trading above its 200 DMA (6'000 range).
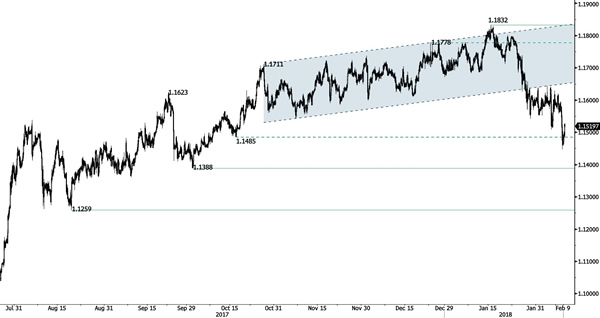
EUR/CHF A New Phase Of Weakness Is Expected
EUR/CHF stabilizes. has broken the key resistance area between 1.1525 and 1.1649. This validates a bearish reversal pattern with an upside potential at 1.1388. Hourly resistance can now found at 1.1593. Next resistance is given at 1.1685 (26/01/2018 high).
In the longer term, the technical structure has reversed. Strong resistance is given at 1.20 (level before the unpeg). Yet, the ECB's slowing QE program is likely to cause buying pressures on the euro, which should weigh in favour of the EUR/CHF. Supports can be found at 1.0184 (28/01/2015 low) and 1.0082 (27/01/2015 low).
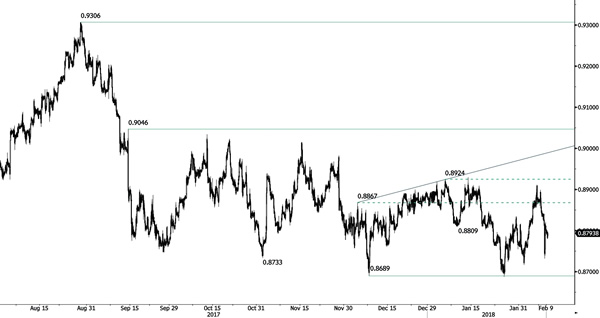
EUR/GBP Directionless
EUR/GBP is trading lower and moves away from resistance at 0.8929 (12/01/2018 high). Hourly support is at 0.8687 (25/01/2018). The technical structure suggests further short-term downside move.
In the long-term, the pair has largely recovered from lows in 2015. The technical structure suggests further upside pressure. The pair is trading above the range of its 200 DMA. Strong resistance can be found at 0.9500 (psychological level).
AUD/USD Collapse
AUD/USD has weakened further and is now challenging the support at 0.7733. Hourly resistance at 0.7808 (01/09/2018) is now outpaced. The technical structure suggests further short-term weakness.
In the long-term, the trend is turning flattish and fails reaching key resistance at 0.8164 (14/05/2015 low). Key support stands at 0.6009 (31/10/2008 low). A break of the key resistance at 0.8164 (14/05/2015 high) is needed to invalidate our long-term bearish view.
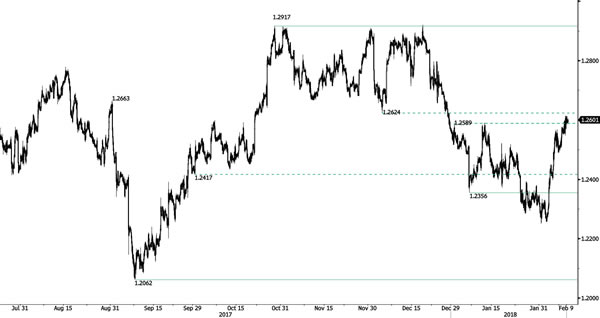
USD/CAD Bullish Momentum
USD/CAD is now trading in the 1.26 range and outreached support at 1.2589 (01/01/2018). New resistance is now at 1.2796 (22/12/2017 high) while further resistance remains at 1.2917 (27/10/2017 high). The technical structure indicates that further short-term rise is expected.
In the longer term, the pair is trading between resistance point at 1.3805 (05/05/2017 high) and support at 1.2128 (18/06/2015 low). Strong resistance is given at 1.4690 (22/01/2016 high). The pair is likely to head lower. The pairs is trading below 200 DMA.