Sample Category Title
USD/CHF Grinding Higher
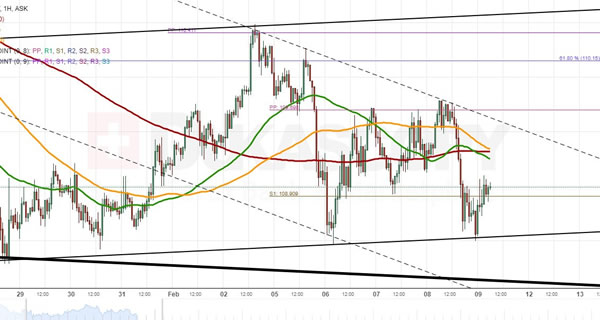
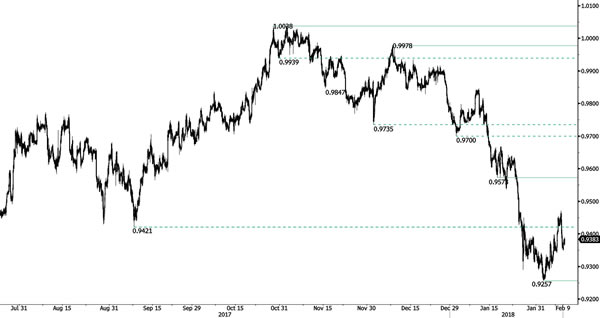
USD/CHF has broken the key resistance at 0.9449 (25/01/2018). Even if the declining trendline remains thus far intact, further strength towards the resistance at 0.9573 (17/02/2018) favoured. Hourly supports now stand at 10.9352 (intraday low).
In the long-term, the pair is still trading in range since 2011 despite some turmoil when the SNB unpegged the CHF. Support at 0.9259 (24/08/2015 low) is attainable. Key support remains at 0.9072 (07/05/2015 low) while resistance at 1.0344 (15/12/2016 high) is distanced. The technical structure favours a long term bullish bias since the unpeg in January 2015.
USD/JPY Monitor The Support At 108.33
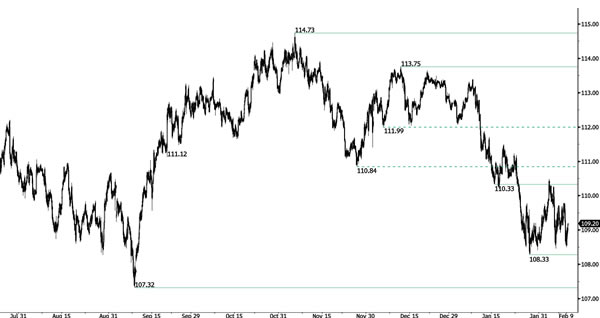
USD/JPY remain weak. Although the support at 1108.33 is intact thus far, we suspect a limited upside potential in the short-term. Hourly resistances can be found at 109.73 (08/02/2018). The technical structure suggests further shortterm downside moves.
We favor a long-term bearish bias. Support is now given at 107.32 (08/09/2017 low). A gradual rise towards the major resistance at 125.86 (05/06/2015 high) seems unlikely. Expected to decline further support at 101.20 (09/11/2016 low).
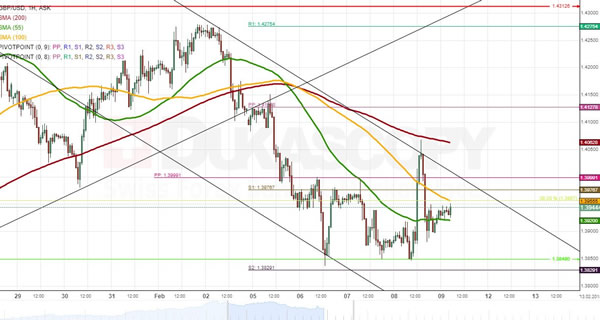
GBP/USD Base Support Holding
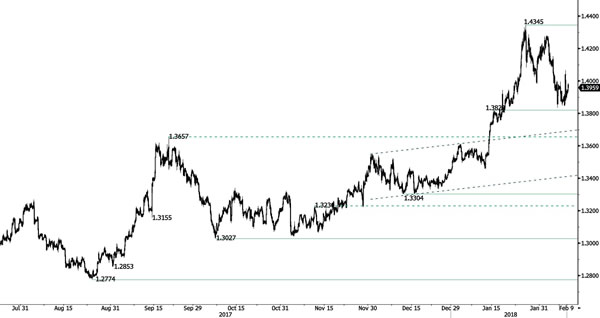
GBP/USD has successfully challenged support at 1.3830 and is bouncing higher. Hourly resistance can be found at 1.4067. The technical structure suggests further potential downside move.
The long-term technical pattern is reversing. The Brexit vote had paved the way for further decline but the pair is moving to 2016 highs. A long-term support given at 1.1841 (07/10/2017 low) and a strong resistance at 1.5018 (24/06/2016 high) are identified
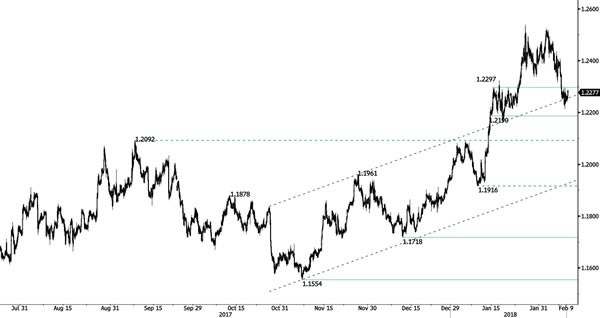
EUR/USD Trying To Bounce
EUR/USD is bouncing on support at 1.2223 (23/01/2018 low). Support is located at 1.2190 (15/01/2018 base low). Hourly resistance can be found at 1.2297 (15/01/2018 high). The technical structure suggests further short-term downside moves.
In the longer term, the momentum is turning largely positive. We favor a continued bullish bias. Key resistance is holding at 1.2886 (15/10/2014 high) while strong support lies at 1.1554 (08/11/2017 low).
Tensions Remain Ahead Of The Weekend
FX market stands still despite global equity rout
The FX market has been only slightly affected by the sell-off in equities. Moreover, even risk-haven currencies, such as the Japanese yen and the Swiss franc, were of limited interest to investors. Overall, the US dollar enjoyed renewed interest from traders. The dollar index hit 90.57 yesterday, up roughly 1.6% on the week. The index's gains were contained by the appreciation of the Japanese yen.
However, both the Swiss franc and the Japanese yen reversed momentum on Friday with the CHF and JPY down 0.35% and 0.45% against the greenback, respectively. This is somewhat surprising as the US government shut down once again on Friday morning. Investors seem to be not overly fussed about it, which suggests that they remain confident a solution will be find on Friday. Indeed, the lower house is expected to vote early morning.
We see limited risk for further USD weakness as the overall risk-off sentiment is rather dollar supportive for now. However, today will be key as a renewed sell-off in equities ahead of the weekend could trigger a panic reaction. Indeed, investors have always been reluctant to load on risk ahead of weekends. In the FX, this could translate into rising buying pressure in the Japanese yen and Swiss franc. The effect on the greenback is more uncertain.
MXN: recovery to resume
While resurgent volatility suggest that risk asset are still in jeopardy, in general high beta FX have not been materially affected. S&P 500 saw all sectors close down over 300bps as US yields rallied yet FX remained stable. This lack of contagion to us indicates that stock are not going to go much lower as this is a technical correction rather than a structural shift. In the FX EM Mexican Peso is increase becoming attractive. Banxico raised interest rate 25bp while providing a hawkish tone signaling that more hikes are likely. Inflation has come down marginally yet weaker MXN is could change this trend.
It's unlikely given domestic and global environment that inflation will come down meaningfully. We don't see any dovish policy communication until 2019 and could see rates peak at 5.75%. Also, we continue to see a soft NAFTA result. Despite Trumps feet stomping US – Mexico trade economy is deeply integrated. Any action would have complex result and most can be easily circumvented. We would see current USDMXN strength as an opportunity to reload shorts.
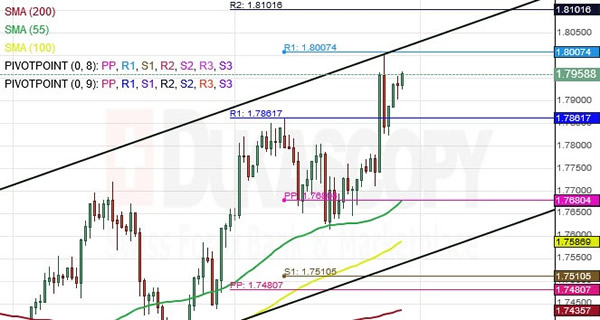
GBP/AUD 4H Chart: Full Review
The GBP/AUD pair has been confined by an ascending channel since after it touched the lower boundary of the dominant channel at 1.6180 early September, 2017.
After reaching the 50.00% Fibonacci retracement level, the currency exchange rate continues it smooth movement north. This retracement can be measured by connecting the low at 1.6180 and the high at 1.8007.
As for the near future, analysts project that the pair is likely to continue rally until it breaches the upper boundary of the dominant channel. If or when it happens, the movement could find resistance at the monthly pivot point at 1.8101.
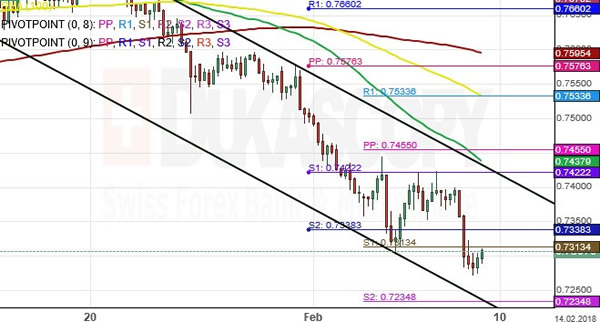
AUD/CHF 4H Chart: Likely Breakout
The Aussie has been trading in an ascending channel against the Swiss Franc since early December. After hitting its upper boundary on January 22, the currency exchange rate started to depreciate notably during this past weeks.
The AUD/CHF pair has continued to maintain its channel down and could be heading to a speculated target of the monthly pivot point at 0.71.
Technical indicators favour a further decline for the Aussie . In addition, traders should watch out for a likely breakout from the lower boundary of the descending channel.
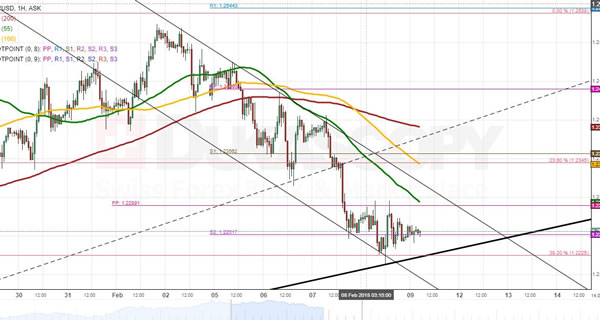
EUR/USD Analysis: Reaches Senior Channel
EUR/USD introduced no changes to its overall price level on Thursday, as it remained fluctuating between the 38.20% Fibo retracement and the monthly PP in the 1.2225/89 area. Meanwhile, the Euro has reached the bottom boundary of both the junior and senior channels. The latter was formed late in October. According to technical indicators, some upside potential still exists. Also, the rate should accelerate northwards in line with the prevailing channels. However, the combined resistance of the monthly PP and the 55-hour SMA circa 1.23 is likely to hinder the Euro for some time or even halt its movement up. In case this area is breached, the ultimate high for the given session should be the 100-hour SMA and the 23.60% Fibo near 1.2350. Bottom limit for today— the weekly S3 at 1.2170.
GBP/USD Analysis: Stranded In Narrow Range
The first part of Thursday's trading session was spent with no changes to the overall price level for GBP/USD, as traders were cautious prior to the BOE policy statement scheduled for 1200GMT. Even though the bank kept the rates on hold, Carney's comments about sooner hike strengthened the British Sterling above its two-day resistance of 1.40. This relatively high position was not maintained for long, as the 200-hour SMA near 1.4075 forced bulls to abandon their positions as a result of which the Pound fell slightly below the 38.20% Fibo and the 100-hour SMA. However, it did remain above the 55-hour SMA which could allow bulls to make another advancement, especially if the UK reports solid manufacturing production data at 0930GMT. A possible trading range for today could be 1.4060/1.3830.
USD/JPY Analysis: Falls Below SMAs
USD/JPY spent Thursday’s morning in between the bounds of the weekly PP and the 100-hour SMA. However, as risk-averse investors started buying the Yen mid-session, the US Dollar fell 100 pips within a couple of hours, thus dashing through the strong support of the 100-, 55– and 200-hour SMAs. This fall was stopped solely by the bottom boundary of a two-week channel near the 108.60 mark. Technical indicators suggest that this period of decline could continue in this session, as well, especially if the current stock volatility persists. In addition, no significant events that could push the rate above all three SMAs at 109.30 are scheduled for today. In case of strong bearish sentiment, the ultimate low should be the weekly S2 at 107.60, while a more possible target is the bottom channel line near 108.60.