Sample Category Title
Summary 1/8 – 1/12
Monday, Jan 8, 2018
[php_everywhere] [/php_everywhere]
Tuesday, Jan 9, 2018
[php_everywhere] [/php_everywhere]
Wednesday, Jan 10, 2018
[php_everywhere] [/php_everywhere]
Thursday, Jan 11, 2018
[php_everywhere] [/php_everywhere]
Friday, Jan 12, 2018
[php_everywhere] [/php_everywhere].
Weekly Economic and Financial Commentary: Higher Retail Sales, Budget Deficits and Treasury Yields
U.S. Review
Higher Retail Sales, Budget Deficits and Treasury Yields
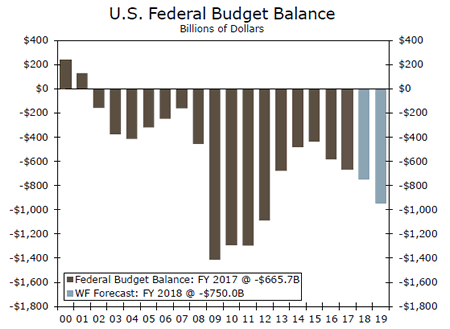
- Data released on Thursday showed the federal budget deficit was $23.2 billion in December and $225 billion through the first three months of federal fiscal year 2018 as concerns grew regarding a potential surge in Treasury issuance.
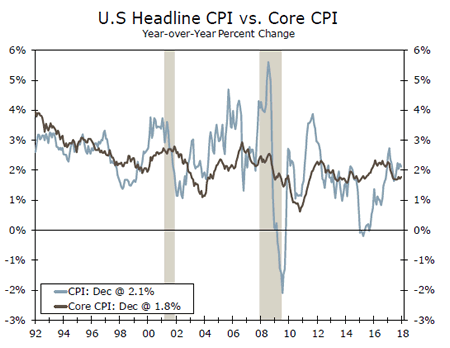
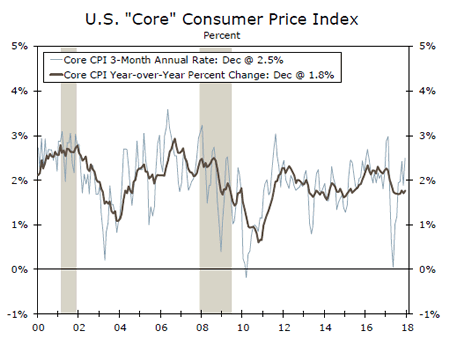
- The consumer price index met expectations for headline growth, up 0.1 percent in December, and topped expectations for the core index, which rose 0.3 percent.
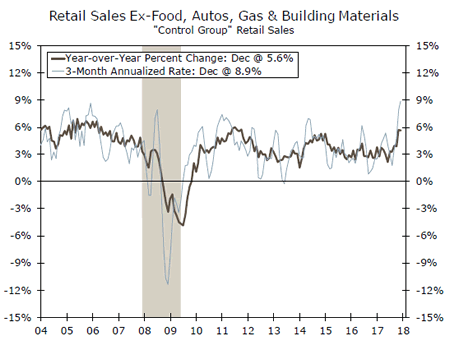
- Retail sales growth posted another solid reading in December, suggesting a healthy contribution to GDP growth in Q4 from U.S. consumers.
Higher Retail Sales, Budget Deficits and Treasury Yields
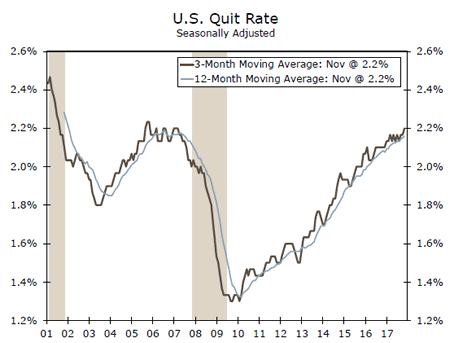
The Job Openings and Labor Turnover Survey (JOLTS), import price index and producer price index all came in a bit on the soft side in the first few days of the week. Job openings edged down for a second straight month in November, a respite from the sharp run-up over the first three-quarters of 2017. Openings are up 4.4 percent over the past year, but that marks a slowdown from earlier and, if sustained, suggests a more moderate pace of hiring ahead. Though progress has been painfully slow, the quit rate has slowly grinded higher, suggesting improved worker confidence in the labor market (top chart).
On the inflation front, import prices rose 0.1 percent in December, lifted by a 1.8 percent increase in fuel prices. Non-fuel prices were soft, however, falling 0.1 percent in the month, but still managed to increase 1.0 percent in 2017, the largest annual gain since 2011. The headline producer price index (PPI) unexpectedly fell in the month, and core measures of the index were softer-than-expected across the board. Despite a depreciating trend for the dollar and robust survey/production data for U.S. firms, the December import price index and PPI showed few signs of imminent price pressures from these sources.
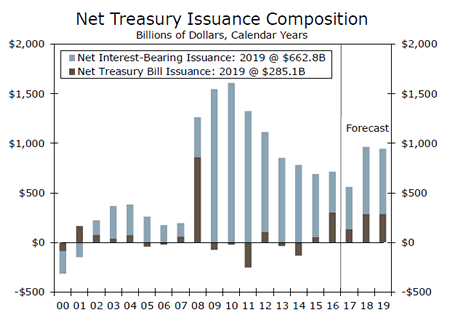
Data released on Thursday showed the federal budget was $23.2 billion in December and $225 billion through the first three months of federal fiscal year 2018. Earlier this week, U.S. Treasury yields jumped at the long-end of the curve as concerns arose about a surge in Treasury issuance on the horizon. Since September, we have been nearly $200 billion above the Congressional Budget Office's FY 2018 budget deficit forecast. This expected surge in net Treasury issuance can be attributed to three main factors 1) bigger deficits from the tax cuts, 2) greater spending across the board (our expectation that there will be higher budget caps for defense/non-defense spending in addition to the multiple bills for disaster aid related to the hurricanes and California fires) and 3) a backlog of debt to be issued as a result of the Treasury being up against the debt ceiling for much of 2017.
The consumer price index (CPI) met expectations for headline growth, up 0.1 percent in December, and topped expectations for the core index, which rose 0.3 percent. On a year-over-year basis, headline CPI is up 2.1 percent and the core has risen 1.8 percent. Though this was higher relative to the Bloomberg consensus, the core CPI has hovered between 1.7 percent and 1.9 percent every month since March, a stable string of readings that suggests a continued gradual pace of monetary policy tightening by the FOMC.
Retail sales rose 0.4 percent in December, boosted by stronger sales from non-store retailers, building material retailers and food service places. Control group sales, which excludes food, gas, building materials and autos and feeds directly into the consumption line of GDP, rose 0.3 percent in December and November was upwardly revised to a robust 1.4 percent reading. Together, this brings the three-month average annualized rate to 8.9 percent, the fastest pace of growth since September 2003.
U.S. Outlook
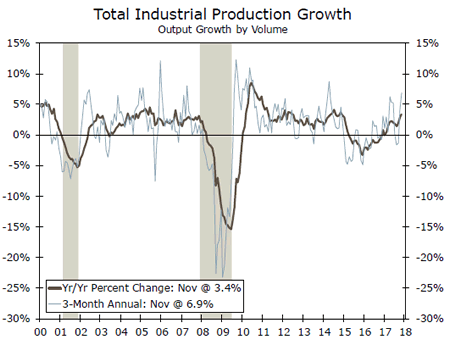
Industrial Production • Wednesday
Industrial production edged up 0.2 percent over the month in November, falling slightly short of expectations of a 0.3 percent gain. However, the report brought a positive surprise in an upward revision of October's initially reported 0.9 percent gain to 1.2 percent. Manufacturing produces roughly three quarters of industrial production, and posted a slight positive gain to follow up October's strong jump. Utilities production, on the other hand, fell by nearly 2 percent, as 2017 gave us the seventh warmest November in history. Mining output posted its eighth monthly increase of the year in November.
While industrial production has shown modest growth, capacity utilization has been relatively weak. This measure has room to run, and combined high business confidence, a relatively weaker dollar and recently passed tax cuts, we could see industrial production firm even further as we move into 2018.
Previous: 0.2% Wells Fargo: 0.4% Consensus: 0.4% (Month-over-Month)
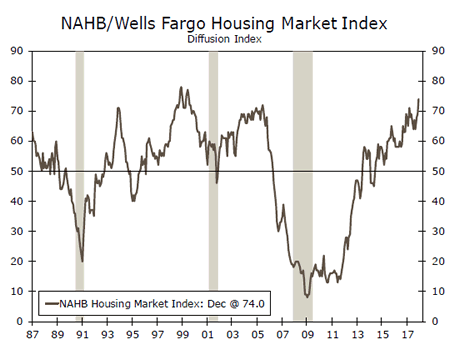
NAHB Housing Market Index • Wednesday
December's NAHB/Wells Fargo Housing Market Index was one for the record books, rising five points to 74 and posting the highest level since 1999. This historic confidence indicates that homebuilders are eager to ramp up production, as long as they can find the lots and workers to do so. All three components of the index increased in December, led by an eight point gain in buyer traffic. Growing buyer demand has been stoked by strengthening employment and income growth, as well as soaring consumer confidence. The low level of available for-sale inventory has created fierce competition among buyers, and that should only ramp up as demand gains more momentum.
Builders have been selling homes about as quickly as they can build them. Our outlook is that buyer traffic will continue to build into 2018, keeping builder confidence high while enjoying the insatiable buyer demand.
Previous: 74 Consensus: 72
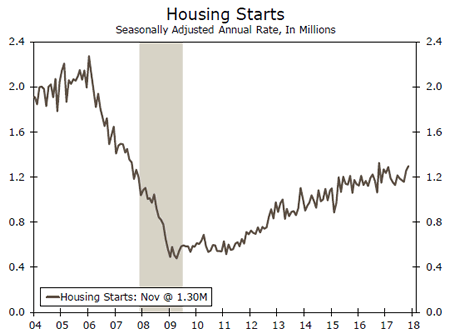
Housing Starts • Thursday
Single-family housing construction reached a cycle-high pace of a seasonally adjusted annualized 930,000 units in November. Results were mixed geographically. Starts in the South and West, the two largest regions for home construction, increased, while the Midwest and Northeast declined. Revisions from this summer's hurricanes pushed a significant portion of building activity into November, which is a primary reason for the cycle-high reading. However, the trend is definitively positive given solid readings in both October and November, and we expect December to continue the trend.
We expect residential investment to continue ramping up across the country, providing a significant boost to Q4-2017 GDP as well as in 2018.
Previous: 1,297K Wells Fargo: 1,280K Consensus: 1,270K
Global Review
Strong Q4 Economic Data in Europe
- Measures of business confidence have been overstating the strength of the Eurozone economy in 2017, but the disconnect between the "soft" and the "hard" data may be starting to narrow as industrial production in the Eurozone grew strongly in November.
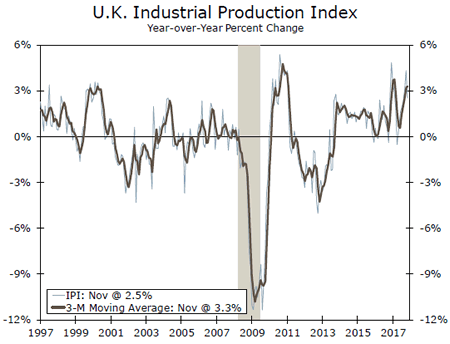
- Incoming data suggest that real GDP growth in the United Kingdom was solid in Q4.
Brazilian Economy Continues To Pick Up Steam
- The volume of Brazilian retail spending rose much more than expected in November.
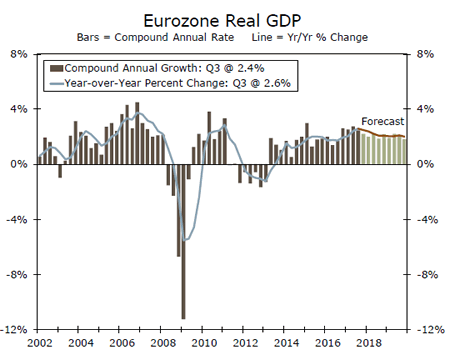
Strong "Hard" Data in Eurozone in Q4
A curiosity of the current economic expansion in the Eurozone has been the disconnect between "soft" and "hard" economic data. For example, the Ifo index of German business sentiment, which historically had a high degree of correlation with growth in German industrial production (IP), has soared to record highs in recent months (see chart on front page). Yet, growth in IP has remained disappointing, at least in a historic context.
Perhaps that disconnect is starting to narrow. Data released this week showed that German IP jumped 3.4 percent in November relative to the previous month. On a year-ago basis, IP was up 5.6 percent in November, the strongest growth rate in six years. German statistical authorities also announced that preliminary estimates show that real GDP grew 2.2 percent in 2017. If confirmed by the more complete data that are scheduled for release next month, 2017 will have been the strongest year for German GDP growth since 2011.
Data released this week by other countries in the euro area were generally strong as well. IP in the overall Eurozone grew 1.0 percent in November, which followed the 0.4 percent rise in October. Retail spending in the euro area was up 1.5 percent in November relative to the previous month. The monthly data give us more confidence that our estimate for real GDP growth in the fourth quarter (0.6 percent sequentially, 2.5 percent year over year) is realistic (top chart).
U.K. Economic Data Also Solid
Across the English Channel, economic data out of the United Kingdom also were generally solid this week. British IP rose 0.4 percent in November relative to the previous month, and survey data suggest that retail spending rose solidly in December. However, the real trade deficit appears to have widened in the fourth quarter, which likely exerted some headwinds on Q4 GDP growth. That said, a well-respected British think tank announced that it estimates that real GDP grew 0.6 percent (not annualized) on a sequential basis in Q4. If realized, it would be the strongest rate of sequential growth for the U.K. economy in 2017.
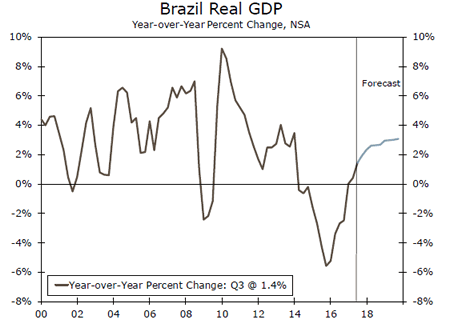
Brazil Continues To Surprise On the Upside
The Brazilian economy suffered a deep recession in 2015-2016, but it is growing again. Data released this week showed that the volume of retail sales rose 5.9 percent in November on a year-ago basis, which was significantly stronger than most analysts had expected. The outturn gives us more confidence that our forecast of strengthening growth on a year-over-year basis in coming quarters is reasonably on track (bottom chart). Although a measure of consumer price inflation rate edged up from 2.8 percent in November to 3.0 percent in December, it remains well below the 10 percent rate that was registered in late 2015/early 2016. Not only has the sharp fall in inflation allowed the central bank to slash interest rates, which has helped to support growth, but it has shored up real income, which is leading to the stronger growth in consumer spending which was noted previously.
Global Outlook
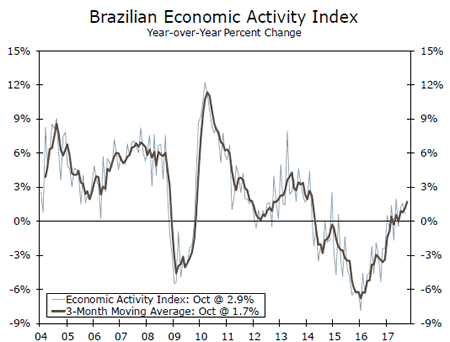
Brazil Economic Activity • Monday
Although the Brazilian political system lacks clarity, especially this year as the presidential election approaches, the Brazilian economy has finally been able to untangle itself from all the problems that remain and has started to grow, albeit from a very slow base. On Monday, markets will be able to take a look at whether this improvement continued in the fourth quarter of 2017 by taking a look at the monthly economic activity index, a monthly proxy for GDP, for November. The index has been relatively volatile month over month but positive for September and October. Thus, a positive reading in November will add to the already upbeat expectations that the economy has turned the corner for good. The year-over-year rate, which was 2.9 percent in October, was the strongest since February 2014, so a strong showing by this rate would also cement a sense of continuous improvement in economic growth.
Previous: 2.9% Consensus: 2.5% (Year-over-Year)
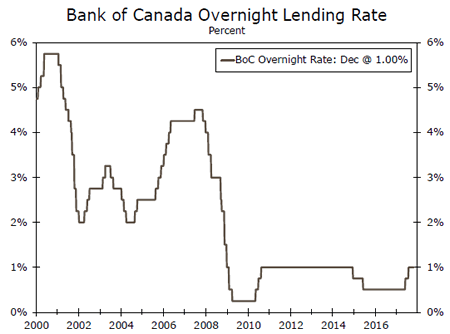
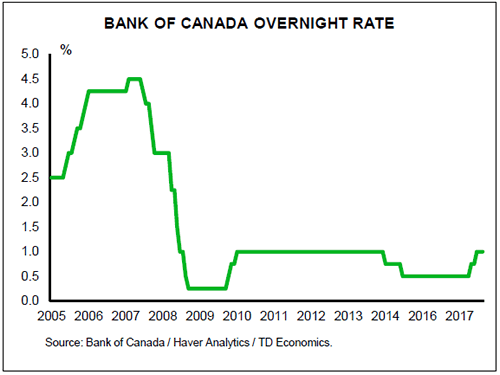
Bank of Canada Interest Rate • Wednesday
North America came out of the gates early in this latest global tightening cycle with the U.S. Federal Reserve, the Bank of Canada and the Bank of Mexico leading the way in terms of higher interest rates. While one of the reasons has to do with the geographic proximity to the United States of both Canada and Mexico, other reasons are fundamentally domestic.
In this sense, we expect the Bank of Canada to continue with its own tightening campaign by increasing its target rate 25 bps, to 1.25 percent on Wednesday. The recent employment report and the uptick in CPI inflation lifted the odds of an increase. This follows a 25 bps increase in July and another one in September of last year. Going forward, we expect the Bank of Canada to continue to follow the events south of the border and decide on further moves according to its policy needs.
Previous: 1.00% Wells Fargo: 1.25% Consensus: 1.25%
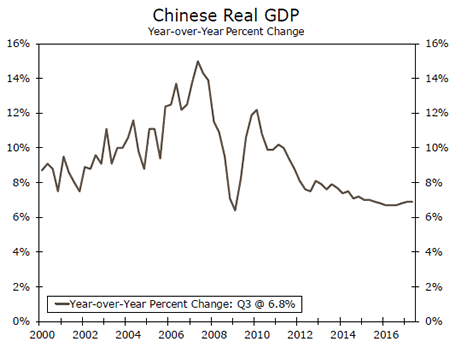
China Q4 GDP • Thursday
Next week will end with the release of Chinese Q4 GDP growth. Markets are looking at more of the same from Chinese GDP growth, expecting a growth rate of 6.7 percent compared to a 6.8 percent rate during the previous year. On a quarter-over-quarter basis, markets expect a growth rate of 1.7 percent, not annualized, similar to the previous quarter.
Also on Thursday, we will get both retail sales and industrial production for December. Markets are expecting retail sales to have ended the year up 10.2 percent, unchanged from the previous month, year over year. Meanwhile, industrial production is expected to come in at 6.1 percent in December, also unchanged from the November reading. Thus, markets expect no surprises coming from the second-largest economy of the world, which will probably be good news for the global economy.
Previous: 6.8% Wells Fargo: 6.7% Consensus: 6.7% (Year-over-Year)
Point of View
Interest Rate Watch
Evolution of the Outlook
Looking into 2018, our outlook was for three Fed funds rate increases (March, June and September) based upon the evolution of the inflation rate over this period. But at the intermediate and long-end of the Treasury yield curve, the rise in rates would also reflect the funds rate increases but with a significant degree of uncertainty, and added volatility, as the Fed attempts to reduce its balance sheet while the U.S. Treasury increases debt issuance and deficit projections rise.
Inflation: FOMC Follows Its Model
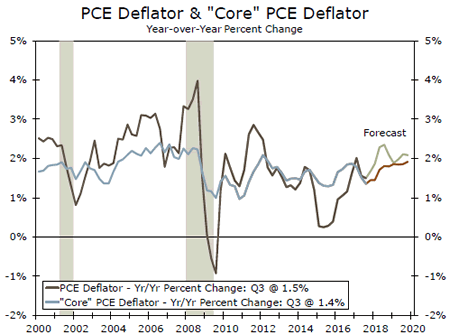
For the FOMC, the increase in the PCE deflator projected in our annual outlook should be sufficient to justify the FOMC rate increases in both March and June of this year. We project the PCE deflator to hit 2.3 percent by the second quarter of this year. After three years of below target (2 percent) inflation the wait will be over. Yes, it is easy to be skeptical that inflation will hit the 2 percent target but we are now seeing stronger final demand and an unemployment rate below 4 percent by midyear.
Reducing the Balance Sheet
Balance sheet reduction is a second tool for the FOMC to normalize interest rates (middle graph). Our view is that this reduction will be painless in the first half of 2018 but by the third quarter, the reductions will mean actual net redemptions of Treasury debt—particularly in the three, five and seven year maturity range. Effectively this is a reduction in the demand for Treasury debt by one of the three big buyers of Treasury debt—the Fed, China and Japan.
But Supply? Rising
Looking forward, the supply of Treasury debt is expected to rise steadily for the next two years. The conflict between reductions in Fed demand and rising Treasury issuance presents a challenge to investors for the second half of this year. Already we have witnessed an increase in two-, three-, five-, seven- and 10-year yields above what was expected in the market just one month ago. We began the year with an above consensus 10-year rate forecast, a good start for the outlook.
Credit Market Insights
Cycle High Consumer Credit
Consumer credit grew nearly $28 billion in November, registering the largest monthly gain in 16 years. This large increase in new debt is an indication of continued confidence in the economy, as buyers appear increasingly willing to borrow to fund consumption habits. Despite slowing slightly in December, consumer confidence hit a 17-year high in November.
Revolving credit, mostly credit card debt, rose $11.2 billion, or 13.3 percent. This increase caused total outstanding revolving credit to not only surpass pre-recession highs, but reach a fresh series high of about $1.0 trillion. The surge in credit card balances in November is yet another sign of increased spending during the holiday season.
Similarly, nonrevolving credit, which is mostly made up of student and auto loans, rose 16.8 billion, or by 7.2 percent. Nonrevolving credit was somewhat driven by increased auto loans, still partially attributable to effects from storm related damages.
With the holidays now behind us, and hurricane replaced buying surely fading away, will elevated levels of borrowing continue? We expect continued confidence and tight labor conditions to continue to drive consumer credit in the near future, but remain cautious of a slowing in borrowing as the economic cycle continues to mature.
Topic of the Week
Peak Inflation?
A sharp slowdown in inflation last spring was one of the big surprises of 2017. After finally reaching the Fed's 2 percent target last January, inflation, measured by the PCE deflator, slowed to 1.5 percent by the third quarter. This year, however, we expect to see a meaningful pickup in inflation in the middle of the year, at least when measured by the conventional year-ago basis.
Last year's surprise weakening can be largely traced to a couple of categories. The cost of wireless phone services fell 7.0 percent in March alone, leading to a rare monthly decline in core inflation. Also last spring, inflation for shelter and physician services slowed markedly. The trend among all three categories has strengthened in recent months, pushing core CPI when measured on a three-month annualized basis up to 2.5 percent. Unless core inflation declines again this spring, base effects are set to lead to a noticeable pickup in core and, consequently, headline, inflation when measured from a year ago by the middle of the year.
The higher trajectory is unlikely to persist, however. We expect the year-over-year rate of inflation to peak around mid-year. Core inflation is likely to continue to drift higher as the economy strengthens, but the pickup will be gradual as inflation expectations remain historically low and fierce price competition persists.
At the same time, the lift to headline inflation from higher energy prices is set to fade. Oil prices were up more than 10 percent in the fourth quarter compared to the prior year, but such large percentage gains will be tougher to achieve as the market becomes more balanced. We expect energy to be a small drag on headline inflation in the second half the year as oil prices fall below current levels.
With the expected moderation in the second half of this year stemming from the volatile energy sector and tougher base comparisons for the core index, we suspect it will not get in the way of further Fed rate hikes this year. That said, with inflation just around 2.0 percent, tightening should remain slow.
The Weekly Bottom Line: Upbeat Data Bolster Case For March Hike
U.S. Highlights
- The second week of 2018 marked another strong performance in equity markets. While the advance did take a breather midweek, the main American stock indices resumed their upward trajectory, rising to new highs. The rally received an added fillip from oil prices, which gained additional ground, thanks in part to a bullish inventory report.
- Economic reports drove in the point that the U.S. economy ended the year on solid footing. Retail sales rose 0.4% m/m in December, while November sales received a healthy upward revision. Fourth quarter consumption growth is now expected to come in at around 3.3% (ann.), which should help propel growth forward by a robust 2.6% at year-end.
- On the inflation front, data out this morning suggests that price pressures appear to be building. Core CPI saw a stronger-than-expected 0.3% m/m increase, which lifted the y/y pace to 1.8%. Altogether, this week's data helps bolster support for a March rate hike, with two more expected later this year.
Canadian Highlights
- The West Texas Intermediate oil price hit a 3-year high of US$64 per barrel this week, as the market focused on falling U.S. inventories and tensions in Iran.
- Housing starts totaled a healthy 217k units in December, bringing the trend rate to a solid 227k units.
- The Bank of Canada's Business Outlook Survey revealed that sentiment among firms remained positive in the final quarter of 2017, with healthy hiring and investment intentions pointing to economic strength.
U.S. - Upbeat Data Bolster Case For March Hike
The second week of 2018 marked another strong performance in equity markets. Tax reform and upbeat economic data helped support investor sentiment. Markets hiccupped temporarily mid-week on renewed concerns about NAFTA, and an unsubstantiated report that senior Chinese officials have recommended slowing or halting the purchase of U.S. Treasuries. The main American stock indices shrugged off these concerns, and resumed their upward trajectory to new highs. The rally received an added fillip from higher oil prices, thanks in part to a bullish inventory report.
Economic reports reinforced the view that the U.S. economy ended the year on solid footing, setting the stage for robust momentum heading into 2018. Retail sales rose 0.4% m/m in December, while November received a healthy upward revision to 0.9% from 0.8% previously. Gains were broad based, with strength seen in categories such as building material, food & beverage, and non-store retailers. Considering these data, fourth quarter consumption growth is expected to come in at around 3.3% (annualized), which should help real GDP growth advance by a solid 2.6% at year-end.
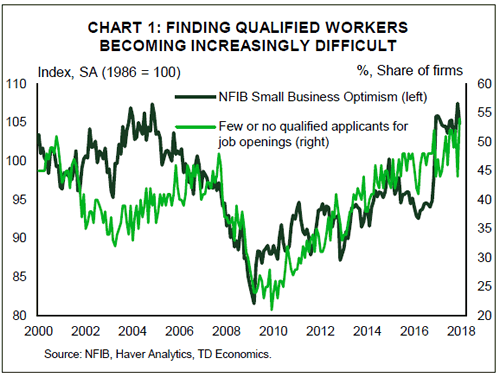
Complementing strong consumer spending, small business owners remained upbeat. Although confidence pulled back slightly in December, the reading remained at historically high levels. Moreover, the recent upbeat trend in optimism has been accompanied by the increased difficulty in finding qualified workers (Chart 1). Given the tightness in the labor market, businesses will need to boost worker compensation in order to attract and retain talent. They will have an improved ability to do so thanks to tax reform which will lower some of the tax burden. This narrative, corroborated by an upward trend in the share of small businesses planning to raise compensation, provides additional comfort with regards to our inflation outlook.
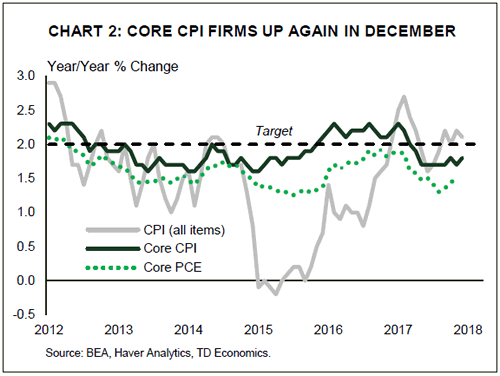
On that note, inflation data out this morning suggests that price pressures appear to be falling into place. While headline inflation was held back by declining energy prices, recording only a modest uptick, the more important aspect of the report was that core CPI saw a stronger-than-expected 0.3% m/m increase, buoyed by gains in shelter costs, healthcare-related costs and vehicle prices. This nudged up the y/y pace of core inflation to 1.8% in December (Chart 2). The lack of price pressures has long puzzled the Fed, holding back the pace of interest rate normalization. But, this week's data is consistent with a Fed that is likely to hike this March and twice more in 2018.
The potential for overheating, given the combined impact of fiscal stimulus and a tight labor market, may necessitate a slightly faster pace of hikes. But for now, we views risks for three hikes in 2018 as roughly balanced. For instance, the fact that core inflation has remained in the 1.7 to 1.8% range for the past eight months makes one month of strong data not very reassuring. Strength was also concentrated in a few key categories, which may not prove sufficient to buoy inflation on a sustained basis. A radical makeover of the Fed, which has a number of vacancies, along with the possibility of a government shutdown as early as next week, pose additional downside risks.
Canada - Slowly But Surely, Higher Interest Rates On The Way
It was a quiet week on the Canadian data front, but oil was shining bright, with the WTI benchmark reaching a 3-year high of nearly US$64 per barrel and the Canadian WCS benchmark reaching US$38 per barrel after hitting a low of US$29 per barrel in December.
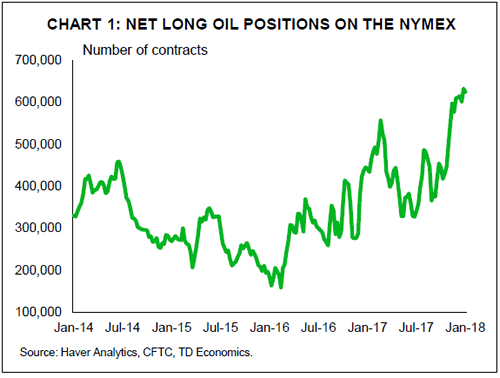
While inventories have come down somewhat, global supply is still abundant, suggesting that global prices have run too high too fast. Speculative activity has played a role in the run-up in prices in recent weeks, with WTI net long positions on the NYMEX sitting at a record high. Improving prospects for global growth, uncertainty and tensions in the Middle East and a decline in U.S. inventories have contributed to the optimism in the market. However, prices over US$60 per barrel will lead to more U.S. shale production, prolonging the rebalancing period. The U.S. Energy Information Administration (EIA) revised up its 2018 forecast for U.S. production by nearly 200k barrels per day this week, with output now expected to hit a record in the first quarter, three quarters earlier than previously thought. With production on the rise in the U.S. – in addition to increases in Canada, Brazil and the North Sea – it is unlikely that prices will stay above that threshold on a sustained basis. What's more, with such a high level of speculation in the market, the risks for prices are heavily skewed to the downside.
The Canadian dollar did not benefit from higher oil prices, as it fell back below the 80 US cent level this week. Much of the weakness came following news that Canadian government officials said that there is an increasing likelihood that President Trump will pull out of NAFTA. The next set of negotiations are scheduled to take place in Montreal on January 23-28, with another round scheduled to happen in Mexico in February. A U.S. withdrawal from NAFTA would have significant ramifications for the Canadian economy, but the recent concerns are unlikely to prevent the Bank of Canada from hiking the overnight rate next Wednesday, particularly given recent suggestions that negotiations could in fact be prolonged further, stretching into the Summer to account for upcoming Mexican elections.
Governor Poloz has indicated that interest rate decisions will be data dependent and most recent data releases point to higher interest rates. In addition to the stellar jobs report released last Friday, this week's housing starts data showed that builders broke ground on a solid 217k new homes in December. Moreover, the Bank of Canada's Business Outlook Survey – a key forward-looking indicator – revealed that sentiment among Canadian businesses remained positive during the final quarter of 2017. Healthy hiring and investment intentions indicate underlying strength in the economy and less need for emergency level interest rates.
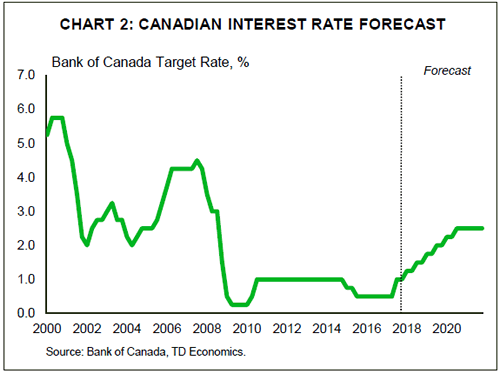
That said, a rate hike next week does not necessarily mean that the Bank will embark on a rapid tightening cycle. Given high household debt levels, uncertainty surrounding the impact of the B20 mortgage measures and risk associated with the NAFTA renegotiations, the Bank must be careful in how quickly it raises rates so as to not derail the economy. As such, we expect a gradual pace of tightening over the next two years, of about 25 bps every six months.
Canada: Upcoming Key Economic Releases
Bank of Canada Rate Decision
Date: January 17, 2018
Previous Result: 1.00%
TD Forecast: 1.25%
Consensus: 1.25%
NAFTA rumours have injected a dose of uncertainty into next week's meeting but we do not think they will be enough to derail a rate hike that's 80% priced by the market and almost universally expected by economists. We look for Poloz's data dependence to outweigh his risk management framework. The evolution of data since the December FAD has been undeniably upbeat, as evidenced by further gains in CPI and the labour market, while the one GDP report that disappointed was weighed down by transitory factor. With a January rate hike well priced, the larger question for markets will be whether Poloz tries to talk down an OIS curve which is pricing in over three hikes for 2018. Given Poloz's aversion to forward guidance, we think it is unlikely he tries to steer market expectations with a "dovish hike" but watch out for a speech in the near future to reprice markets.
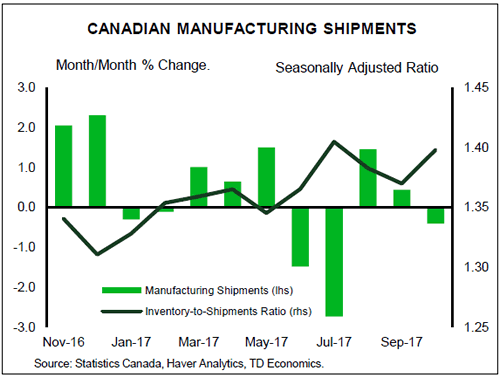
Canadian Manufacturing Sales – November
Release Date: January 19, 2018
Previous Result: -0.4% m/m
TD Forecast: 2.1% m/m
Consensus: 1.5% m/m
We expect manufacturing sales to post a firm 2.1% m/m rebound in November led by a partial normalization of motor vehicle production. Imports of motor vehicle parts surged in November, pointing to a rebound in assemblies after retooling shutdowns constrained output in the prior month. Energy products will be another source of nominal upside owing to a surge in gasoline prices, while volumes could see marginal benefit from pipeline shutdowns that restricted the flow of crude oil to US refineries. Outside of these two industries, the combination of a broad increase in factory prices and a pickup in hours worked favours a strong rebound from October. We expect real manufacturing sales to underperform the nominal print with a gain of roughly 1%, but nonetheless contribute positively to industry-level growth.
Chart: Canadian Manufacturing Shipments
Australia & New Zealand Weekly
Week beginning 15 January 2018
- 'The week that was', data previews, calendar and forecasts.
- Australia: Westpac-MI Consumer Sentiment, employment, housing finance.
- NZ: house sales & prices, retail card spending, Survey of Business Opinion.
- China: Q4 GDP, fixed asset investment, retail sales, industrial production.
- US: housing starts & permits, Beige Book, University of Michigan consumer sentiment.
- Central banks: BoC policy decision.
- Key economic & financial forecasts.
Information contained in this report was current as at 12 January 2018.
The week that was
Data releases for Australia at the beginning of 2018 have delivered a number of surprises. Most notable amongst these have been surging dwelling approvals and retail sales.
Starting with dwelling approvals, against October's flat outcome and the market's November expectation of a 1% fall, the near 12% gain was certainly eye catching. Interestingly, it was in large part due to a jump in Victorian approvals, a 38% surge following October's 21% jump. Both of these outcomes came as a result of strength in the highly-volatile high-rise apartment category. In stark contrast to the goings on in Victoria, approvals were little changed elsewhere, falling 2% in the month following an 8% decline in October. The trend for detached dwellings remains far more muted: they fell 2% in the month to be only 2% higher than a year ago. Overall, the November report points to the housing construction cycle having more enduring strength than anticipated. However, we still believe that we are past the peak in activity. Hence, GDP growth is unlikely to receive lasting support from the sector. Given the very volatile nature of this data, a large downside 'surprise' in coming months seems highly likely.
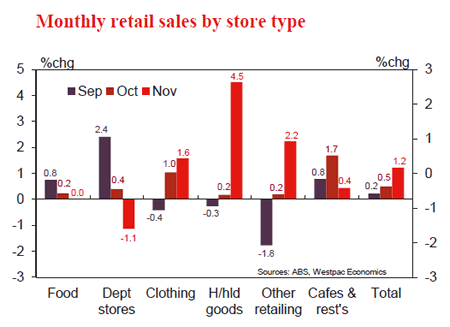
Moving then to retail sales, a 1.2% surge was reported in November - three times the gain the market had expected. For further detail, see chart of the week below.
While a week old, it is also worth mentioning that the Australian trade deficit was larger than anticipated in November (-$0.6bn) and that the October result was also revised down (from +$0.1bn to -$0.3bn). For the most part, this downside surprise looks to have been driven by the commodity sector, particularly gold in November. Consumption good imports did rise, but not in scale consistent with the above retail sales surge. One suspects therefore that November's retail sales outcome will be followed by stronger consumer imports come the December trade report. Needless to say, direct imports of consumer goods from offshore merchants are of no benefit to our own economy, as the income spent flows straight out of the country.
Moving offshore, to date in 2018 it has been financial markets that have been the focus rather than economic data. The one 'economic event' of note is the minutes of the ECB's last policy meeting. These carried a very positive tone as growth remained strong and confidence at record highs. Yet their optimism remained conditional on a policy stance in "crisis configuration" (that is, extraordinarily easy monetary policy). In time, an increasingly self-sustaining growth cycle will see the ECB Governing Council bring asset purchases to an end, and plans to raise rates come to light. We see the first event as occurring at the end of the year (or, if conditions improve further, potentially at the current program's September end date), but the latter not until well into 2019. In the interim, from as early as the next policy meeting, a gradual firming of the language used to describe the economy will be seen to slowly 'make known' to the market the ECB's intent. It has to be said though, given the Euro's gains against the US dollar during the past month, the market looks to have already pre-empted this shift in forward guidance.
Finally on the US, little has changed since late-2017. Debate on the effectiveness of the now-passed tax bill continues to rage on. On the one hand are comments such as those of Atlanta Fed President Bostic: "among businesses surveyed after the House of Representatives' version of the tax overhaul had been approved, two-thirds or more of larger firms said the changes would not prompt them to expand investment or hiring". But on the other are individual company decisions such as that made by Walmart to increase the hourly wage paid to their lowest-paid workers from February, from $9-10 to $11. Suffice to say that the US economy is very large and the tax package very complex; ergo, the net aggregate effect will take considerable time to digest. Regarding the FOMC, the positive tone of financial markets generally in early 2018 has rubbed off on market expectations for the next Fed hike. The market's view on the timing is that it is now most likely to come in March, and definitely by June (on economic fundamentals, June remains our current expectation). Interestingly, the best guess of the market on the total number of hikes in 2018 is still that there will only be two (also our view). However, it is evident that financial conditions are becoming the swing variable for policy, both in terms of the timing of each decision and whether the cumulative number of hikes will be two (as we and the market expect), three (the FOMC's central forecast) or more.
Chart of the week: November Australian retail sales
Retail sales surged 1.2% in November, well in excess of expectations for a 0.4% rise. Annual growth is at 2.9%yr.
The result reflects a strong consumer response to emerging sales events, namely the Black Friday sales, with a boost in spending across household goods - in particular electronics - as well as the 'other retailing' category. These relatively new events in Australia may be causing a behavioural change in the way consumers shop, postponing purchases in the run up to expected discount periods. That effect appears to not yet be fully captured in seasonal adjustments to the sales data. This dynamic is likely to be behind the increased volatility in the retail sales series of late with Q4 bouncing back from a soft Q3.
Nevertheless, underlying fundamentals for the consumer are still subdued with weak household income growth a constraint on spending. But with the unveiling of Amazon's expanded catalogue a factor in the next December release, there will likely continue to be higher volatility in upcoming retail sales data.
Data Previews
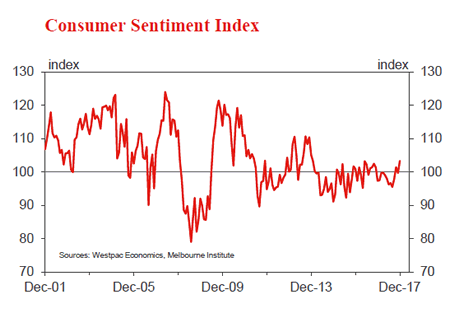
Aus Jan Westpac-MI Consumer Sentiment
Jan 17 Last: 103.3
The Westpac-Melbourne Institute Consumer Sentiment Index rose 3.6% to 103.3 in December from 99.7 in November. The average reading for the Index in the December quarter was 5% above the average for the September quarter when we saw a disturbing slump in consumer spending.
The Jan survey is in the field over the week ended Jan 13. Note that the headline is adjusted to remove a regular 'holiday' sentiment bump worth about 4pts. Other factors that may influence confidence this month include: another strong gain in jobs; but more signs of cooling across Australia's housing markets. Australia's dominance in the Ashes may also add to the Christmas mood.
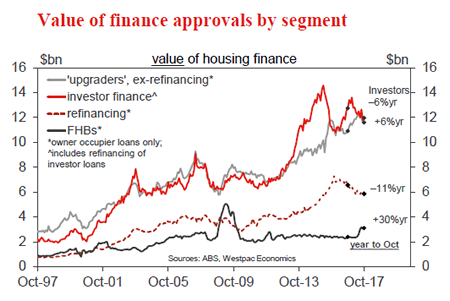
Aus Nov housing finance (no.)
Jan 17, Last: 0.6%, WBC f/c: -1.0%
Mkt f/c: 0.0%, Range: -1.0% to 1.5%
- Housing finance approvals have held up much better than expected given the material housing market slowdown evident in auction clearance rates, prices and turnover. The total number of owner occupier finance approvals dipped 0.6% in Oct, down 0.8% ex refi. The value of investor housing finance posted a 1.6% rise despite multiple downward pressures.
- The Nov update should show a decline. Markets have yet to level out and although the initial adjustment to APRA's macroprudential restrictions have largely passed, we expect some restraint to still be evident. Approvals are expected to decline 1%.
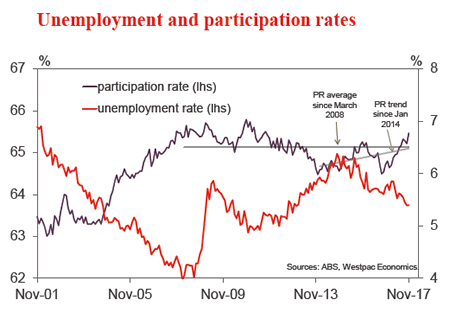
Aus Dec Labour Force - employment '000
Jan 18, Last: 61.6k, WBC f/c: -10k
Mkt f/c: 15k, Range: -10k to 40k
- Total employment rose 61.6k compared the market's 19k forecast and Westpac's +25k. It was the 14th consecutive gain monthly gain in employment matching the historical second longest period of monthly gains which started Aug 1979. The longest period of consecutive employment gains is 15 months starting May 1993.
- The Australian labour market gathered momentum through 2017 with annual employment growth accelerating from 0.9%yr in February to the November peak of 3.2%yr. In the year to Nov total employment has grown 383.3k.
- The pace of employment growth overshot Westpac Jobs Index which is suggesting growth of around 2¾%yr. The Jobs Index is not pointing to a downturn, however, growth is likely to ease back from the +3%yr pace. Westpac's -10k forecast will see it ease to a 2.9%yr pace.
Aus Dec Labour Force - unemployment %
Jan 18, Last: 5.4%, WBC f/c: 5.5%
Mkt f/c: 5.4%, Range: 5.3% to 5.5%
- In November the unemployment was flat at 5.4% (5.40% at two decimal places vs. 5.39% in October) with a 0.3ppt gain participation driving 65.7k surge in the labour force.
- In the November survey the ABS noted that the incoming rotation group had a higher employment to population ratio than both the group it replaced and the entire sample. As such, sample volatility would explain a fair proportion of both the rise in employment and participation in November and thus the flat unemployment rate.
- For December we are expecting a more average sample to roll in which should result in both a lower employment to population ratio and participation rate. This should limit the rise in the unemployment rate to 5.5% despite the 10k dip in employment.
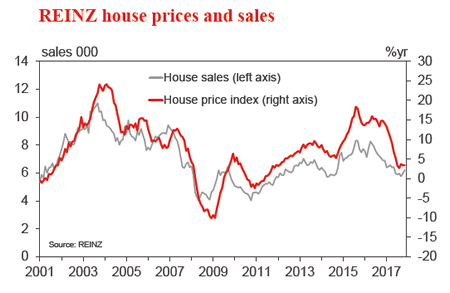
NZ Dec house sales and prices
Jan 15, Sales last: +4.1%, Prices last; +3.5%yr
- The housing market picked up in late 2017, with lower borrowing rates boosting both prices and sales. This reversed some of the softening we saw earlier in the year.
- We expect the positive trend in the housing market to continue for a few more months as buyers rush to beat looming regulatory and tax changes, as mortgage rates fall, and as banks loosen lending requirements following the RBNZ's LVR changes.
- However, over the course of 2018 we expect that changes in Government policy will see the market slow again.
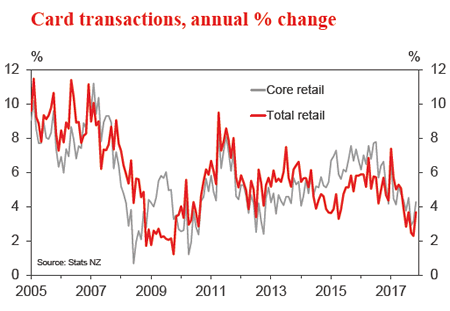
NZ Dec retail card spending
Jan 16, Last: +1.2%, WBC f/c: +0.5%
- Retail card spending rose strongly in November, increasing 1.2%. In part, this was due to increases in fuel prices. However, there were also solid gains in core spending categories, supported by the lift in the housing market and growing prevalence of 'Black Friday' sales.
- Some of the strength that we saw in November reflects that spending was brought forward to take advantage of price discounting, particularly in the case of durable goods. As a result, some payback is expected in December. Balanced against this, late-2017 has seen a second wind in the house housing market, which will provide some boost to spending. Weighing these factors up, we expect a modest 0.5% gain in retail spending in December.
- Heading in 2018, the strength of spending will be challenged by policies aimed at dampening housing market pressures and the gradual slowing in population growth.
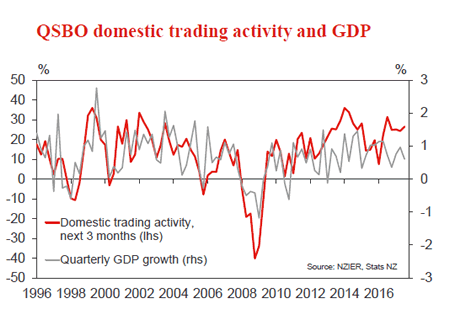
NZ Quarterly Survey of Business Opinion
Jan 16, Domestic trading activity - last: +27
- The previous survey of business opinion was conducted ahead of September's election. It showed that businesses had become increasingly nervous about the broader economic environment. However, they were still fairly upbeat about the prospects for activity in their own firms.
- Three months on, and with a change in Government, it's likely that confidence has taken a further hit. We'll be watching to see how this is affecting businesses' hiring and investment intentions, with other recent surveys pointing to softening activity.
- We'll also be keeping a close eye on the survey's key activity gauges. In particular, we'll be watching how activity in the construction sector is shaping up, and any headwinds that the industry is highlighting. We'll also be watching for signs that capacity or inflation pressures are increasing.
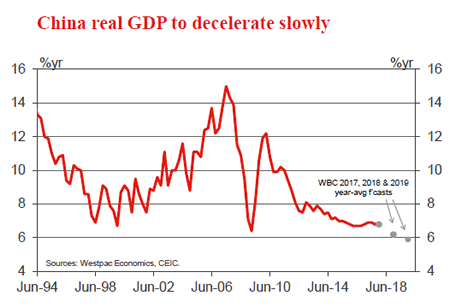
China Q4 GDP
Jan 18, last 6.8%, WBC 6.7%
- China GDP has consistently beaten expectations through 2017, spurred on by external demand as well as a robust pipeline of investment projects that are proceeding to completion.
- It may again be the case that growth surprises to the upside; however, we and the market believe the more likely outcome is that momentum slows a tick from 6.8%yr to 6.7%yr.
- The basis of this view is partly attributable to the slowdown in investment currently being seen across the economy, in both residential and nonresidential construction as well as other investment spending being undertaken by the government and corporates.
- Also key to the growth story is the consumer. Here we see robust demand, but not enough of an acceleration to more than offset the softening investment pulse.