Sample Category Title
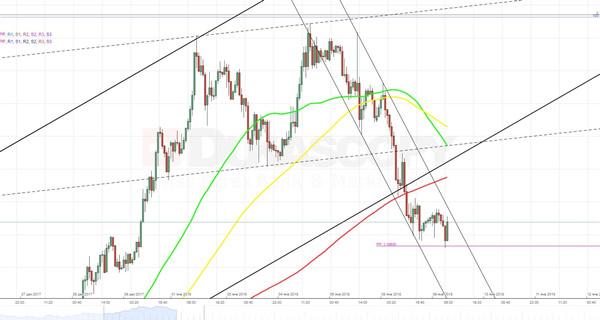
EURUSD Analysis: Crosses 200-Hour SMA
Contrary to expectations, the lower trend-line of a one-month long ascending channel did not managed to stop the currency rate from falling, even though it was additionally backed up by the weekly S1 and the 200-hour SMA.
Basically, yesterday's downfall illustrates the breakout from a larger rising wedge formation, which can be more clearly seen on daily chart. As the pair has already crossed key technical barriers, the plunge is expected to continue. In support of this assumption, the majority of pending orders both in 50- and 100-pip ranges are set to sell. In that case, the closest support levels most probably will be located near the weekly S2 at 1.1953 and the monthly PP at 1.1917.
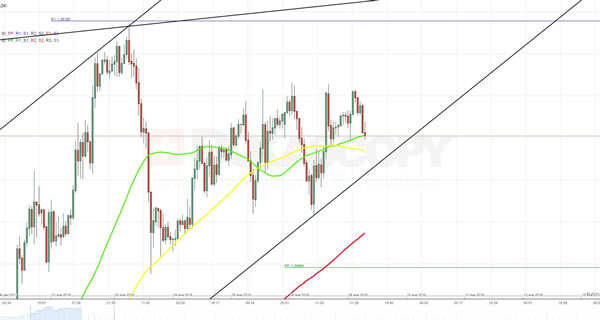
GBPUSD Analysis: Falls But Then Returns To 1.3585
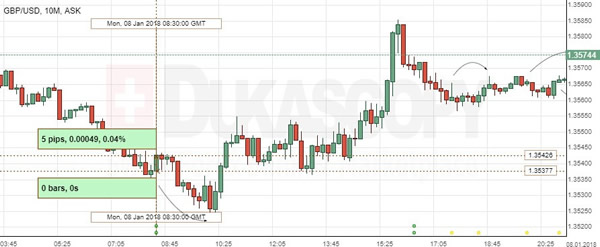
The British Pound is continuing to slowly advance against the Dollar in a one-month long ascending channel.
New trading session the cable started above the combination of the weekly PP, the 55- and 100-hour SMAs, which are expected to provide support for further surge.
Accordingly, the weekly goal for the pair should be an area located between the psychological 1.3600 level and het monthly R1 at 1.3615.
However, it should be noticed that for the past three days the currency rate could not climb above the 1.3585 level, which might lead to a premature breakout from pattern especially in case of high volatility, such as on Friday.
USDJPY Analysis: Down 47 Points
The five-day surge of the Dollar against the Yen was stopped by the upper trend-line of medium scale symmetrical triangle, as expected.
In result of a rebound, the pair started new trading session from the monthly PP at 112.62. After such rapid drops traders usually try to restore lost positions. However, in this case the recovery is not expected to last for long, as northern side is blocked by a combination of the weekly PP, the 55- and 100-hour SMAs. Accordingly, the pair is expected to continue moving to the opposite side of triangle, towards the 50% Fibonacci retracement level located at the 112.45 mark. In support of this assumption, most of the pending orders in 50-pip range are set to sell
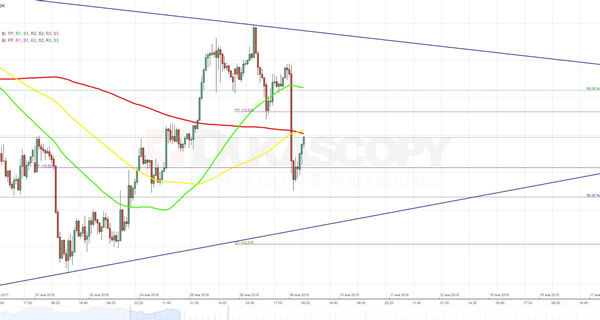
XAUUSD Analysis: Moves Horizontally
In accordance with expectations, previous trading session the exchange rate spent in a horizontal movement. From the north it was obstructed by resistance zone located between the 1,321.00 and 1,322.00 marks, while from the south it was pressured by the weekly PP and the 100-hour SMA.
As economic calendar remains empty, such flat movement might continue for another two days. In the end bulls might try to push the rate to the upper trend-line of a dominant descending channel. Nevertheless, in daily perspective the same pattern clearly points out on imminence of beginning of a downward movement. The bearish stance on the gold additionally supports this assumption.
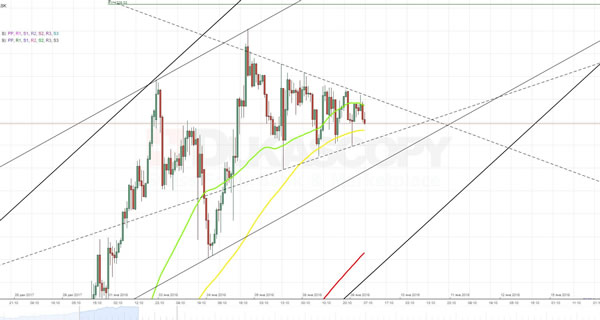
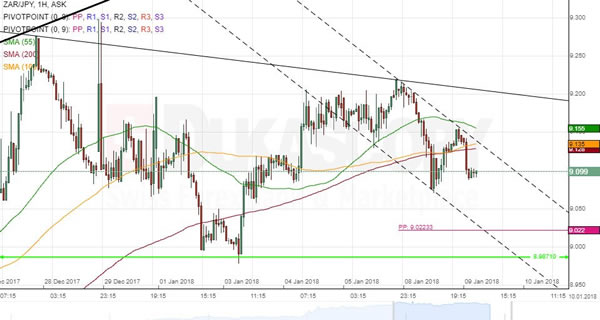
ZAR/JPY 1H Chart: Pair Moves In Triangle
The prevailing pattern that has guided ZAR/JPY for the past two-and-a-half months is a channel up. The latest test of its upper boundary occurred on December 27 when the South African Rand reversed from the 9.27 area. Along the way, a descending triangle was likewise formed with the bottom boundary being the 8.9871 mark and the upper—a declining trend-line. The positioning of both patterns and the strength of the nearest resistance cluster suggest that the pair is likely to decline within this week. The pair should largely respect the triangle until the bottom channel boundary is reached in the 8.95/9.05 territory. Meanwhile, the dashed short-term channel is unlikely to hold for long, as the pair is expected to decline in a flatter manner.
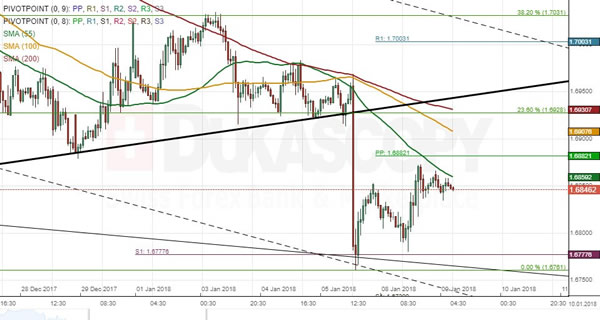
GBP/CAD 1H Chart: Possible Reversal From Channel
GBP/CAD was guided by an ascending channel since mid-August prior to breaching this pattern last Friday in response to solid Canadian employment data. As a result, the Pound fell to the monthly S1 at 1.6778. From theoretical point of view, the pair should go for a retracement from the bottom channel line circa 1.6950. However, given that the 55-hour SMA and the weekly PP are located nearby, this scenario might not be realised in this session, thus leaving the rate in the 1.6800/50 territory. Technical indicators suggest that there might be a change in sentiment within the following trading sessions, thus allowing for the rate to reach the aforementioned 1.6950 are, likewise reinforced by the 100– and 200-hour SMAs and the 23.60% Fibo retracement.
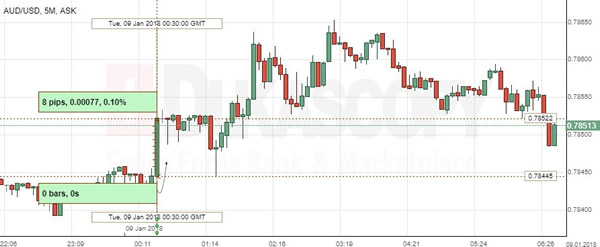
AUD/USD: Australian Building Approvals
The Australian Dollar strengthened against the US, following strong Australia’s property market data. The AUD/USD exchange rate added 0.10% or 8 base points to reach the intraday high of 0.7865.
Approvals to construct new houses in Australia rose to the strongest level in 15 months in November, with more apartment towers getting permission, a surprising return to strength, which is likely to drive hiring and activity within the economy. The Australian Statistics Bureau revealed that building approvals increased 11.7% in November, confounding expectations for a 0.1% decrease. Prior gains were suppressed by higher interest rates, though this time muted inflation growth allowed the RBA to keep rates unchanged for 17 months.
GBP/USD: UK Halifax HPI
The British Pound rose slightly against the Greenback on the country’s house price data. The GBP/USD exchange rate was up to the 1.3542 level, which was easily overstepped during the trading session.
The UK house prices declined unexpectedly in December to mark the first decline in six months, providing additional signs of slack in the country’s property market. The mortgage lender Halifax stated that house prices fell 0.6% month-over-month in December, following a 0.3% gain in November. Analysts anticipate the market to decelerate further to draw Britain’s house prices’ growth of 0.1% in 2018, which would indicate property values declining in real terms, when adjusted for consumer price inflation.
Technical Outlook: WTI OIL Posts New 2 ½ Year High But Risk Of Stall Persists
WTI oil remains well supported and posted new high at $62.53 on Tuesday (the highest since mid-May 2015).
Oil price spiked higher after a narrow three-day consolidation, generating signal of bullish continuation
Overall bullish sentiment remains supported by production cut from major world oil producers as well as reduced US drilling activity.
Fresh strength pressures key med-term barrier at $62.71 (13 May 2015 high) break of which would open way towards next target at $66.72 (50% retracement of larger $107.40/$26.04 fall).
However, traders remain cautious as overbought daily studies continue to warn that bulls may stall and spark corrective action.
Initial bearish signal could be expected on break and close below rising 10SMA ($60.89) which would risk pullback towards psychological $60.00 support and rising 20SMA ($59.25) in extension.
Res: 62.19, 62.53, 62.71, 63.00
Sup: 61.32, 61.08, 60.89, 60.00
Technical Outlook: AUDUSD – Fresh Weakness Pressures Strong Support Provided By Daily Cloud Top / Rising 10SMA
The Aussie accelerated sharply lower in early European hours, erasing brief gains made overnight on upbeat Australian data.
Fresh strength of the greenback put its antipodean counterpart under fresh pressure. The pair trades in red for the second day, with fresh easing testing top of daily cloud (0.7816) and seeing risk of further weakness after Doji reversal pattern was completed on daily chart.
Cloud top is reinforced by rising 10SMA and marks pivotal support, break of which would generate fresh bearish signal.
Extended pullback would face strong support provided by rising 4-hr cloud (spanned between 0.7800 and 0.7745) and next pivot at 0.7728 (Fibo 61.8% of 0.7637/0.7874).
Conversely, extended consolidation with reduced downside risk could be expected while rising 10 SMA holds.
Res: 0.7864, 0.7874, 0.7886, 0.7897
Sup: 0.7814, 0.7800, 0.7785, 0.7745