Sample Category Title
Yen Bounces Up On BoJ Operations, Eurozone Unemployment Expected At Lowest Since 2009
Here are the latest developments in global markets:
FOREX: The US dollar index – which tracks the greenback's performance against a basket of six major currencies – traded slightly lower on Tuesday, after posting some gains on Monday.
STOCKS: Asian markets extended their recent winning streak, with Japan's Nikkei 225 and Topix indices trading higher by 0.6% and 0.5% respectively as the nation returned from a holiday; both indices hovered near multi-decade highs. In Hong Kong, the Hang Seng climbed 0.3%, while in Europe, futures tracking the Euro Stoxx 50 suggest the index may open slightly lower. Over in the US, the S&P 500 and the Nasdaq Composite closed at yet another record high. Meanwhile, although the Dow Jones broke an all-time high as well, it did not manage to sustain its gains, closing at 25,283 after touching the 25,308 mark earlier. Futures tracking the Dow, S&P, and Nasdaq 100 are all currently in the green, albeit marginally.
COMMODITIES: In energy markets, WTI and Brent crude oil were up 0.8% and 0.5% respectively as traders remained bullish on the precious liquid. Data released on Fridayshowed a decline in the number of active US oil rigs, easing concerns that US supply may rise due to the recent increase in prices. Gold was trading down by 0.2%. Given the continued gains in equity markets and the broader risk-on environment, the yellow metal will likely struggle to advance from current levels, at least in the absence of some risk-off event.
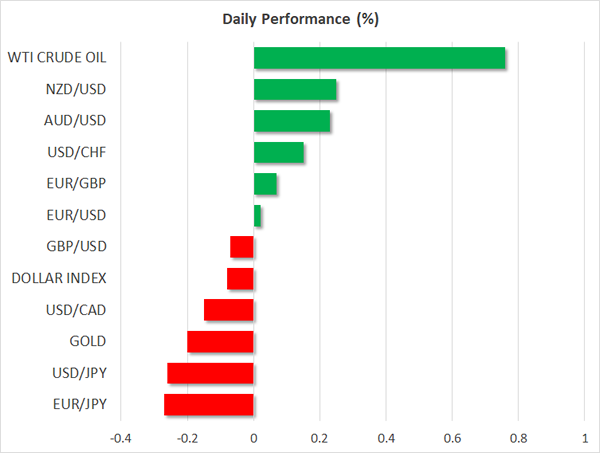
Major movers: Yen spikes higher on BoJ operations, but is this a signal or noise?
The Japanese yen jumped overnight, after the Bank of Japan (BoJ) bought fewer longer-dated Japanese government bonds (JGBs) under its regular operations, generating speculation that the days of ultra-easy monetary policy may be approaching their end. Dollar/yen fell by more than 0.2%, last trading near 112.70 after having touched 112.49 earlier.
The key question here is whether this was a signal of what is to come from the BoJ, or whether it is merely noise in the bigger picture. On balance, this appears more like noise. Under its current QQE with yield-curve control framework, the BoJ has committed to buying enough bonds so as to keep the yields on longer-dated JGBs anchored near 0%. The fact that the BoJ bought fewer bonds today while yields remained near 0% simply shows that the Bank needed to intervene less in the market in order to achieve its goal, which can hardly be read as a policy signal. Indeed, it would be quite strange for the BoJ to begin taking its foot off the stimulus-gas with inflation still so far away from its target. Still, the yen's jumpy reactions to any hawkish BoJ headlines signify that when the Bank does finally signal a policy change, the currency is likely to experience substantial movements.
Elsewhere, the commodity-linked currencies traded higher against their US counterpart. Dollar/loonie was down almost 0.2%, as the gains in oil prices and expectations for a rate hike by the Bank of Canada (BoC) next week kept the Canadian currency under demand. According to Canada's overnight index swaps, a rate increase by the BoC on January 17 is now almost fully priced in, with the implied probability for such an action currently resting at 86%. Aussie/dollar and kiwi/dollar were both up by a little more than 0.2%.
Day ahead: Eurozone unemployment, Canadian housing starts and JOLTS job opening out of the US on today's agenda
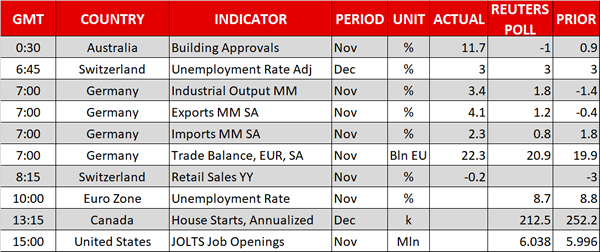
The eurozone's unemployment rate for the month of November will be released at 1000 GMT. It is forecast to fall by 0.1% relative to October, matching its lowest since January 2009 of 8.7% and pointing to a labor market that continues to improve. A positive surprise could instill further confidence in the eurozone growth story, leading to long euro positions. Forex markets are expected to react accordingly to a negative surprise as well.
Canadian housing starts for December are due at 1315 GMT, with loonie traders keeping an eye on the release.
The most important reading out of the US will pertain to the JOLTS job openings report, scheduled for release at 1500 GMT. The number of openings is expected to stand at around 6 million. Deviations from analysts' projections have in the past led to positioning on the dollar.
Minneapolis Fed President Neel Kashari, who voted against all three 25 bps rate hikes delivered last year, is scheduled to participate in a Q&A session at 1500 GMT. It is of note that he will not be holding voting rights in the FOMC during 2018.
In oil markets, the API weekly report including information on US crude oil stocks is due at 2130 GMT.
In politics, the talks between North Korea and South Korea – the first such talks in more than two years – could continue further ahead. The 2018 Winter Olympic Games and North Korea's potential participation fueled the talks, but nevertheless they're seen as a positive step for a more peaceful coexistence between the two countries.
Technical Analysis: USDJPY looking neutral in short-term
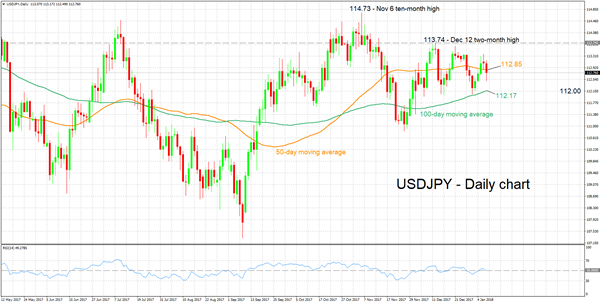
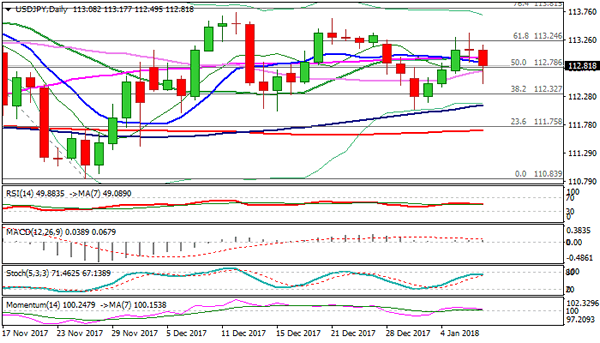
USDJPY has been moving sideways over the last five weeks between roughly 112.00 and 113.74. The RSI is projecting a neutral picture for the pair in the short-term: the indicator has been moving sideways in recent weeks and in proximity to the 50 neutral-perceived level.
A stronger-than-expected JOLTS report out of the US could push the pair higher. The current level of the 50-day moving average at 112.85 might act as resistance to upside movements in price – note that this level failed to provide support as the pair headed lower earlier in the day. Further above, the focus would shift to December 12's two-month high of 113.74 for additional resistance.
Weaker US data would turn the attention to the area around the current level of the 100-day MA at 112.17 as potential support. The range around this mark was congested in the past and encapsulates the 112.00 handle as well, this being a potential psychological level.
BITCOIN Continues To Stryggle As China Moves To Ban Mining
On Sunday, the price of bitcoin continued to slide after Bloomberg reported of a planned crackdown on miners. According to the report, Chinese authorities were planning to phase out gradually mining operations in the country.
To many miners and traders, the planned crackdown was expected. In September, the country banned ICOs and in November, it banned cryptocurrencies exchanges.
This news is significant because China is home to some of the biggest bitcoin miners in the world. This is because of its low energy prices and accessible mining technology.
According to Bloomberg, many bitcoin mining companies were trying to relocate their operations to other countries. Russia has been receptive to them.
If bitcoin were a commodity, the news from China would have been bullish because of reduced supply and increased demand. However, bitcoin is unique because the relocation of miners would make mining expensive and thus go against the role of bitcoin as a cheaper currency.
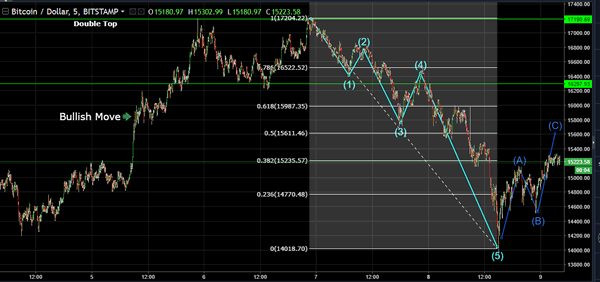
In the chart below, we can see that bitcoin started a bullish trend on Thursday, moving from a low of $14,194 and reached a high of $17,190 where it formed a double top. It then started moving lower, forming a perfect Elliot Wave pattern, which ended yesterday. It then started to form a reversal Elliot Wave. We expect its price to touch the $15,600, which happens to be a significant resistance zone and a 50% retracement level.
Technical Outlook: USDJPY Recovers After BoJ-Inspired Fall, Daily Cloud Top Is Key
The pair is slightly higher in early European trading, following sharp fall to 112.50 in Asia, as Bank of Japan trimmed the amount of its bond purchases.
Market saw the announcement from BoJ as initial signal of possible complete withdrawal of the stimulus, despite BoJ Governor Kuroda's repeated dismissals of such scenario, sending the dollar sharply lower.
Fresh weakness penetrated daily cloud (cloud top at 112.78 was strong support) on spike to 112.50, with subsequent bounce still unable to return above the cloud, keeping near-term bias negative.
Doji reversal pattern that formed on daily chart adds on downside pressure.
While the price holds in the cloud, fresh attempts lower could be anticipated.
Daily cloud base marks strong support at 112.32, followed by 100SMA at 112.13. Daily techs softened on fresh weakness and support negative scenario.
Conversely, return and close above cloud top would sideline immediate bearish threats.
Res: 112.95, 113.17, 113.38, 113.63
Sup: 112.72, 112.50, 112.32, 112.13
Technical Outlook: GBPUSD – Key Supports At 1.3500 Zone In Focus After Repeated Rejection Under 1.3600
Cable moved lower in early European trading on Tuesday after the action in Asia moved within narrow range and repeatedly rejected at 1.3580 zone.
Daily indicators are turning lower and signaling that broader bulls may be running out of steam following several failures at 1.3600/1.3580 zone.
Fresh easing eyes strong support at 1.3500 (rising 10SMA/low of n/t congestion/near Fibo 38.2% of 1.3301/1.3612) which should ideally hold to keep overall bulls intact.
Such scenario includes extended consolidation above 1.3500 before eventual break through 1.3600 pivot for attack at key resistance at 1.3655 (2017 high).
Otherwise, increased risk of deeper pullback could be expected on sustained break below 1.3500 pivot.
Res: 1.3585, 1.3600, 1.3612, 1.3655
Sup: 1.3522, 1.3500, 1.3489, 1.3457

Daily Wave Analysis: EUR/USD Bounces At Top And Shows Bearish Breakout And Momentum
Currency pair EUR/USD
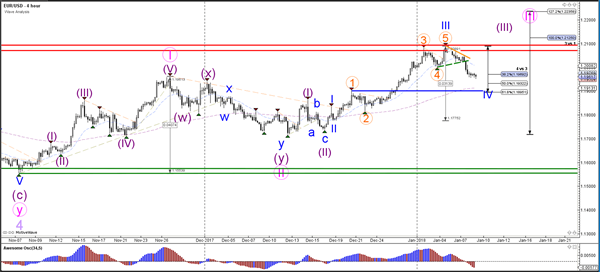
The EUR/USD made a bearish breakout below the support trend line (dotted green) after bouncing at the resistance (red). The bearish retracement could be part of a bearish correction within a larger uptrend continuation where waves 3 prevail. The alternative is that price is not completing a 123 (pink) but a larger ABC correction. A break below the support trend line (blue) and 61.8% Fib of wave 4 makes a bearish scenario more likely.
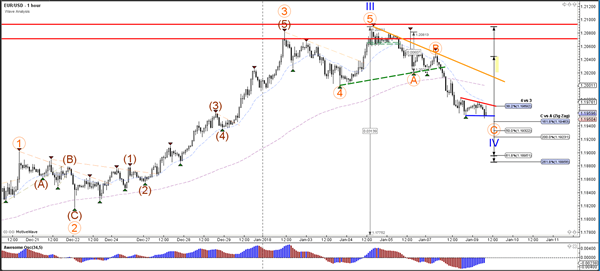
The EUR/USD broke the support trend line and could be building a wave C (orange) correction. A break above the resistance trend line (red) could be a first sign that wave C is over whereas a break below support could see price fall further. A push below the 61.8% Fib makes this wave 4 unlikely.
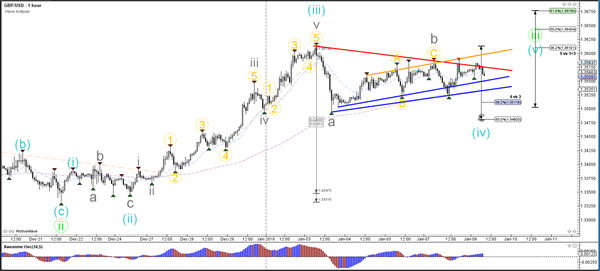
Currency pair GBP/USD
The GBP/USD is building a corrective pattern in the larger uptrend. A break above the resistance trend lines (orange/red) could see price move towards the Fibonacci targets whereas a break below support (blue) could see price make a larger bearish correction.
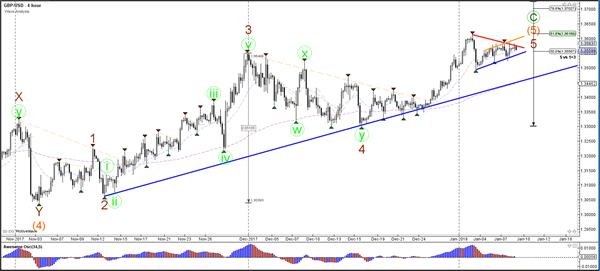
The GBP/USD is building an ABC corrective pattern. The breakout direction depends on the price's reaction versus the trend lines.
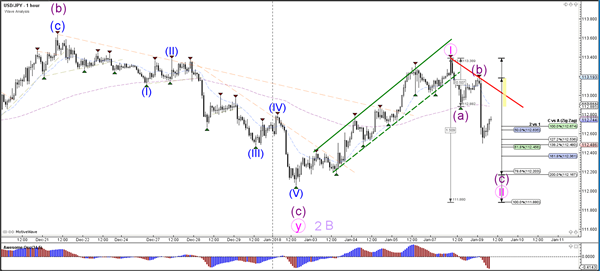
Currency pair USD/JPY
The USD/JPY broke below support (dotted green) and has made a larger bearish correction. This retracement could be a potential wave 1-2 (pink) although price remains in a larger range.
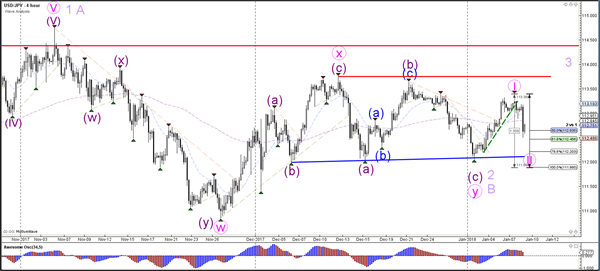
The USD//JPY broke the bullish trend channel (green) and could be building an ABC pattern if price stays above the 100% Fib level of wave 2 vs 1.
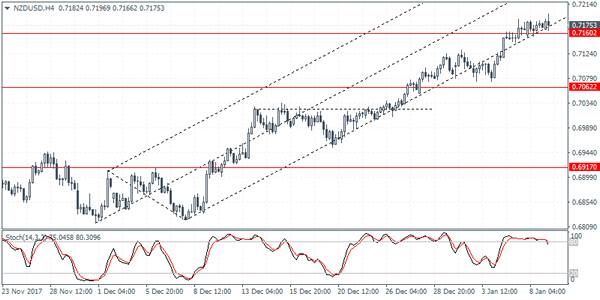
NZDUSD Intraday Analysis
NZDUSD (0.7175): The New Zealand dollar was broadly muted yesterday as price action consolidates above the 0.7160 handle. The Stochastics oscillator shows price action losing its momentum. This could indicate a downside correction in NZDUSD if the support at 0.7160 fails. The next lower support at 0.7062 could be the next target on a downside breakout from the current levels. To the upside, further gains can be expected only on a rebound off the support level at 0.7160, but it looks unlikely at this point.
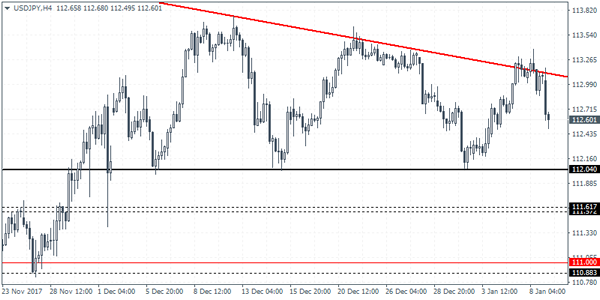
USDJPY Intraday Analysis
USDJPY (112.60): Despite the USD posting a rebound, the USDJPY closed with a doji with follow through price action showing a decline in early trading today. The reversal comes off the test of the major falling trend line as expected. We expect to see the downside correction in USDJPY pushing the currency pair lower. Support at 112.04 remains in focus to the downside. Overall, USDJPY is likely to maintain its sideways range but a break down below 112.04 could spell further declines in price.
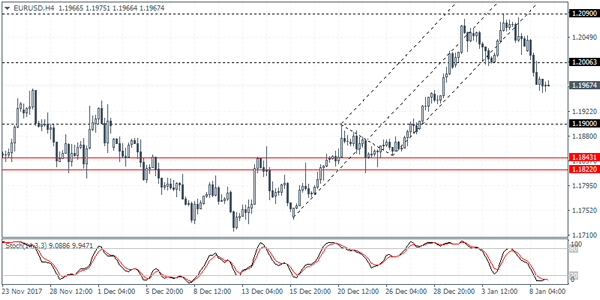
EURUSD Intraday Analysis
EURUSD (1.1967): The EURUSD posted sharp declines yesterday as price action was seen testing the support level at 1.1950 level, touching a 5-day low. The declines came on a stronger U.S. dollar and amid concerns that the strong appreciation in the common currency could spur ECB officials to talk down the currency ahead of this month's monetary policy meeting. Technically, EURUSD could be seen posting a rebound off 1.1950, however further declines cannot be ruled out to 1.1900. A retest of support at 1.1900 could potentially complete the correction. In the near term, any rebound will be limited to the 1.2000 handle which previously served as minor support.
USD Rebounds, But Trades Mixed
The U.S. dollar posted strong gains yesterday following the rebound at a major support level last week. This led to the euro losing steam as the currency pair was seen easing back from recent highs amid profit taking and fresh concerns on the surge in the exchange rate. Economic data was muted for the most part. Switzerland's inflation report showed a flat print on the month while the retail sales in the Eurozone showed a 1.5% increase which was more than expected.
The Bank of Canada released its business outlook survey which alongside recent jobs data has raised the odds of a rate hike from the central bank at next week's meeting.
Looking ahead, the economic data today is light. German industrial output data and the Eurozone unemployment report will be some of the major data points for the markets today.
Technical Outlook: EURUSD – Near-Term Bias To Remain Negative While 1.2000 Barrier Intact
The Euro traded within narrow range in Asia on Tuesday and bounced slightly in early European session, supported by upbeat German data (Nov IP 3.4% vs 1.9% f/c, Nov trade surplus widened to 22.3B from 19.9B in Oct and 20.9B f/c).
Fresh gains were so far limited by broken 10SMA (1.1978) which mrks initial resistance and guarding psychological 1.2000 barrier (former triple-low support). The pair remains at the back foot following two-day fall after repeated upside rejections under 1.2100 pivot.
Near-term bears pressure 1.1950 zone (Fibo 38.2% of 1.1717/1.2088 upleg) where strong bids lay and significant stops parked below.
Break here would open way for extension of pullback from 1.2090 zone towards 1.1900 (flat daily Kijun-sen/50% retracement) and 1.1860 (Fibo 61.8%/trendline support) in extension. Lift above 10SMA needs to regain and break above 1.2000 pivot to signal an end of correction and shift near-term focus higher.
Res: 1.1978, 1.2000, 1.2052, 1.2092
Sup: 1.1950, 1.1900, 1.1875, 1.1860