Sample Category Title
Gold Turns Bullish After Breach Of Key 1300 Level, Consolidates In Near Term
Gold is starting to see immediate pressure to the downside after struggling to hold gains above the key 1320 level. The commodity weakened following the peak just below 1326 and then turned lower to stabilize around 1316.
Looking at the 4-hour chart, the immediate focus is near the 1306 level, which has provided support recently. Major support is seen at the key psychological level at 1300. Falling below this would erase the short-term bullish outlook. The RSI and stochastic are moving lower, suggesting that upside momentum has weakened for now.
Prices need to breach 1320 to open the way for a move towards last week’s high of 1325.97. A rise above this would confirm the bullish bias and shift the focus to the next peak of 1357.47 from September 2017.
The positively aligned 50 and 200-period moving averages support a bullish outlook for gold but in the near term, the bias remains neutral for now and prices are likely to move into a range trading mode, likely between 1313 and 1326.
Technical Outlook: SPOT GOLD – Correction To Precede Fresh Bulls
Spot Gold prices eases on Monday, weighed by stronger dollar after weaker than expected US jobs data on Friday made no impact on expectations for further interest rate hikes this year.
Gold price could ease further on fresh negative sentiment, as corrective action is also signaled by daily indicators emerging from overbought zone.
Violation of last Friday’s spike low at $1313 will initial signal, with violation of pivots at $1305/03 (last Thursday’s low / Fibo 23.6% of $1236/$1326 rally / rising 10SMA) needed to generate stronger bearish signal.
Buying on correction remains favored scenario as steep uptrend from $1236 showed signs of fatigue and needs to correct before larger bulls continue.
Extended dips should find ground at $1292 (Fibo 38.2% of $1236/$1326) to keep bulls intact and reduce risk of deeper correction which would sideline bulls.
Res: 1322, 1326, 1328, 1334
Sup: 1313, 1305, 1300, 1291
Technical Outlook: AUDUSD – Doji Reversal Signal Is Forming On Daily Chart
The Aussie trades in red on Monday after Friday’s trading ended in Doji, signaling that steep ascend from 0.7500 might be running out of steam.
Doji reversal pattern is forming on daily chart and risk of deeper pullback could be expected on violation of pivotal supports at 0.7816/03 (daily cloud top / rising 10SMA).
The notion is supported by daily RSI / slow stochastic attempts to emerge from overbought territory.
Confirmation of reversal could be expected on break below next pivot at 0.7785 (Fibo 38.2% of 0.7641/0.7874 upleg).
Overall bullish structure sees correction as buying opportunity for fresh advance and test of next pivotal barriers at 0.7886/0.7897 (Fibo 61.8% of 0.8124/0.7500 / 13 Oct high) break of which would generate bullish signal for extension of recovery leg from 0.7500 (08 Dec low).
Res: 0.7874, 0.7886, 0.7897, 0.7977
Sup: 0.7816, 0.7800, 0.7785, 0.7776
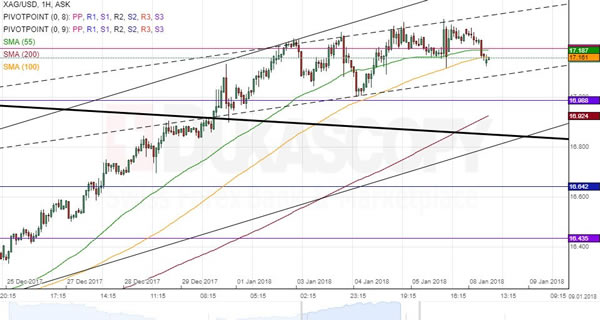
XAG/USD 1H Chart: Silver Consolidates
Silver was guided by a channel down against the Greenback for four months. This prevailing pattern was breached on the last trading day of 2017, thus resulting in the formation of a bullish ascending channel. The pair has since managed to edge slightly higher; however, its has shown reluctance to move past the 17.30 area. This demonstrates that the market is indecisive. Thus, the pair might remain near the 55– and 100-hour SMAs in this session. Weekly technical indicators suggest that Silver is likely to depreciate during the following days. This will bring the rate closer to the lower channel boundary and 200-hour SMA circa 16.90. It is likely that this area is respected, thus resulting in a reversal and further advance.
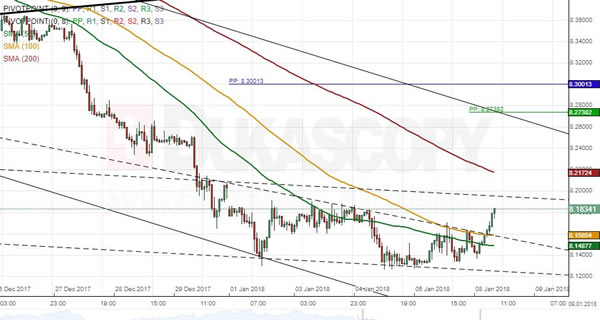
USD/SEK 1H Chart: Pair Guided By Bearish Patterns
USD/SEK was dominated by an ascending channel in force since late August. This long-term pattern was breached mid-December, thus following by a period of decline down to the 4.14 mark. This bearish momentum has allayed during the previous week; nevertheless, the pair still remains tended slightly southwards. The Greenback managed to breach the combined resistance of the 55– and 100-hour SMAs early today. Technical indicators favour further fall within this session and even beyond. Thus, it is likely that the given currency halts near the 200-hour SMA and re-tests the aforementioned shorter-term moving averages. By and large, the senior channel is expected to hold, thus guiding the pair within the following week or two.
EUR/USD Analysis: Slides Towards 1.20
New trading week the common European currency started with depreciation against the American Dollar.
The downward movement was partially driven by a one week-long inverse head and shoulders pattern and partially by a recent bounce off from the two-year high located at the 1.2093 level. However, today the plunge most probably will be stopped near the bottom trend-line of a medium scale ascending channel, which is additionally backed up by the updated weekly S1 at 1.1992. If a rebound occurs, the pair will resume the surge trying to hit combined resistance level formed by the weekly PP at 1.2040 and the 55- and 100-hour SMA.
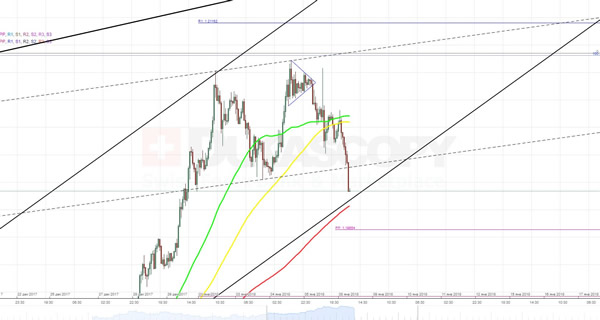
GBP/USD Analysis: Drops Below Weekly PP
As most of the American macroeconomic data released on Friday did not justify expectations, the cable ended the week in a green zone. Nevertheless, in the early hours of this trading session it started with an active plunge, slipping through the updated weekly PP, the 55- and 100-hour SMAs.
An existence of two ascending channels suggests that the drop might be stopped near the 1.3545 level. In the meantime, other technical indicators point out that the two closest notable support levels are located around the 1.3540 and 1.3500 marks. Nevertheless, there is a need to take into account that majority of pending orders both in 50- and 100-pip ranges are set to sell.
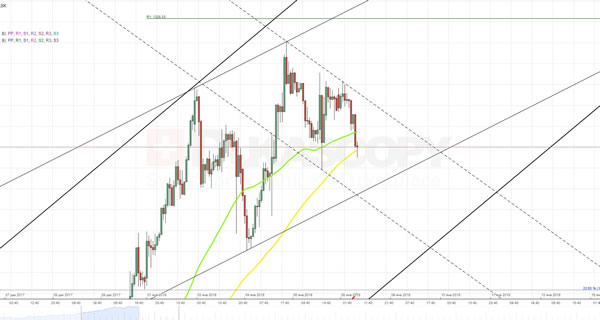
USD/JPY Analysis: Tries To Break From Triangle
Despite release of mostly negative employment data on Friday, the currency exchange rate managed to break through 50% Fibonacci retracement level located at 113.00 and the upper-boundary of one-month long symmetrical triangle. As the pair has crossed already most of the technical indicators, the surge is expected to continue. On the other hand, in order to continue moving towards the weekly R1, the rate needs to break through the upper trend-line of a larger symmetrical triangle. In smaller perspective this pattern might halt the soar of the buck. However, in monthly perspective, it is still expected to continue heading upwards, thus trying to reach the boundary of a one-year long dominant descending channel.
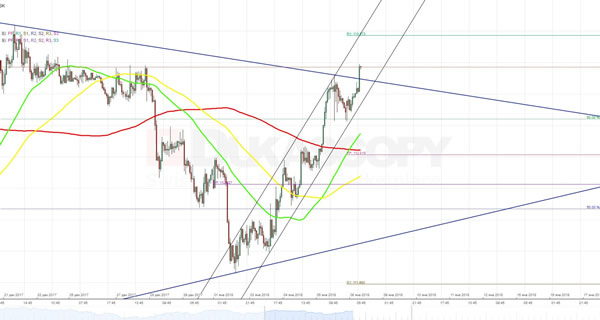
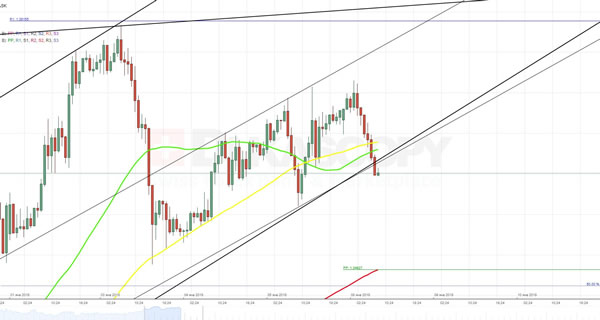
XAU/USD Analysis: Fails To Break Below 55-Hour SMA
In result of the previous trading session the exchange rate slipped to the lower trend-line of a junior ascending channel, as expected. Although the pattern has been broken, the further plunge still seems unlikely, as the southern side is reliably covered by a combination of the updated weekly PP at 1,316.13 and the 55- and 100-hour SMAs. For this reason, the pair is likely to make one more attempt to reach the upper boundary of a dominant five-month long descending channel. Due to absence of any significant data releases the rate might spend most of this week fluctuating between the above trend-line from the north and technical indicators from the south. In larger perspective, bears are projected to take the lead for notable amount of time.
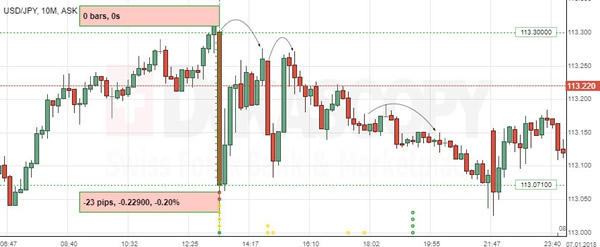
USD/JPY: US Non-Farm Employment Change
The Greenback feel sharply against the Japanese Yen on the disappointing labour market data. The USD/JPY currency pair dropped 23 base points or 0.20% to the 113.07 level.
The US employment growth weakened significantly in December due to a decrease in retail jobs, while a surge in monthly pay gains indicated the labour market strength, which could enable the Federal Reserve to hike interest rates in Spring. The Labour Department stated that the non-farm payrolls increased 148K in the reported month, following an upwardly revised 252K in November. Job growth is anticipated to moderate as the labour market remains close to full employment, though with some chances to get a boost from $1.5T tax cuts package.