Sample Category Title
CRUDE OIL Holding Above 60
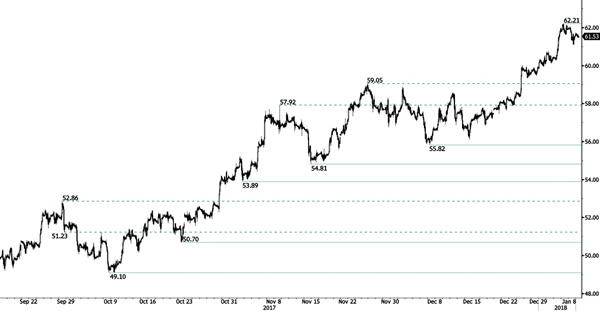
Crude oil is has broken resistance given at 59.05 (24/12/2017 high). Strong support is given at 55.82 (07/12/2017 low). Expected to keep increasing.
In the long-term, crude oil has recovered after its sharp decline last year. However, we consider that further weakness are very likely. For the time being the pair lies in an upside momentum. Strong support lies at 35.24 (05/04/2016) while resistance can now be found at 55.24 (03/01/2017 high).
SILVER Continued Increase
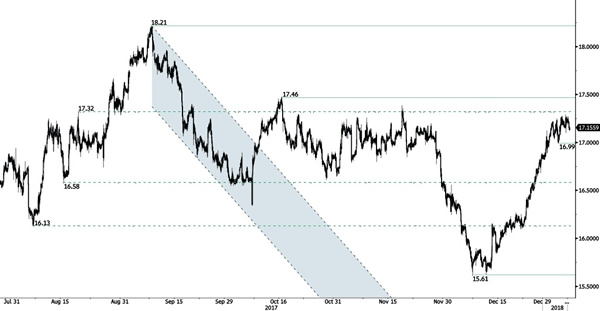
Silver has been bouncing on hourly support at 16.99 (04/01/2018 low). Hourly resistance is given at 17.46 (16/10/2017 high). Expected to show continued bullish pressures.
In the long-term, the trend is rater negative. Further downsides are very likely. Resistance is located at 25.11 (28/08/2013 high). Strong support can be found at 11.75 (20/04/2009).
GOLD Bullish Momentum Continues
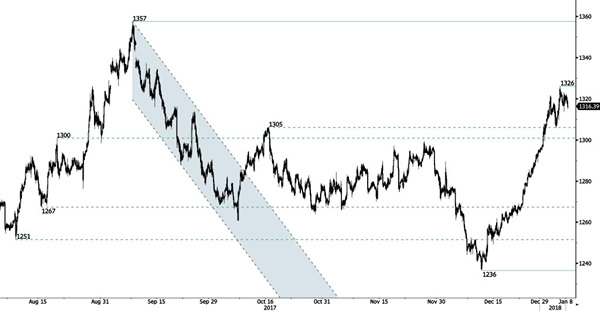
Gold is pushing higher after the strong collapse even though traders are taking some profit. Hourly support is given at 1236 (12/12/2017 low). Resistance is located at 1326 (04/01/2018).
In the long-term, the technical structure suggests that there is a growing upside momentum. A break of 1392 (17/03/2014) is necessary ton confirm it, A major support can be found at 1045 (05/02/2010 low).
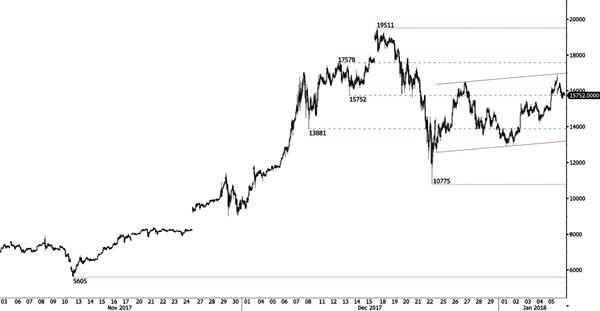
BITCOIN Volatile Within Uptrend Channel
Bitcoin's bullish momentum is far fom over despite strong consolidation phase. The technical structure has shown a tremendous positive short-term momentum so far. Hourly support area located around 10775 (22/12/2017 low). In the short-term, the technical structure suggests further bearish momentum. Expected to show further decline.
In the long-term, the digital currency has had an exponential growth. There are decent likelihood that the asset will reach $40'000 in 2018.
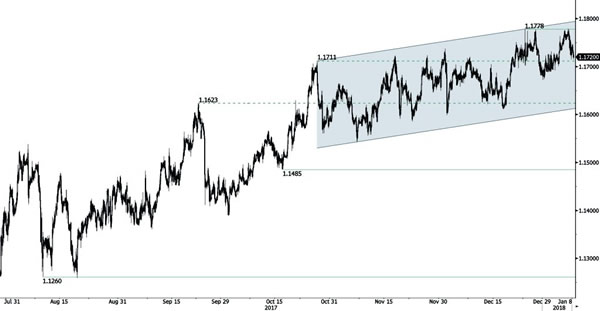
EUR/CHF Slow Increase
EUR/CHF is trading slightly higher. Hourly resistance is given at 1.1778 (25/12/2017 high). Expected to show continued short-term increase.
In the longer term, the technical structure has reversed. Strong resistance is given at 1.20 (level before the unpeg). Yet, the ECB's QE programme is likely to cause persistent selling pressures on the euro, which should weigh on EUR/CHF. Supports can be found at 1.0184 (28/01/2015 low) and 1.0082 (27/01/2015 low).
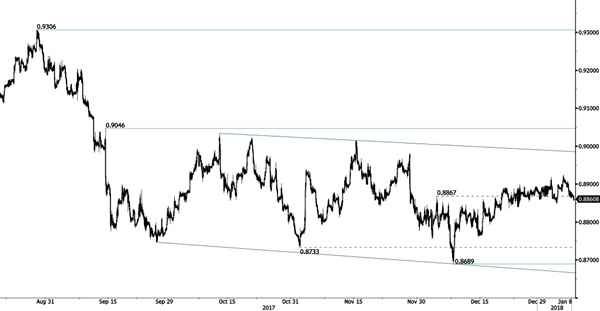
EUR/GBP Sideways Price Action
EUR/GBP is trading mixed. The pair is trading between support at 0.8689 (08/12/2017 low) and resistance is located at 0.9046 (14/09/2017 high). Expected to show further sideways trading.
In the long-term, the pair has largely recovered from recent lows in 2015. The technical structure suggests a growing upside momentum. The pair is trading above from its 200 DMA. Strong resistance can be found at 0.9500 (psychological level).
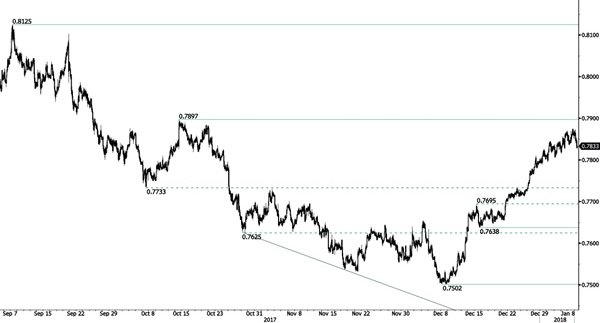
AUD/USD Riding Higher
AUD/USD's upside pressures are growing. Hourly resistance given at a distance at 0.7897 (13/10/2017 high). Support stands at 0.7638 (15/12/2017 low). The road is wide open for further upside.
In the long-term, the trend is turning positive. Key supports stands at 0.6009 (31/10/2008 low) . A break of the key resistance at 0.8164 (14/05/2015 high) is needed to invalidate our long-term bearish view.
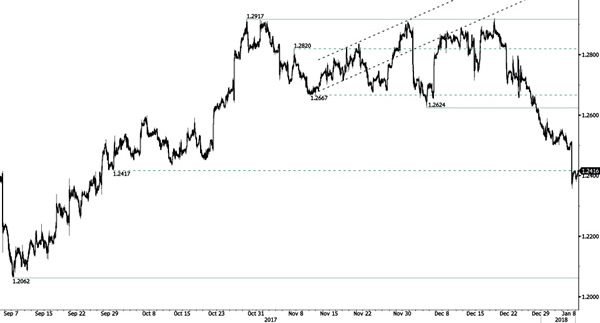
USD/CAD Continued Decline
USD/CAD is skewed to the downside after the pair failed to break hourly resistance at 1.2917 (27/10/2017 high). The pair keeps on heading lower.
In the longer term, the pair has broken longterm support that can be found at 1.2461 (16/03/2015 low). Strong resistance is given at 1.4690 (22/01/2016 high). The pair is likely to head further lower.
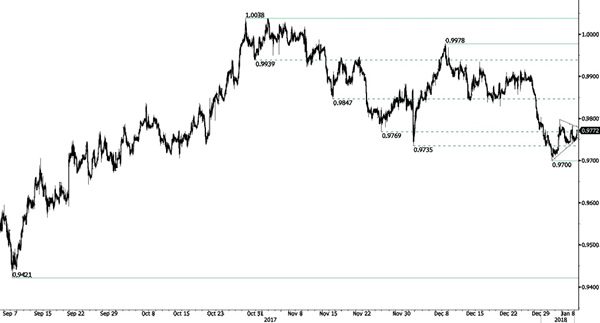
USD/CHF Short-Squeeze
USD/CHF is trading slightly higher. Yet, the technical structure indicates that further weakness are possible. Expected to show further short-term downside moves.
In the long-term, the pair is still trading in range since 2011 despite some turmoil when the SNB unpegged the CHF. Key support can be found 0.8986 (30/01/2015 low). The technical structure favours nonetheless a long term bullish bias since the unpeg in January 2015.
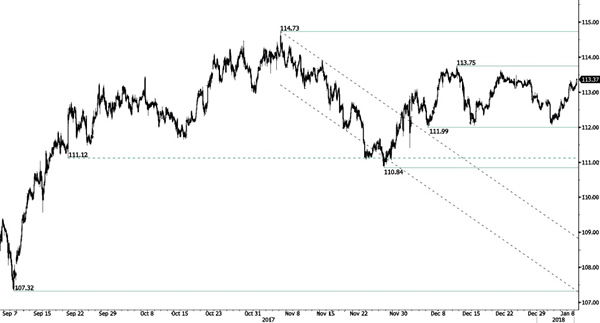
USD/JPY Pushing Higher
USD/JPY's buying demand is increasing and the pair is approaching hourly resistance given at 113.75 (12/12/2017 high) while hourly support is given at 111.99 (15/12/2017 low). The technical structure suggests continued increase.
We favor a long-term bearish bias. Support is now given at 99.02 (10/08/2013 low). A gradual rise towards the major resistance at 125.86 (05/06/2015 high) seems unlikely. Expected to decline further support at 93.79 (13/06/2013 low).