Sample Category Title
EUR/USD Buying Demand Increases
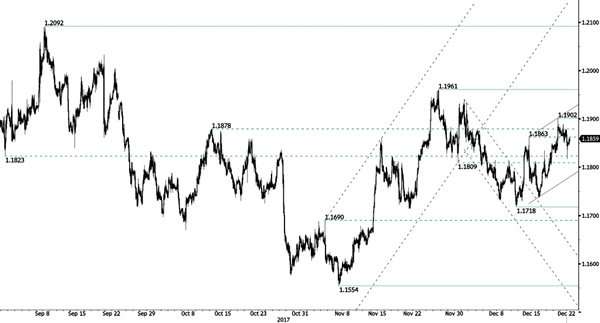
EUR/USD's short-term bearish momentum has abruptly ended and the pair is now moving higher. Hourly resistance is now given at 1.1902 (20/12/2017 high). Hourly support is given at 1.1718 (12/12/2017 low). Expected to show continued increase.
In the longer term, the momentum is now turning largely positive. We favour a continued bullish bias. Key resistance is holding at 1.2252 (25/12/2014 high) while strong support lies at 1.0341 (03/01/2017 low).
Technical Outlook: GBPUSD Rallies After GDP Data But Key Barriers Still Intact
Cable rallied after solid UK GDP data and retested pivotal barrier at 1.3395 (Fibo 38.2% of 1.3549/1.3301/20SMA).
Final GDP was confirmed at 0.4% (q/q), unchanged from Q2 and along with expectations.
Annualized GDP came at 1.7% against 1.5% consensus and Q2 revised to 1.9% from 1.5%.
Fresh strength comes after strong downside rejection on Thursday when dip was contained by key supports – rising 30SMA and daily cloud top.
Thursday's long-tailed daily candle underpins the action, however, close above 1.3395 barrier is needed to signal further advance towards 1.3464 (14 Dec spike high). However, risk of extended sideways trading is signaled by long tail/upper shadow of candles in past two days.
Also, slower pace could be expected on thin holiday trading.
Res: 1.3395, 1.3420, 1.3447, 1.3464
Sup: 1.3357, 1.3331, 1.3300, 1.3270
Profit-Taking On Bitcoin
Profit-taking on Bitcoin
It's retracement time for Bitcoin: investors are taking profits, pushing the price back to around $13,000. For cryptocurrencies this is normal, i.e. boom and bust. We do not see this as a bubble bursting – it is a healthy correction.
Meanwhile, crypto competition is heating up, especially between coins that aim to be a store of value or a means of payment. Lately, Litecoin is gaining momentum and so is Raiblocks. There will be more than one winner, and we believe cryptos will be very profitable in 2018.
Euro ignores Catalonian confusion
Who won yesterday's election – the Catalexit crowd or the Remain-in-Spain supporters? It's not clear! Both sides are claiming victory, and the parliament is split. Separatist parties took 70 of the 135 seats, but the pro-Spain Citizens Party won the most seats, 36. So the wrangling looks likely to continue.
Amidst all this, the Euro yawned. EUR/USD is stable, as traders are pricing in the least disruptive outcome.
Please note this will be the last report until January 8th 2018. Have a happy holiday season.
EUR/USD Analysis: Begins To Decline
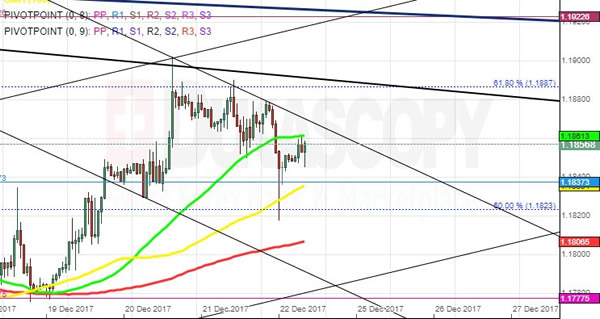
On Friday morning the common European currency had continued the decline against the US Dollar, which started during the late hours of Thursday’s trading session.
It began due to the fact that the pair bounced off resistance near the 61.80% Fibonacci retracement level, which is located near the 1.1890 mark. The high levels of the recent attempts to surge are used to chart a speculated channel down pattern.
The pattern reveals that the pair might fall down to the 1.18 mark by New Year’s eve.
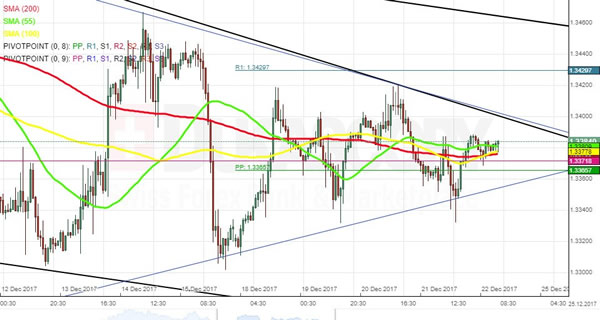
GBP/USD Analysis: Pressured By SMAs
The Pound weakened slightly against the US Dollar on Thursday. This fall, however, was brief, as the pair had managed to return to the 1.3340 mark by this morning. Along the way, the combined resistance of the 55-, 100– and 200-hour SMAs was surpassed with little hindrance. The Pound is approaching a short-term trend-line located circa 1.34. It is likely that this line together with the aforementioned support pressure the rate from both sides in this session. Nevertheless, fundamentals scheduled for this session could introduce some changes to this assumption. Apart from the trend-line, the nearest resistance is set by the weekly R1 at 1.3421, while the southern barrier is likewise reinforced by the weekly and monthly PPs.
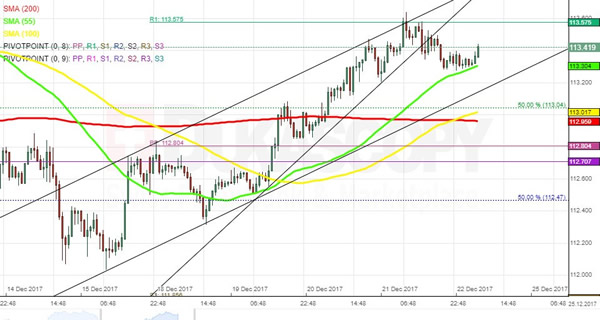
USD/JPY Analysis: Finds Support At 55-Hour SMA
The bullish sentiment that prevailed this week was stopped abruptly by the 113.60 mark. As a result, the pair breached a short-term ascending wedge and tried to edge lower until the 55-hour SMA located circa 113.30 was reached. The bottom boundary of a one-week channel has not yet been reached. Thus, the pair might try to push for this line today. However, the 55-hour SMA might provide significant support. It is likely that this moving average guides the pair for most of this session, thus stranding the US Dollar between this line and the weekly R1. The latter is likewise located near December high of 113.68. On the other hand, the ultimate daily low is likely to be the 113.00 area where the 100– and 200-hour SMAs and the 50.0% Fibo are located.
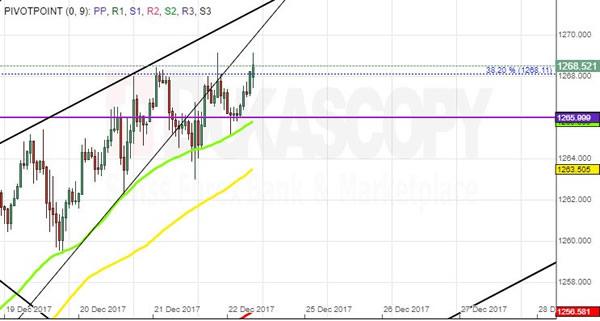
XAU/USD Analysis: Breaks Aupport As Expected
The previous forecast for the price of the yellow metal was correct. The bullion has passed the support line, which had kept the price surging for a long time. However, that does not mean that a decline of the price is about to occur.
Instead the metal’s price passed the support in a horizontal move, as it was squeezed in between various levels of significance. Moreover, these levels of support at the 1,266 and 1,268 price tags are still providing support.
Due to these reasons combined it is expected that the support levels and the to the north moving simple moving averages will provide support, as a new junior ascending pattern is formed.
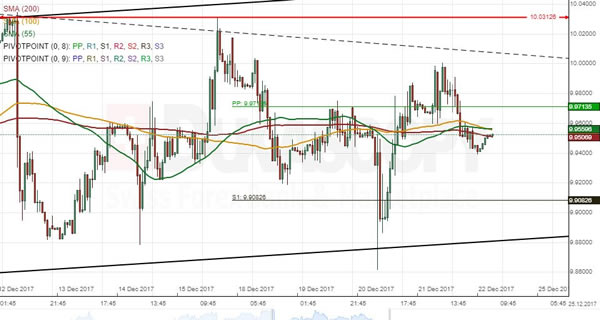
EUR/SEK 1H Chart: Rate Weakens From Yearly Peak
The common European currency has been appreciating steadily against the Swedish Krona since early September. This movement north has allayed during the past three weeks, as the rate has been lingering slightly below the 2010-2017 high of 10.03. This peak was reached on December 12, and the Euro has since edged lower. The same bearish sentiment is likely to prevail during the following weeks, as well. Even though technical indicators point to a possible increase in price in this session, gains are unlikely to exceed the aforementioned high. In addition, the pair faces the combined resistance of the 200-, 55– and 100-hour SMAs and the weekly PP that could hinder or even halt any intentions to push higher.
NZD/CHF 1H Chart: Pair Faces Strong Support
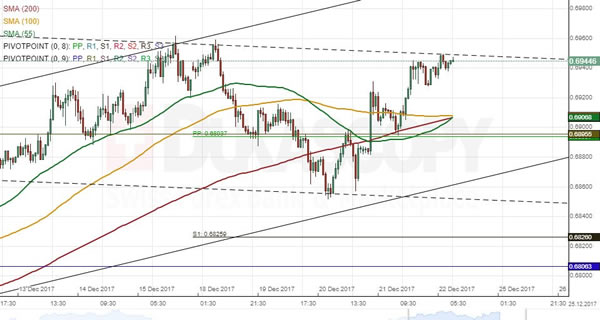
NZD/CHF has been trading in a long-term channel down since mid-June. The pair’s latest test of its bottom boundary occurred five weeks ago. The Kiwi has since been constrained in a channel up, while the most junior channel was formed within this pattern. It is expected that the New Zealand Dollar continues its current movement towards the senior channel located circa 0.7040 during the following two or three weeks. In the short term, the pair is also likely to appreciate, given that it faces a strong support formed by the 55-, 100– and 200-hour SMAs, the monthly R1 and the weekly PP near the 0.69 mark. As a result, the short-term channel should be breached to the upside. The nearest resistance is set by the weekly R1 at 0.70.
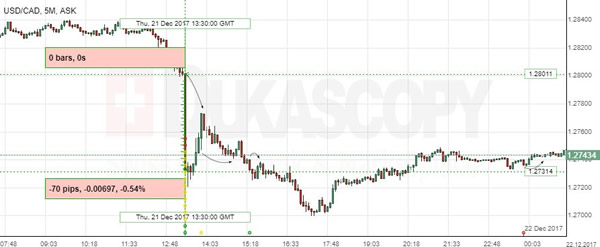
USD/CAD: Canadian Consumer Price Index
The Loonie jumped sharply against the US Dollar, as the report showed unexpectedly strong inflation data on Thursday. The USD/CAD currency pair dropped 70 base points or 0.54% to hit the weekly low and failed to get back to pre-data levels.
Canadian yearly inflation rate increase in November to its strongest since the beginning of the year, supported by a rise in food and gasoline prices. Statistics Canada stated that the country’s CPI marked a 2.1% yearly increase in November, compared with a 1.4% gain in the prior month, hitting the Bank of Canada’s 2% goal since February. Moreover, seven of the eight main price categories were up, led by a 5.9% annual rise in transportation and passenger vehicle costs.