Sample Category Title
EUR/USD: US Final Gross Domestic Product
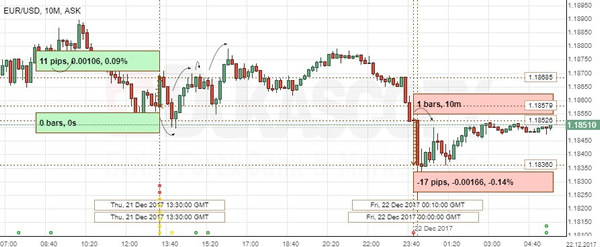
The Greenback depreciated against the European single currency on the disappointing US GDP data. The EUR/USD exchange rate rose 11 base points to the 1.1866 mark to reveal temporary consolidation, but fell, as Congress managed to avoid the US Government shutdown on Friday.
The US economy expanded at its strongest pace in two years in the Q3, fuelled by solid business spending.The Commerce Department stated that the country’s gross domestic product rose at a 3.2% yearly rate in the Q3, missing expectations for a 3.3% growth. Moreover, the US Congress approved tax cuts are set to encourage economic growth, though the risk of overheating is likely to occur with fiscal stimulus coming simultaneously with reaching the level of full employment.
GBPJPY Neutral In Short And Medium Term, Risk To Upside
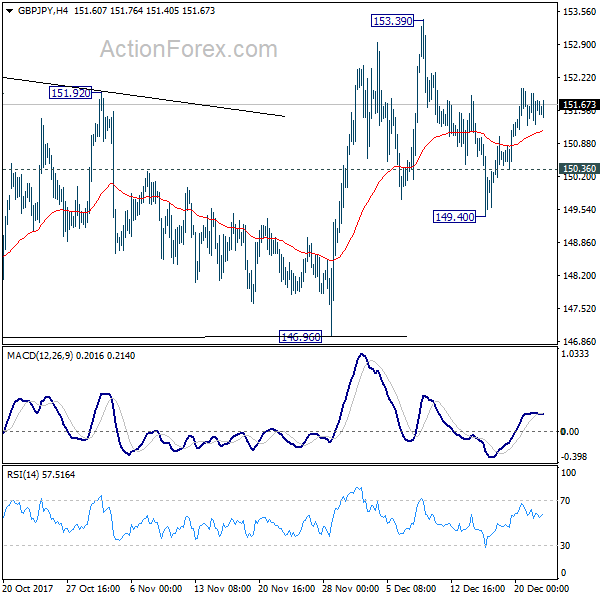
GBPJPY maintains a neutral bias in the short and medium term, supported at the key 150 level. The cross maintains a bullish market structure in the short term, while trading above the 50 and 200- period moving averages on the 4-hour chart.
GBPJPY made a strong recovery after a brief dip below 150 in mid-December to rise back to test the 152 level, which provided strong resistance. Prices are now trading sideways after upside momentum weakened, as can be seen by the RSI being neutral.
Downside is limited and near-term risk is tilted to the upside, with scope to re-test the 152 level. A decline to 150 support would be an opportunity to buy but a break below this level would shift the market out of the recent consolidation. Another leg lower towards 148 would change the bias to bearish.
For now, GBPJPY remains bid with additional gains possible at the upper end of the recent consolidation range. A sustained move above 152 would target 153 but only a break above this level would confirm a bullish move and shift the overall outlook to a more positive one.
GBP/JPY Daily Outlook
Daily Pivots: (S1) 151.30; (P) 151.61; (R1) 151.95; More...
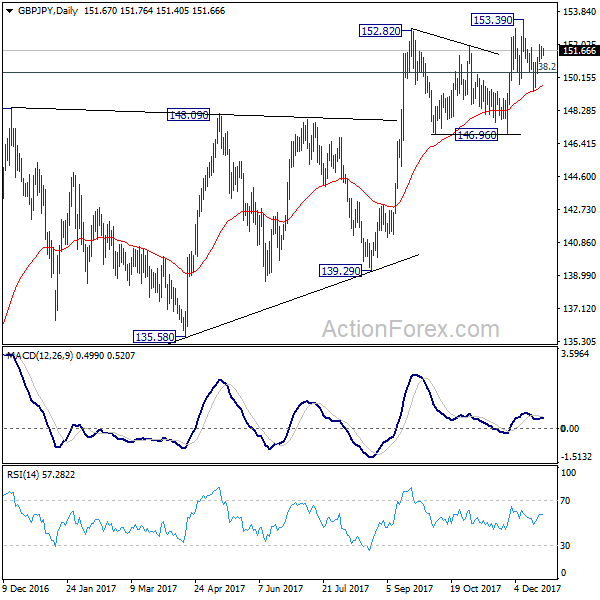
With 150.36 minor support intact, intraday bias in GBP/JPY remains mildly on the upside for 153.39. Break will resume medium term rally. On the downside, below 150.36 minor support will turn bias back to the downside and extend the correction from 153.39. But we'd look for strong support from 146.96 to bring rebound.
In the bigger picture, outlook is mixed up a bit with last week's sharp decline. But still, as long as 146.96 key support holds, medium term outlook remains bullish. Rise from 122.36 is in favor to extend to 61.8% retracement of 195.86 to 122.36 at 167.78. However, break of 146.96 support will indicate trend reversal. And the corrective structure of rebound from 122.36 will argue that larger down trend is resuming for a new low below 122.26.
EUR/JPY Daily Outlook
Daily Pivots: (S1) 134.36; (P) 134.62; (R1) 134.79; More....
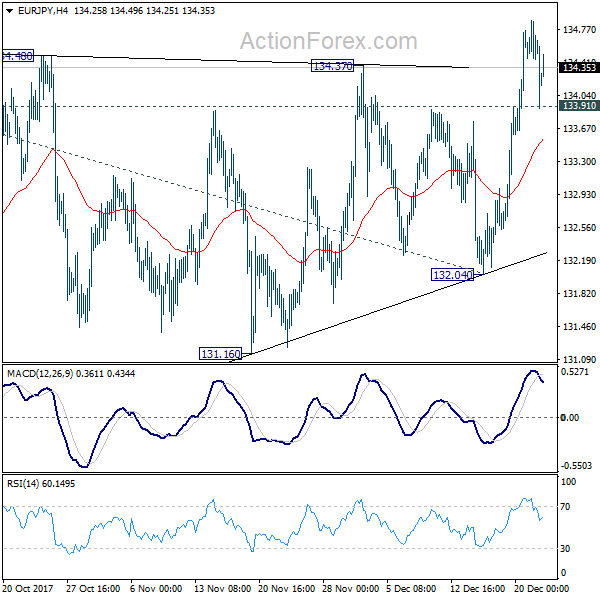
With 133.91 minor support intact, intraday bias in EUR/JPY remains mildly on the upside for further rally. Current rise from 132.04 should target 61.8% projection of 114.84 to 134.39 from 132.04 at 144.12. Ideally, upside acceleration should be seen in the current move with daily MACD taking out down trend line. On the downside, below 133.91 minor support will turn intraday bias neutral first. But outlook will stay bullish as long as 132.04 key support holds.
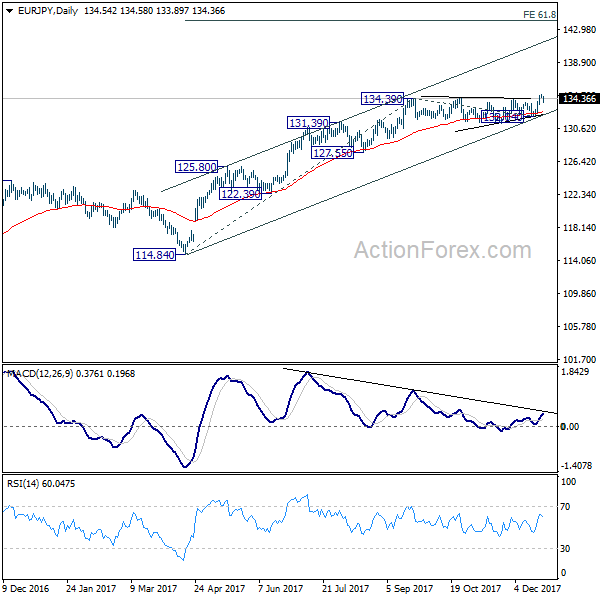
In the bigger picture, medium term rise from 109.03 (2016 low) is seen as at the same degree as the down trend from 149.76 (2014 high) to 109.03 (2016 low). Sustained break of 61.8% retracement of 149.76 to 109.03 at 134.20 will pave the way to key long term resistance zone at 141.04/149.76. However, break of 132.04 support will suggest medium term topping and will turn outlook bearish for deeper fall back 55 week EMA (now at 127.82).
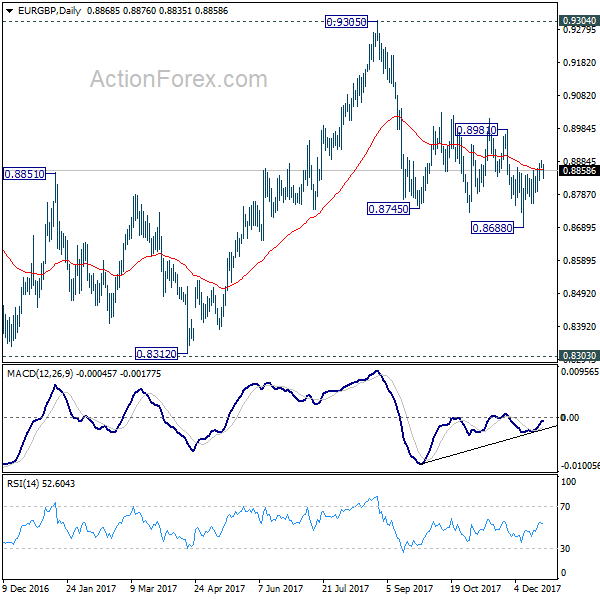
EUR/GBP Daily Outlook
Daily Pivots: (S1) 0.8861; (P) 0.8875; (R1) 0.8883; More...
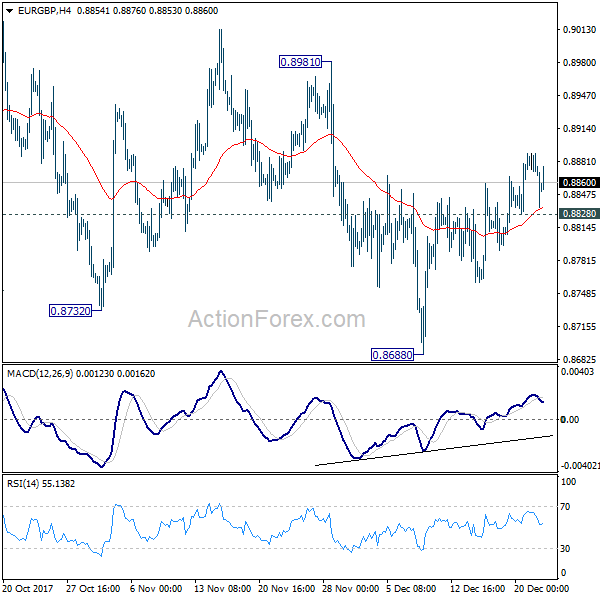
With 0.8828 minor support intact, further rise is expected in EUR/GBP for 0.8981 resistance. Sustained break there will indicate that whole decline from 0.9305 has completed. In such case, EUR/GBP will target a test on 0.9304/5 key resistance. On the downside, below 0.8828 minor support will turn bias back to the downside for 0.8668 instead.
In the bigger picture, there are various ways to interpret price actions from 0.9304 high. But after all, firm break of 0.9304/5 is needed to confirm up trend resumption. Otherwise, range trading will continue with risk of deeper fall. And in that case, EUR/GBP could have a retest on 0.8303. But we'd expect strong support from 0.8116 cluster support (50% retracement of 0.6935 to 0.9304 at 0.8120) to contain downside.
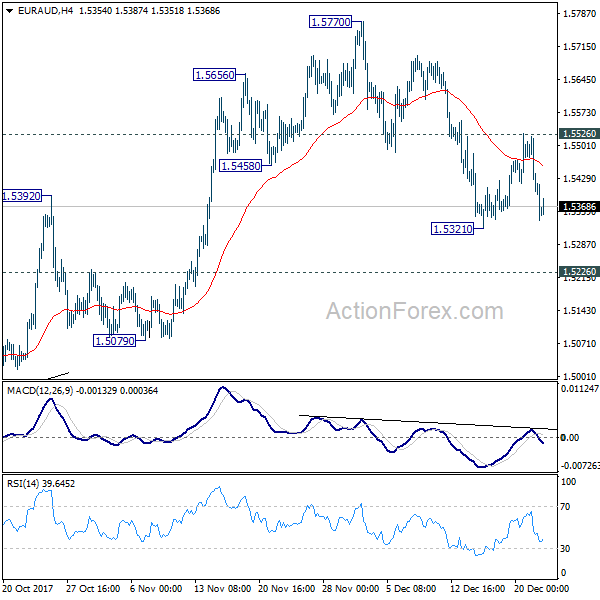
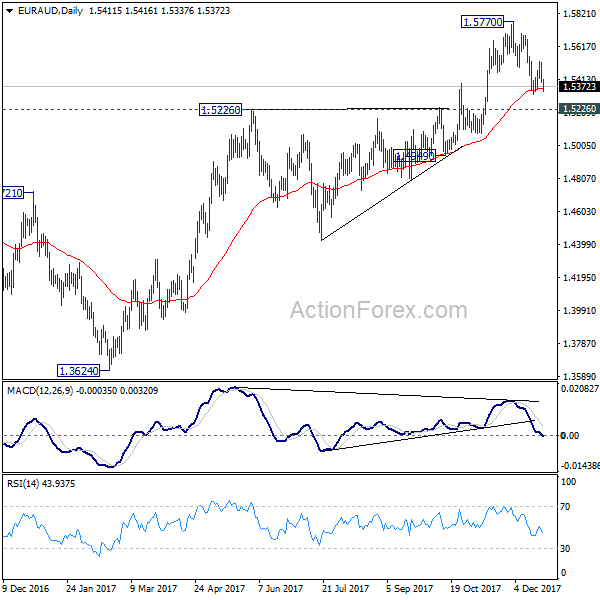
EUR/AUD Daily Outlook
Daily Pivots: (S1) 1.5366; (P) 1.5443; (R1) 1.5491; More....
Today's sharp fall suggests EUR/AUD's correction from 1.5770 is still in progress. Deeper fall could be seen through 1.5321. But outlook will resume bullish as long as 1.5226 resistance turned support holds. Above 1.5526 minor resistance will turn bias back to the upside for retesting 1.5770 resistance.
In the bigger picture, we're holding on to the view that corrective decline from 1.6587 medium term top (2015 high) has completed at 1.3624. Rise from 1.3624 is expected to extend to retest 1.6587. We'll hold on to this bullish view as long as 1.5226 resistance turned support holds. Firm break of 1.6587 will resume long term rise from 1.1602 (2012 low). However, sustained break of 1.5226 will indicate trend reversal and target 1.3624 again.
Daily Wave Analysis: GBP/USD Builds Wave 1-2 In Bull Flag Pattern
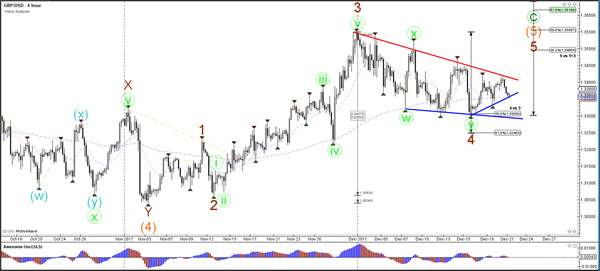
Currency pair GBP/USD
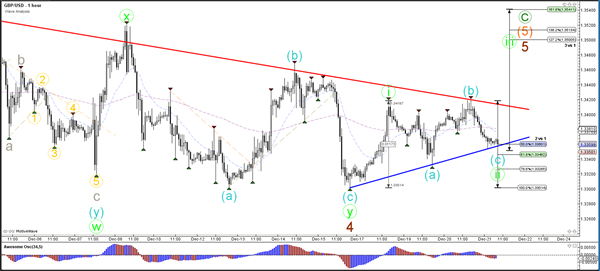
The GBP/USD is building a large bull flag chart pattern. A bullish breakout above the resistance trend line (red) could confirm the pattern and a wave 5 of wave C. A break below the 61.8% Fib of wave 4 vs 3 makes a wave 4 less likely.
The GBP/USD seems to be building a potential ABC (blue) within a wave 1-2 (green).
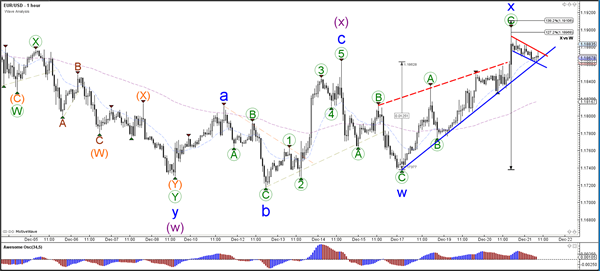
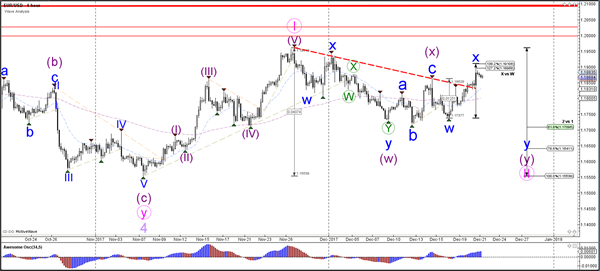
Currency pair EUR/USD
The EUR/USD bounced and reversed at the Fibonacci levels of wave X v W but a break above the 138.2% Fibonacci level still invalidates wave X. The bullish breakout could indicate a continuation of the uptrend whereas a bearish reversal could send the EUR/USD lower to test the Fib levels of wave 2 vs 1 (pink).
The EUR/USD broke below the support trend lines (dotted blue) and could be building a larger bearish correction if it stays below the Fibonacci levels of wave X (green).
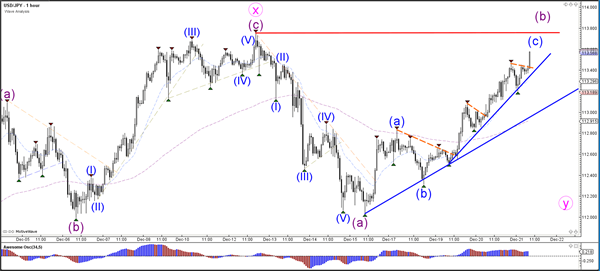
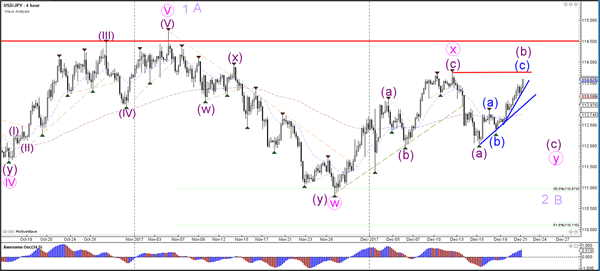
Currency pair USD/JPY
The USD/JPY is facing important and critical support (blue) and resistance (red) trend lines.
The USD/JPY needs to break below support before a bearish reversal becomes more likely whereas a break above resistance could indicate and uptrend continuation.
EUR/CHF Daily Outlook
Daily Pivots: (S1) 1.1673; (P) 1.1696; (R1) 1.1738; More...
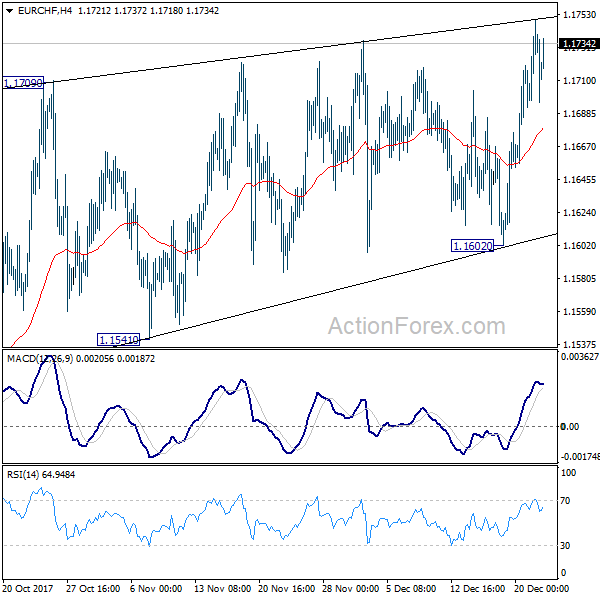
Break of 1.1736 suggests up trend resumption in EUR/CHF. Intraday bias is back on the upside. But based on weak upside momentum, we'd expect strong resistance well below 1.2 handle to bring medium term topping. On the downside, break of 1.1602 support will indicate reversal and turn outlook bearish.
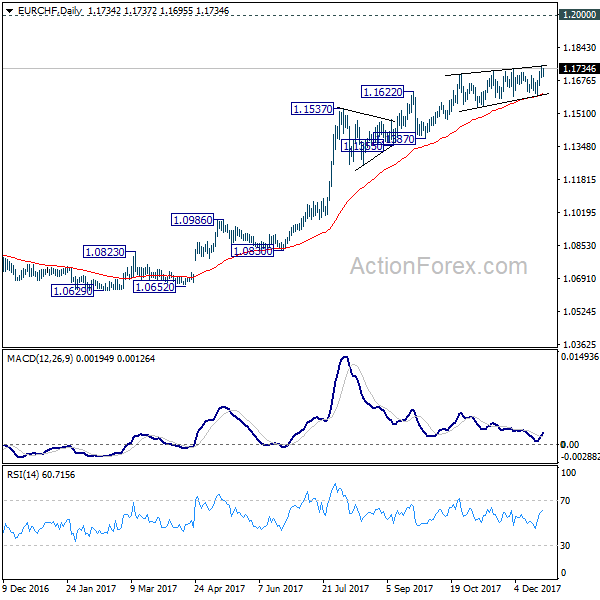
In the bigger picture, while a medium term top could be around the corner, there is no change in the larger outlook. That is, long term rise from SNB spike low back in 2015 is still in progress and would extend. As long as 1.1198 resistance turned support holds, we'll hold on to this bullish view and expect another to prior SNB imposed floor at 1.2000. Though, we'll reassess the outlook if 1.1198 is firmly taken out.
Forex: US Economic Growth Remains Strong
The US Commerce Department released GDP data on Thursday that showed economic activity grew lower than expected in Q3. Real GDP rose to 3.2% in the last quarter slightly lower than the previous reading of 3.3%. The Commerce Department commented that the downward revision to the pace of GDP growth primarily reflected slightly slower than previously estimated growth in consumer spending. Consumer spending climbed by 2.2% in Q3 compared to the previously reported 2.3% increase. The GDP release marks the first time since 2014 that the US economy enjoyed growth of 3% or more for 2 straight quarters.

The US Labour Department released Initial Jobless Claims that showed a rise by 20,000 to a seasonally adjusted 245,000 in the week ended Dec. 16 which was higher than the markets forecast of 234,000. Whilst the data shows a rise in the number of Americans filing for unemployment benefits the underlying trend in jobless claims remained consistent with a tightening labor market. The US labor market is close to full employment, with the unemployment rate at a 17-year low of 4.1%. Last week, the four-week moving average of initial claims, considered a better measure of labor market trends as it irons out week-to-week volatility, rose only 1,250 to 236,000.

The Spanish Government suffered a setback as 3 pro-independence parties won the majority of seats in the Catalan parliamentary elections on Thursday. A record turnout of 80% has dealt another blow to Spain’s Government who are desperately trying to keep the country together. The pro-independence parties are set to win 70 seats in the regional parliament, giving them a majority in the 135-seat chamber. The unionists and other parties are likely to win 65 seats. With Europe making it clear that they would not recognize an independent Catalonia the election will cause more questions to be asked as to the stability of the Eurozone. EUR experience selling pressure on the back of the election result.
EURUSD is 0.2% lower in early Friday trading around 1.1850
USDJPY is unchanged overnight trading around 113.35
GBPUSD is little changed in early Friday trading around 1.3378
Gold is marginally higher trading around $1,267.25
WTI is 0.1% higher in early session trading around $58.19
Major data releases for today:
At 09:30 GMT: the UK Office for National Statistics (ONS) will release Gross Domestic Product (GDP) (MoM & YoY) for Q3. Both month-on-month and annualized releases are forecast to come in unchanged at 0.4% and 1.5% respectively. Any significant deviation from the forecast will see GBP volatility.

At 13:30 GMT: the US Bureau of Economic Analysis will release a plethora of economic data. Core Personal Consumption Expenditure – Price Index (MoM) for November is forecast to come in at 0.1% a slight reduction from the previous release of 0.2%. The annualized core rate is forecast at 1.5% a slight increase on the previous release of 1.4%. Personal Income (MoM) for November is forecast unchanged at 0.4% but Personal Spending is forecast to come in at 0.5% compared to the previous 0.3%.
At 13:30 GMT: the US Census Bureau will release Durable Goods Orders & Durable Goods Orders Ex-Transportation for November. Durable Goods are forecast to come in significantly higher than the previous release of -0.8% at 2.0%. Durable Goods Ex-Trans are forecast at lower at 0.5% from the previous release of 0.9%. We can expect USD volatility if the actual release is significantly different from forecast.
At 13:30 GMT: Statistics Canada will release Canadian GDP (MoM) for October. Forecasts are calling for an unchanged release of 0.2%. Any significant deviation form forecast will likely cause CAD volatility

EUR/JPY Elliott Wave Analysis
EUR/JPY - 134.34
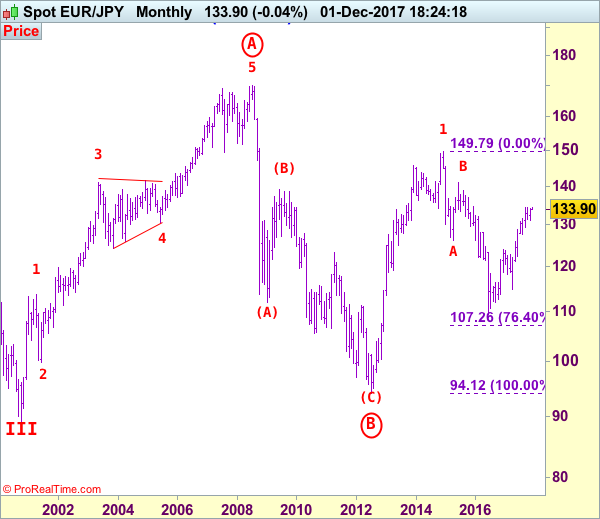
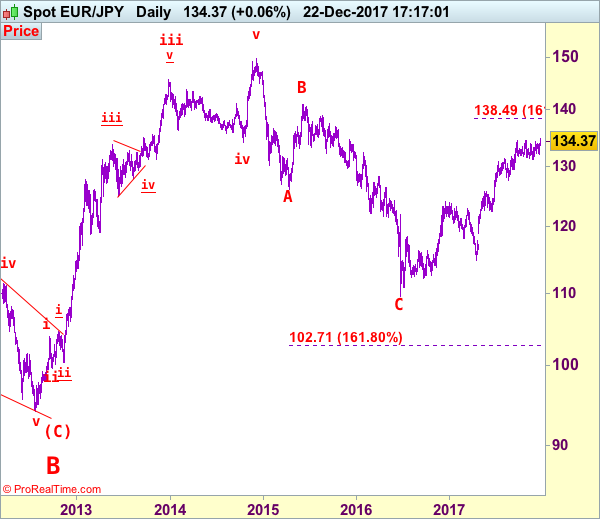
The single currency found renewed buying interest at 132.05 last week and has rallied above indicated previous resistance at 134.50, confirming medium term upmove has resumed and may extend further gain to 135.00-10, then 135.50-60, however, near term overbought condition should prevent sharp move beyond 136.00-10 and price should falter below 136.90-00, the pair should falter well below 138.45-50 (1.618 times extension of 109.49-124.10 measuring from 114.85), risk from there is seen for a major correction to take place in 2018.
The daily chart is labeled as attached, early selloff from 169.97 (July 2008) to 112.08 is wave (A) of B instead of end of entire wave B and then the rebound from there to 139.26 is wave (B), hence, wave (C) has possibly ended at 94.12 with a diagonal triangle as labeled in the daily chart, hence upside bias is seen for further gain. Recent rally above indicated retracement level at 116.69 (50% Fibonacci retracement of the intermediate fall from 139.26-94.12) adds credence to this view and signal major reversal has commenced but first leg of this wave C has possibly ended at 149.79, hence wave 2 has commenced with wave A ended at 126.09, followed by wave B at 141.06, wave C commenced and could have ended at 109.49, indicated upside targets at 126.00 and 130.00 had been met and further gain to 135.00 would follow.
On the downside, whilst pullback to 133.85-90 cannot be rued out, reckon 133.50 would limit downside and bring another rise later to aforesaid upside targets. Only a drop below previous minor resistance at 133.01 would defer and suggest top is possibly formed, bring weakness to 132.50 but said support at 132.05 should remain intact. Looking ahead, if euro drops below said support at 132.05, this would signal a temporary top is formed instead, bring retracement of recent rise to 131.50, then test of previous support at 131.17 which is likely to hold from here.
Recommendation: FINAL UPDATE, HOPE TO SEE U ALL SOON.
To re-cap the corrective upmove from the record low of 88.93 (18 Oct 2000), the wave A from there is subdivided as: 1:88.93-113.72, 2:99.88 (1 Jun 2001), 3:140.91 (30 May 2003), 4:124.17 (10 Nov 2003) and 5 ended at record high of 169.97 (21 Jul 2008). The brief but sharp selloff to 112.08 is viewed as a-b-c x a-b-c wave (A) of B. The subsequent rebound to 139.26 is (B) of B and (C) of (B) has possibly ended at 94.12 and in any case price should stay well above previous chart support at 88.93, bring rally in larger degree wave C towards 150.00.