Sample Category Title
NZDUSD Intraday Analysis
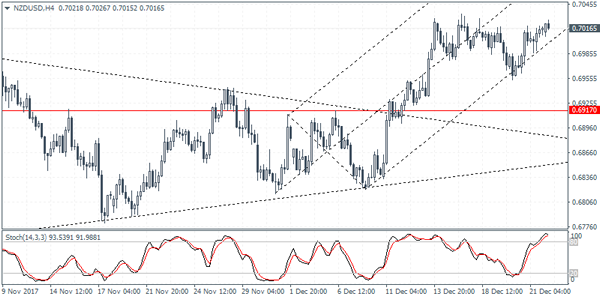
NZDUSD (0.7016): The New Zealand dollar continues to consolidate around the 0.7000 level. Following the decline to 0.6950, the NZDUSD is attempting to retest the previous highs. A breakout above this level could suggest further gains with 0.7100 coming into focus. However, failure to breakout above the previous highs could suggest a near term correction. Support at 0.6917 could be tested in the short term ahead of further gains.
USDJPY Intraday Analysis
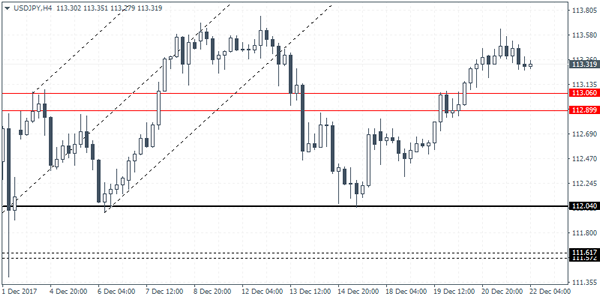
USDJPY (113.31): The USDJPY stalled its two day winning streak with price action forming a doji pattern near the previous highs. This potentially suggests a decline in the near term on a bearish close. Support is formed at 113.00 - 112.90 level which could be tested in the near term. A breakdown below this level will indicate further declines with support at 112.00 coming into focus. USDJPY could however be seen posting further gains on a rebound off the 113.00 support.
EURUSD Intraday Analysis
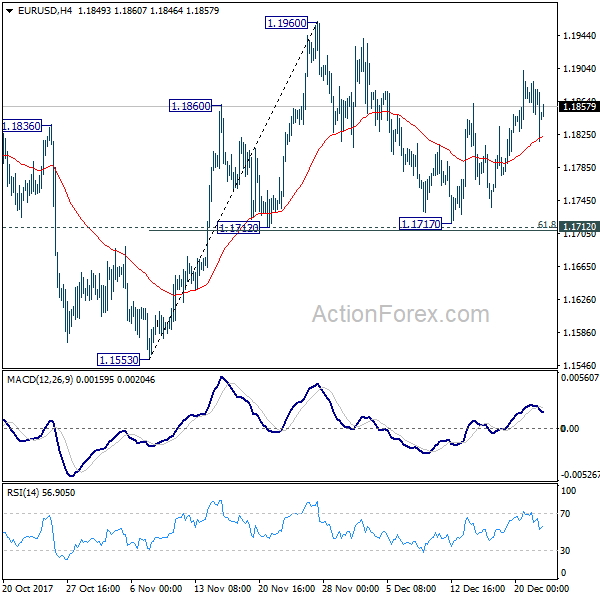
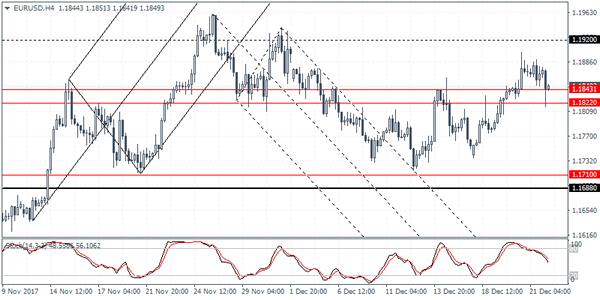
EURUSD (1.1849): The EURUSD closed with a doji yesterday indicating a temporary pause to the rally. Price action remained trading above the support level of of 1.1843 - 1.1822. As long as this support level holds, the euro is expected to remain biased to the upside. Immediate resistance is seen at 1.1920 which could be tested. However, watch for a possible break down of price below the support level, which could potentially keep the euro biased to the downside. A break down below 1.1822 could signal a sideways pattern with lower support at 1.1710 - 1.1688 likely to hold the declines.
Catalonia Vote Dents Sentiment In The Euro
The common currency was seen weakening in the early Asian trading session following the Catalonia elections. After taking direct control of the region, the snap elections announced was expected to be a close call between the pro-Spain parties and the pro-independence parties.
The election results showed that the pro-independence parties winning with an absolute majority with three of the parties winning 70 seats from the 13-seat assembly and just enough to form a government.
Ahead of the holiday week economic data today will include the final GDP data from the UK. GDP is expected to remain steady at 0.4% for the third quarter. Canada will also be releasing its monthly GDP figures. Data from the U.S. includes the durable goods orders report and the personal income and spending data.
Trade Idea : GBP/USD – Stand aside
GBP/USD - 1.3366
Most recent candlesticks pattern : N/A
Trend : Sideways
Tenkan-Sen level : 1.3375
Kijun-Sen level : 1.3360
Ichimoku cloud top : 1.3377
Ichimoku cloud bottom : 1.3376
New strategy :
Stand aside
Position : -
Target : -
Stop : -
As the British pound found support at 1.3332 yesterday and rebounded, retaining our view that further consolidation would be seen, however, reckon downside would be limited to support at 1.3331-32, bring another rebound. Only a drop below 1.3331 would signal the rebound from 1.3302 has ended and revive bearishness for a retest of 1.3302 first, break there would extend weakness towards 1.3265-70.
On the upside, whilst recovery to 1.3390-00 cannot be ruled out, reckon upside would be limited to said resistance at 1.3420 and bring another retreat later. Above 1.3420 would extend the rebound from 1.3302 to 1.3445-50, however, reckon indicated resistance at 1.3466 would hold from here, bring retreat later. As near term outlook is still mixed, would be prudent to stand aside for now.
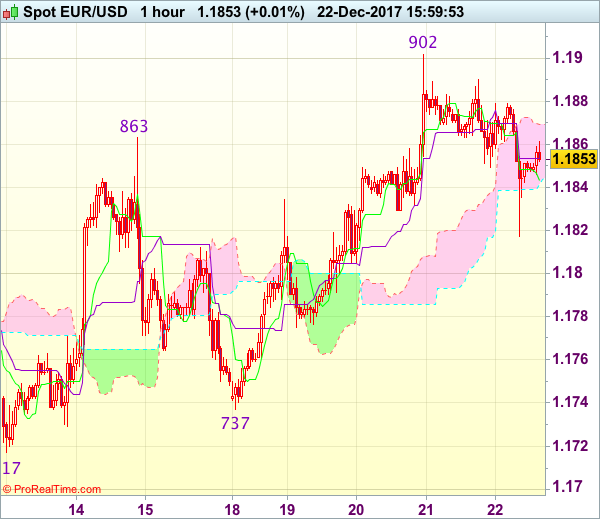
Trade Idea : EUR/USD – Hold long entered at 1.1820
EUR/USD - 1.1852
Most recent candlesticks pattern : N/A
Trend : Near term up
Tenkan-Sen level : 1.1839
Kijun-Sen level : 1.1854
Ichimoku cloud top : 1.1869
Ichimoku cloud bottom : 1.1844
Original strategy :
Bought at 1.1820, Target: 1.1920, Stop: 1.1785
Position : - Long at 1.1820
Target : - 1.1920
Stop : - 1.1785
New strategy :
Hold long entered at 1.1820, Target: 1.1920, Stop: 1.1820
Position : - Long at 1.1820
Target : - 1.1920
Stop : - 1.1820
Although the single currency retreated after meeting resistance at 1.1902 earlier this week and consolidation below this level would be seen, reckon downside would be limited and bring another rise later, above 1.1880 would signal the pullback from 1.1902 has ended, bring retest of this level, break there would extend the erratic upmove from 1.1717 towards resistance at 1.1940 which is likely to hold from here.
In view of this, we are holding on to our long position entered at 1.1820. Below 1.1800 would defer and bring test of 1.1775 support but only break there would suggest top is formed instead, then subsequent retreat to 1.1750 would follow but support at 1.1737 should remain intact.
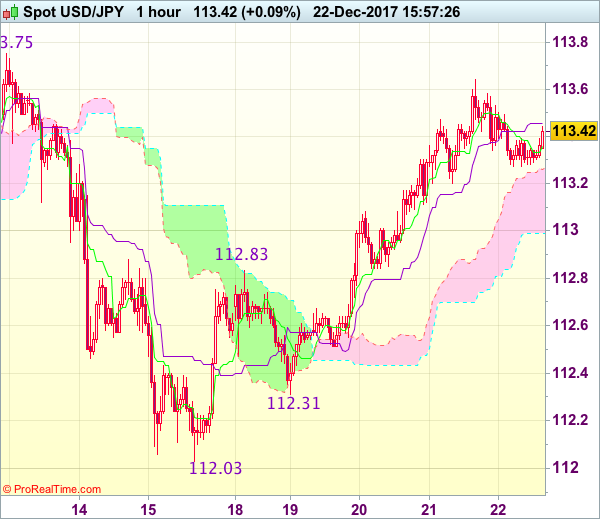
Trade Idea : USD/JPY – Buy at 112.80
USD/JPY - 113.44
Most recent candlesticks pattern : N/A
Trend : Near term up
Tenkan-Sen level : 113.36
Kijun-Sen level : 113.46
Ichimoku cloud top : 113.27
Ichimoku cloud bottom : 112.99
Original strategy :
Buy at 112.80, Target: 113.70, Stop: 112.45
Position : -
Target : -
Stop : -
New strategy :
Buy at 112.80, Target: 113.70, Stop: 112.45
Position : -
Target : -
Stop : -
Although the greenback retreated after rising to 113.64 and consolidation below this level would be seen, reckon pullback would be limited to 113.00-10 and renewed buying interest should emerge around 112.80, bring another rise later, above said resistance would extend the move from 112.03 to resistance at 113.75, however, break there is needed to signal the rise from 110.84 low has resumed for headway towards 113.95-00, then towards 114.30-35 later.
In view of this, we are looking to buy dollar on pullback as 112.80-85 should limit downside and bring another rise later. Below 112.50-55 would suggest top is formed, bring test of 112.31 support but only break of latter level would signal the rebound from 112.03 has ended instead, bring retest of this level later.
USDCAD Sees Increased Downside Risk Below 50-Day Moving Average
USDCAD continues to move sideways in a range since late October. Near-term risk is tilted to the downside. The market is capped below the 200-day moving average and has dropped below the 50-day MA, sifting near-term risk to the downside.
USDCAD is essentially in a consolidation phase between two key Fibonacci retracement levels of the 1.3793 to 1.2061 downleg. The 38.2% Fibonacci (1.2717) and 50% Fibonacci (1.2922) levels are providing support and resistance. The market moved into a neutral phase after bouncing off a more than a 2-year low from 1.2061 in September.
It will likely be a challenge to break above the barriers between the 50% Fibonacci and the key 1.3000 level. A sustained move out of this resistance area would shift the bias to a more bullish one and improve the odds for a move towards 1.3500 and then to re-test the peak at 1.3793.
Near-term momentum is weak and RSI is falling, keeping risk to the downside but strong support is expected at the lower range between 1.2717 (38.2% Fibonacci) and 1.2623 (December 5 low). A break below this area would increase downside pressure and send prices towards the 1.2500 handle and possibly the 1.2061 low.
Overall, USDCAD has changed very little since trading in its well-established more than 2-month old range. The short-term bias is shifting to bearish while prices remain below the 50-day MA and as long as RSI remains below 50.
EUR/USD Trading 25 Pips Lower
Market movers today
In the US, PCE figures for November are due. CPI numbers (usually a good predictor of PCE) for November were weaker than expected. Based on CPI, weest imate PCE core increased 0.1% m/m (1.5% y/y versus 1.4% in October , although October was very close to 1.5% y/y) and PCE headline increased 0.3% m/m (1.8% y/y versus 1.6% y/y in October). The difference between the monthly increase in core and headline PCE is driven by increasing energy prices. However, with yesterday’s slighter weaker than expected Q3 core PCE released with the Q3 GDP, there’s downside risk to our call. Also, in the US, we are due to get core capex orders for November. Capex orders gained strong momentum in the autumn and regional capex plans suggest this trend will continue. The average of the regional capex plans is at its highest level since February 2007, indicating continued tailwinds for core capex orders in coming months.
In the UK, the index of services for October is released today. This indicator is important for the assessment of growth at the beginning of Q4. According to PMI services, service sector growth has been muted in Q4.
The Danish fiscal budget for 2018 should be approved in the third budget hearing after the Liberal Alliance stated that it will support the budget law. We also get the revised national accounts data for Q3 in Denmark, when we will find out whether growth is still estimated to have been as bad as suggested previously.
In Sweden, November retail sales are due to be released. We expect to see modest increases of 0.5% m/m and 1.2% y/y. However, we note that the modest y/y figure reflects mainly a very strong sales performance a year ago.
NAV is due to publish December jobless numbers today in Norway. All leading indicators are point ing to continued above-t rend growth and rising employment and vacancies seem to be holding up well. Therefore, we expect an unchanged jobless rate of 2.3%, which translates into a moderate decrease in seasonally adjusted terms. We expect gross unemployment – our preferred jobless measure – to fall by 1,000 people m/m.
Selected market news
It has been fairly quiet overnight . The market focus this morning is on Spain, as the regional elections in Catalonia showed a win for the pro-independence part ies, with the three separatist groups winning a majority with 70 seats (68 needed). The result is a big blow to Prime Minister Mariano Rajoy’s effort to contain the independence movement when he triggered Article 155 in October. Also, Rajoy’s People’s Party lost eight of its 11 seats, with unionists turning to Ciudadanos, which became the party most voted. The vote leaves political uncertainty as a continued market theme in Spain. Yet , the separatist s’ democratic mandate to leave the rest of Spain remains weak. Market reaction has been fairly muted, with EUR/USD trading 25 pips lower. SPGBs are likely to suffer today but we doubtt his will last long.
Yesterday, 128 UN nations voted in favour of a UN resolut ion calling for the US to drop its recognition of Jerusalem as Israel’s capital (nine nat ions voted against , 35 blank votes), thereby defying US President Trump’s threat to cutaid to yes-voting nations.
EUR/USD Daily Outlook
Daily Pivots: (S1) 1.1851; (P) 1.1870 (R1) 1.1892; More....
With 4 hour MACD crossed below signal line, intraday bias in EUR/USD is turned neutral again. As long as 1.1712 cluster support (61.8% retracement of 1.1553 to 1.1960 at 1.1708) remains intact, near term outlook stays bullish. Break of 1.1960 will resume whole rise from 1.1553 and target 1.2091 high.
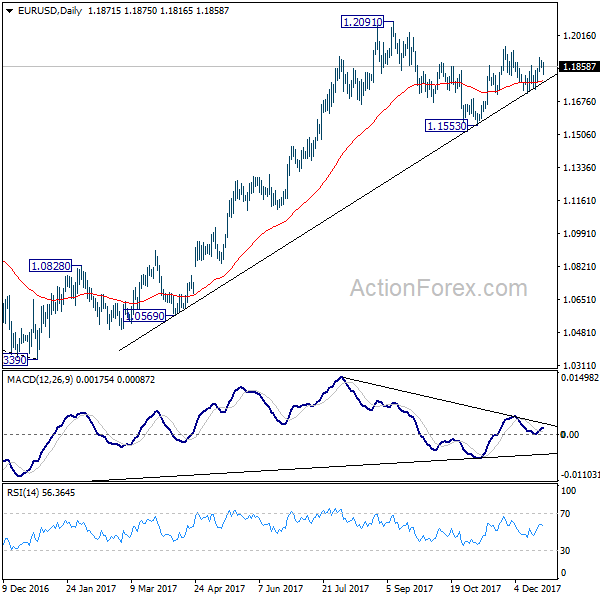
In the bigger picture, rise from 1.0339 medium term bottom is seen as a corrective move for the moment. Therefore, in case of another rally, we'd be expect 38.2% retracement of 1.6039 (2008 high) to 1.0339 (2017 low) at 1.2516 to limit upside and bring reversal. Meanwhile, sustained trading below 55 week EMA (now at 1.1435) will suggest that such medium term rebound is completed and could then bring retest of 1.0339 low.