Sample Category Title
Outlook 2018: GBPUSD in Bullish Bias; Could Continue to Strengthen its Move
GBPUSD has been creating a bearish tendency since November 2007 following the reversal on the 2.1161 resistance level. This year the pair is posting a bullish rally as it has so far posted a positive performance of almost 9%. Following the critical bounce off the 1.1986 barrier, a 31-year low, Cable has been printing an ascending move and signals a further upside move.
On a monthly basis, there is a lot of scope for the rise to continue as the next major level to have in mind is the 1.3820 resistance barrier and moreover, the 1.4000 strong psychological handle if the price breaks the 1.3655 resistance obstacle upwards. Technical indicators are confirming the bullish picture as both, MACD and RSI, are rising and they are approaching the positive zone.
Shifting to the weekly timeframe, an alternative scenario, is a bearish retracement towards the 1.3000 significant psychological level and the 1.2770 support barrier if the pair penetrates to the downside of the uptrend line, which is holding since March 2017. The price needs to go through critical obstacles such as the 100 and 50 simple moving averages (SMAs – weekly).
In addition, in the daily timeframe, the momentum oscillators are standing above their neutral levels. Despite that, the MACD oscillator dropped below the trigger line but the Relative Strength Index (RSI) is flattening. The most probable case is an upward movement during the next year, in the absence of any notable surprises.
Outlook 2018: USDJPY Struggles in a Sideways Channel; Expectations for Gains in 2018
USDJPY has been trading within a symmetrical triangle on a long-term basis since May 2015 and has sunk more than 3.5% during this year so far. The pair has established and traded within a sideways range between the upper boundary of 108.80 and the lower boundary of 114.70, roughly around the 111.00 key level, over the past nine months. In September, the pair posted a bearish weekly candlestick below the aforementioned range but failed to extend its decline and returned back within the 108.10 – 114.70 range.
The price tested several times the 50 and 200 simple moving averages (SMAs) in the weekly timeframe and is currently hovering around them with low volatility. As it stands, if the bulls are strong enough to push the price above the upper bound of the sideways range, dollar/yen could extend its gains towards the next immediate resistance level at 115.50, or moreover, until the 118.60 barrier. On the downside, if the bears take control, the pair may decline towards the 107.30 – 108.10 significant support zone. A break below this trading range could drive USDJPY towards the 105.50 critical barrier. Remaining in the same timeframe, the oscillators do not paint a clear picture since they lie near their neutral levels with weakening momentum.
Having a look in the daily timeframe, the signals are virtually the same with the weekly chart as the MACD and the RSI are moving near their neutral levels, slightly above the zero line and close to the 50 level respectively.
Outlook 2018: EURUSD Bulls Could Take the Lead Again
EURUSD is trading within a descending move on a long-term timeframe over the last nine years. However, the pair has managed to advance more than 12% so far during 2017 following the rebound from the major support level of 1.0340 – a 14-year low. The world's most traded currency pair recorded eight bullish months out of 12 in the year to date and is currently trading above the 50-month simple moving average (SMA), which is acting as a significant obstacle for the bear traders.
EURUSD is trading within a descending move on a long-term timeframe over the last nine years. However, the pair has managed to advance more than 12% so far during 2017 following the rebound from the major support level of 1.0340 – a 14-year low. The world's most traded currency pair recorded eight bullish months out of 12 in the year to date and is currently trading above the 50-month simple moving average (SMA), which is acting as a significant obstacle for the bear traders.
Over the last five months, the price has remained constrained below the 1.2100 psychological level and the outlook for the next year is for a test of the 1.2570 resistance level, which coincides with the 100-month SMA, conditional upon the price breaking above the aforementioned psychological level. Moreover, on the monthly chart, the next level to have in mind is the 1.2750 barrier, which stands near the long-term descending trend line that has been holding since July 2008. However, the price needs to go through the 38.2% Fibonacci retracement level, at 1.2520, between the high at 1.6040 and the low at 1.0340.
On the other hand, in case of a sell-off, the bears could open the way for the 1.1310 support level if there is a penetration of the 1.1550 barrier.
Going to the weekly timeframe, EURUSD is trading well above the three simple moving averages (50, 100 and 200), an indication of further buying interest. Remaining in the same chart, the technical indicators are holding within the positive territory and the RSI indicator is pointing to the upside. However, the MACD oscillator is moving below the trigger line with weakening momentum.
Having also a look at the daily timeframe, the single currency is developing within a shallow downward sloping channel against the greenback over the last three months, with a high at 1.2090 and the low at 1.1550. The MACD and the RSI indicators are slightly flattening above their mid-levels.
Yen Yawns as BoJ Stays on the Sidelines
USD/JPY is showing little movement in the Thursday session. In North American trade, USD/JPY is trading at 113.51, up 0.10% on the day. On the release front, the Bank of Japan maintained monetary policy and held short-term interest rates at -0.10%. In the US, Final GDP in the third quarter came in at 3.2%, just short of the estimate of 3.3%. Other US data was a mix. The Philly Fed Manufacturing Index jumped to 26.2, above the forecast of 21.5 points. Unemployment Claims disappointed, climbing to 245 thousand. This was much higher than the estimate of 232 thousand. Friday also promises to be busy, with the release of three key indicators – Core Durable Goods, New Home Sales and UoM Consumer Sentiment.
There were no surprises from the BoJ, which wrapped up a two-day policy meeting. Policymakers voted to hold record low interest rates and the target for the 10-year government bond yield at zero percent. The BoJ acknowledged stronger economic conditions, saying that the "economy is expanding moderately". A stronger global economy has boosted Japan's export and manufacturing sectors. However, inflation levels remains well below the BoJ's target of around 2 percent, and with this trend likely to continue well into 2018 or later, the BoJ is likely to hold the course on interest rate levels and its ultra-accommodative stimulus program. At a news conference, BoJ Governor stressed the importance of reaching the 2% inflation target, adding that the Bank would not "raise interest rates just because the economy is improving."
It was a tight battle, but President Trump and his Republican colleagues are finally celebrating their landmark tax reform legislation, marking Trump's first major legislative victory in office. On Wednesday, the House of Representatives voted to pass Trump's tax reform bill, after it narrowly passed in the Senate, by a vote of 51-48. Trump is expected to sign the bill into law next week. The tax legislation marks the first major overhaul of the US tax code in 30 years, and reduces corporate taxes from 35% to 21%. After failing to overturn Obamacare, the Republicans finally scored a big win, and will now have to sell the tax plan to a skeptical public, with congressional elections slated for November 2018.
CAD Gains on Positive CPI and Retail Sales Data
The price of the EUR/USD is showing an increase in volatility due to the split stance of traders on the tax reform bill in the US. Tax inflows to the world's largest economy may be reduced by 1.5 trillion dollars if the proposed tax cuts get approved by parliament and we may see the depreciation of the US dollar due to profit taking. Additional pressure on the US economy came from the news on GDP growth in the US of only 3.2% in the third quarter compared to the 3.3% forecasted. Slower than anticipated economic expansion may delay the Fed's rate hikes planned for 2018 and that in turn will be negative for the greenback.
The NZD/USD demonstrates a confident ascending movement following yesterday's release of the GDP report. New Zealand's economy expanded by 0.6% in the third quarter against the last quarter which was in line with the forecast.
The UK pound is under pressure from political instability. The deputy of the British Prime Minister has resigned and that may influence the course of the current negotiations on the Brexit terms. At the same time, investors are waiting for important macro statistics from the UK on GDP growth and the current account balance tomorrow.
The USD/CAD has sharply fallen on the background of unexpectedly strong retail sales growth of 1.5% in October which is 1.2% better than expected. At the same time, the consumer price index in November has grown by 0.3% which is 0.1% better than the average prediction and 0.2% more than in the previous month. Strong inflation growth enables the Bank of Canada to raise interest rates in 2018.
EUR/USD
The EUR/USD quotes have broken the SMA100 on the 15-minute chart and in case of continued declines may reach the closest support lines at 1.1825 and 1.1730. The growth potential is likely to be limited by the nearest resistance at 1.1925, breaking through this level may open the way for a further price increase to 1.2000.
NZD/USD
The NZD/USD is rising within the limits of the sideways corridor 0.6950-0.7030. Gaining a foothold above 0.7030 may become the basis for continued price growth to 0.7200. The RSI on the 15-minute chart is near the overbought zone, which may be a sign of a descending price correction soon. In order to switch to the bearish trend, the quotes need to break through the support at 0.6950.
USD/CAD
The USD/CAD has shown a powerful descending impulse caused by the macro data release in Canada. As a result, quotes have broken the important support at 1.2800 and the next targets in case of maintaining the current impulse will be at 1.2660 and 1.2600. After the sharp fall we do not eliminate the chance of an upward correction soon due to profit taking.
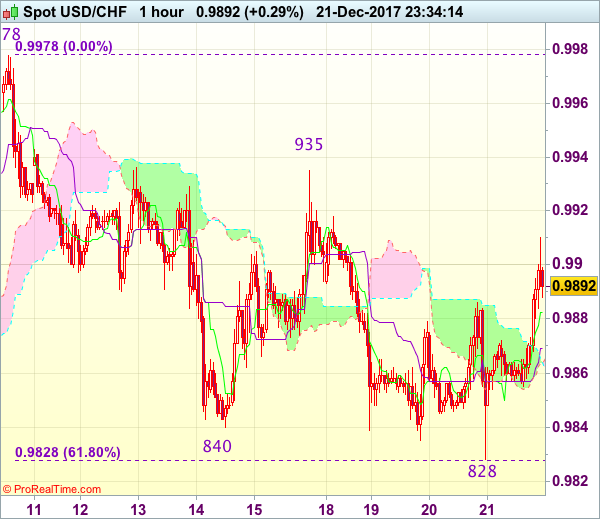
Trade Idea Wrap-up: USD/CHF – Buy at 0.9860
USD/CHF - 0.9890
Most recent candlesticks pattern : N/A
Trend : Near term down
Tenkan-Sen level : 0.9884
Kijun-Sen level : 0.9869
Ichimoku cloud top : 0.9866
Ichimoku cloud bottom : 0.9861
New strategy :
Buy at 0.9860, Target: 0.9960, Stop: 0.9825
Position : -
Target : -
Stop : -
Despite yesterday’s brief fall to 0.9828, lack of follow through selling on break of previous support at 0.9835 and the subsequent rebound suggest consolidation would be seen with mild upside bias for gain to 0.9915-20, however, break of resistance at 0.9935-36 is needed to signal low has been formed, bring a stronger rebound to 0.9960-65 but indicated resistance at 0.9978 should hold from here.
In view of this, we are looking to buy dollar on dips. Below said support at 0.9828 would revive bearishness and extend the decline from 0.9978 to 0.9795-00, however, reckon downside would be limited to 0.9750 and risk from there has increased for a rebound later due to anticipated oversold condition.
Loonie Rallies after Upbeat Canadian Data
USDCAD fell to one-week low at 1.2719 after US/Canada data. US GDP fell below expectation in Q3 (3.2% vs 3.3% f/c/prev) while US jobless claims rose unexpectedly to 245K, beating forecast for 231K and previous week's 225K. Weaker than expected US data depressed the greenback while loonie was boosted by upbeat Canadian figures. ADP report showed 59.2K new jobs created in November compared to -5.7k figure previous month. Inflation in Canada rose by 0.3% in Nov vs 0.1% in Oct and 0.2% f/c. Canada's retail sales have also heavily beaten forecast with 1.5% rise in Nov vs 0.3% f/c and 0.2% in Oct. Today's extension of bear-leg from 1.9200 (19 Dec high) cracked important support at 2.2740 (Fibo 38.2% of 1.2450/1.2920 upleg and pressured another strong point at 1.2712 (top of thick daily cloud). Fresh weakness is forming a triple-top at 1.2900 zone (after the most recent upside attempt was capped by falling 200SMA) which could signal stronger bearish acceleration. South-heading daily RSI, which moved from neutrality zone and daily MACD bearish divergence, support the notion. However, close below cloud top is needed for stronger bearish signal as rising and thickening daily cloud continues to underpin the action since it twisted higher in mid-November. Repeated rejection at cloud top (downside attempts were already rejected here on 14/15 Dec) would signal extended consolidation between cloud top and short-term range top at 1.2920.
Res: 1.2806; 1.2838; 1.2880; 1.2920
Sup: 1.2712; 1.2685; 1.2665; 1.2630
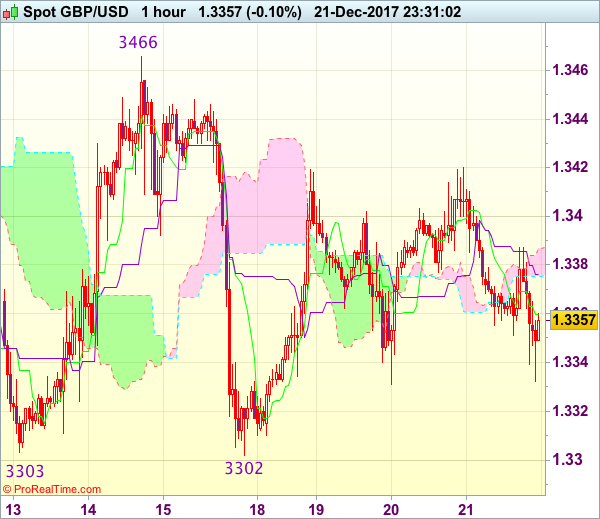
Trade Idea : GBP/USD – Stand aside
GBP/USD - 1.3350
Most recent candlesticks pattern : N/A
Trend : Sideways
Tenkan-Sen level : 1.3360
Kijun-Sen level : 1.3376
Ichimoku cloud top : 1.3387
Ichimoku cloud bottom : 1.3375
New strategy :
Stand aside
Position : -
Target : -
Stop : -
As the British pound retreated after rebounding to 1.3420 in part due to cross-trading, suggesting consolidation would be seen, however, reckon downside would be limited to support at 1.3331, bring another rebound. Only a drop below 1.3331 would signal the rebound from 1.3302 has ended and revive bearishness for a retest of 1.3302 first, break there would extend weakness towards 1.3265-70.
On the upside, whilst recovery to 1.3380-85 cannot be ruled out, reckon upside would be limited to said resistance at 1.3420 and bring another retreat later. Above 1.3420 would extend the rebound from 1.3302 to 1.3445-50, however, reckon indicated resistance at 1.3466 would hold from here, bring retreat later. As near term outlook is still mixed, would be prudent to stand aside for now.
EURAUD Looking Neutral in Short-Term and Bullish in Medium-Term
EURAUD is losing some ground during today's trading after finishing the day higher in the three preceding days.
The RSI has to a large extent been moving sideways over the last few days, pointing to the absence of momentum in either direction. The indicator is currently at 48, close to the 50 neutral-perceived level.
Upside movements could meet resistance at around 1.5552, this being the current level of the middle Bollinger line – a 20-day moving average line. Further above, the focus would shift around the near two-year high of 1.5769, which also encapsulates the upper Bollinger band (1.5773), for additional resistance to stronger bullish movement.
On the way down, support might come around the current level of the 50-day MA at 1.5361. The range around this level includes the lower Bollinger band (1.5329), as well as December 15's five-week low (1.5321).
The medium-term picture is looking bullish: both the 50- and 100-day MAs maintain a positive slope with price action taking place above them. A bullish (golden) cross was also recorded in late September when the 50-day MA moved above the 100-day one. Notice though that the price is at the moment not far above the current level of the 50-day MA. A drop below this mark – 1.5361 – would weaken the bullish medium-term structure, tilting it towards neutrality.
Overall, the short-term bias is looking neutral and the medium-term outlook looks predominantly bullish.
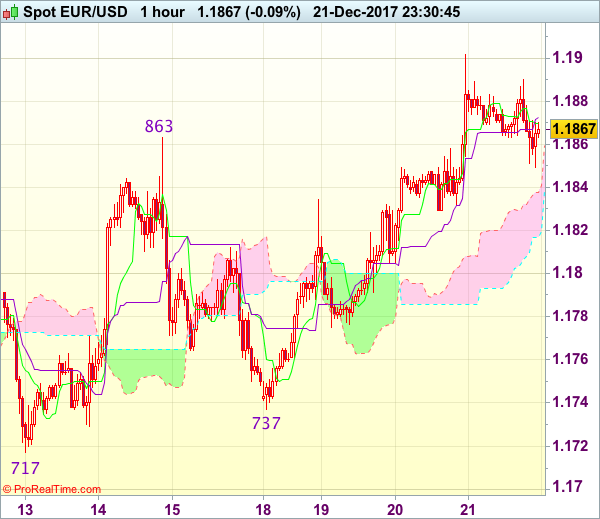
Trade Idea Wrap-up: EUR/USD – Buy at 1.1820
EUR/USD - 1.1857
Most recent candlesticks pattern : N/A
Trend : Near term up
Tenkan-Sen level : 1.1870
Kijun-Sen level : 1.1870
Ichimoku cloud top : 1.1838
Ichimoku cloud bottom : 1.1817
Original strategy :
Buy at 1.1820, Target: 1.1920, Stop: 1.1785
Position : -
Target : -
Stop : -
New strategy :
Buy at 1.1820, Target: 1.1920, Stop: 1.1785
Position : -
Target : -
Stop : -
As the single currency has eased after rising to 1.1902 yesterday, minor consolidation below this level would be seen and pullback to 1.1840 cannot be ruled out, however, reckon 1.1805-10 would contain downside and bring another rise later, above said resistance at 1.1902 would extend the erratic upmove from 1.1717 towards resistance at 1.1940 which is likely to hold from here due to near term overbought condition.
In view of this, would not chase this rise here and would be prudent to buy euro on pullback as 1.1820 should limit downside. Below 1.1800 would bring test of 1.1775 support but only break there would suggest top is formed instead, then subsequent retreat to 1.1750 would follow but support at 1.1737 should remain intact.