Sample Category Title
US 100 Index Not Far Below All-Time High, Stochastics Signal Possible Pullback In Very Short-Term
The US 100 index is currently trading relatively close to the all-time high of 6,525.00 hit on Monday.
The bias in the short-term remains positive as indicated by the Tenkan-sen line being above the Kijun-sen one, despite the index losing some ground in the two days that preceded. However, the stochastics are suggesting that the pullback might continue in the very short-term: the %K line has crossed below the slow %D line, with both lines currently heading lower. This is viewed as a bearish signal.
Should US 100 indeed decline, support could come around the current level of the Tenkan-sen at 6,431.80. Notice that the area around this level also encapsulates a top from the recent past at 6,424.55. The Kijun-sen line, which lies not far below at 6,376.95, might provide additional support in the event of sharper declines.
On the upside, resistance could occur around the record high of 6,525.00 from earlier in the week. A break above might spur bullish sentiment and lead to further advancing, with 7,000 being a psychological landmark that could pose a barrier further above.
The index is in an uptrend, with price action taking place above both the 50- and 100- day moving averages and both MAs moving higher. All these are pointing to a picture in the medium-term that is clearly bullish.
Overall, US 100’s short-term bias and medium-term outlook are positive, though a fall in the very short-term is not to be ruled out.
EURUSD Jumps Towards 1.1900 Critical Level, Hits Three-Week High
EURUSD surged during the European afternoon on Wednesday and jumped towards the 1.1900 critical handle, almost reaching a three-week high. For the past two weeks, the euro has been developing within a narrow range between 1.1715 and 1.1862 versus the US dollar and Wednesday's high was just 40 pips above the range's peak. Moreover, the price printed the third straight positive day yesterday and the next immediate resistance levels are the 1.1938 and the 1.1960.
Currently, euro/dollar is trading slightly above the 23.6% Fibonacci retracement level, at 1.1865, of the last upward movement with the low at 1.1553 and the high at 1.1960.
On the reverse side, in case of a breakdown below 1.1865, the pair could open the door for the 38.2% Fibonacci level near 1.1800. However, for that to happen the price would also need to go through the 1.1827 support barrier and the 100-simple moving average on the 4-hour chart.
Turning to the technical indicators, in the same short-term chart, the RSI and the MACD are painting a positive picture in the short term. The Relative Strength Index (RSI) is moving near the overbought zone with weakening momentum, whilst the MACD oscillator climbed above its trigger line and is holding in the positive territory. Also, the three simple moving averages (50, 100 and 200) are pointing to the upside following the price action.
Looking on the weekly timeframe, the world's most traded currency pair is ready to record a bullish week snapping the three previous losing sessions.
DAX Under Pressure As Markets Eye Catalonia Vote
The DAX index has ticked lower on Thursday, after recording losses in the Tuesday and Wednesday sessions. Currently, the index is at 13,067.50, down 0.01% on the day. There are no eurozone events on the schedule. In the US, today’s key event is Final GDP. We’ll also get a look at the Philly Fed Manufacturing Index and unemployment claims. On Friday, Germany releases GfK Consumer Climate, an important gauge of consumer confidence.
European stock markets have been under pressure all week, and the DAX has declined by 1 percent. The slide could continue, as the markets anxiously await the results of the Catalan election. Spain was rocked by political uncertainty earlier this year, as the Catalan government declared independence from Spain. The national government declared the move illegal and promptly clamped down with direct rule on the region. The election campaign between nationalists and secessionists has been bitter and divisive, and no clear winner is expected, which could mean a hung parliament and more uncertainty ahead.
The Republicans and President Trump are walking tall on Thursday, after celebrating their first major legislative victory in Congress since Trump became president. On Wednesday, the House of Representatives voted for to pass Trump’s tax reform bill, after it narrowly passed in the Senate, by a vote of 51-48. Trump is expected to sign the bill into law next week. The tax legislation marks the first major overhaul of the US tax code in 30 years, and reduces corporate taxes from 35% to 21%. After failing to overturn Obamacare, the Republicans finally scored a big win, and will now have to sell the tax plan to a skeptical public, with congressional elections slated for November 2018.
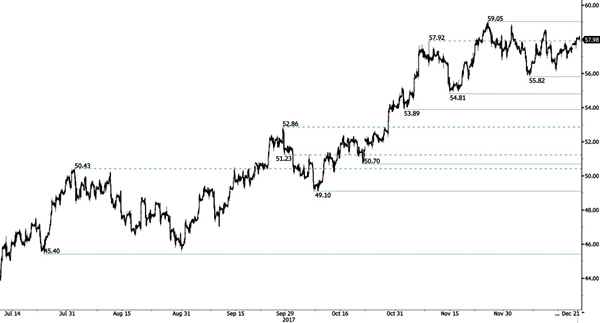
CRUDE OIL Ready To Test Strong Resistance Area
Crude oil is has failed to break resistance given at 59.05 (24/12/2017 high). Support is given at 55.82 (07/12/2017 low). As volatility declines, expected to show further bearish breakout.
In the long-term, crude oil has recovered after its sharp decline last year. However, we consider that further weakness are very likely. For the time being the pair lies in an upside momentum. Strong support lies at 35.24 (05/04/2016) while resistance can now be found at 55.24 (03/01/2017 high).
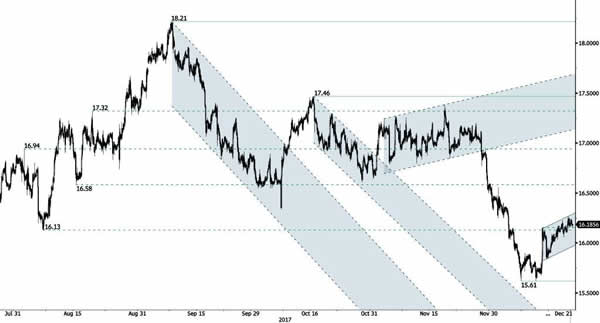
SILVER Continued Bounce
Silver has been bouncing on hourly support at 15.61 (14/07/2017 low). Hourly resistance given at 16.15 (13/12/2017 high) has been broken. Expected to show continued bullish pressures.
In the long-term, the trend is rater negative. Further downsides are very likely. Resistance is located at 25.11 (28/08/2013 high). Strong support can be found at 11.75 (20/04/2009).
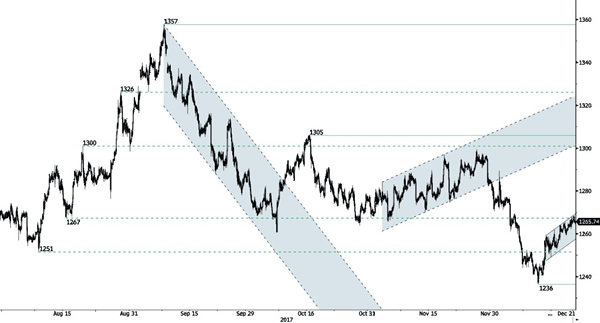
GOLD Starting A New Bullish Momentum
Gold is consolidating after the strong collapse even though traders are taking some profit. Hourly support is given at 1236 (12/12/2017 low) . Resistance is located at 1259 (14/12/2017).
In the long-term, the technical structure suggests that there is a growing upside momentum. A break of 1392 (17/03/2014) is necessary ton confirm it, A major support can be found at 1045 (05/02/2010 low).
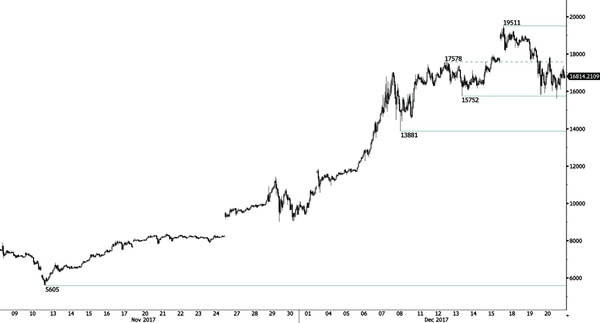
BITCOIN Consolidating
Bitcoin's bullish momentum is far fom over despite consolidation phase. The technical structure has shown a tremendous positive short-term momentum. Hourly support area is located around 15'752 (13/12/2017 low). In the short-term, the digital currency should continue rising towards levels unseen so far.
In the long-term, the digital currency has had an exponential growth. There are decent likelihood that the asset will reach $40'000 in 2018.
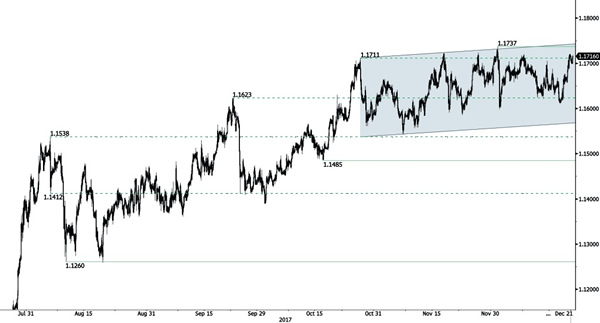
EUR/CHF Slow Increase
EUR/CHF is trading slightly higher. Hourly resistance is given at 1.1737 (01/12/2017 high). Expected to show continued short-term increase.
In the longer term, the technical structure has reversed. Strong resistance is given at 1.20 (level before the unpeg). Yet, the ECB's QE programme is likely to cause persistent selling pressures on the euro, which should weigh on EUR/CHF. Supports can be found at 1.0184 (28/01/2015 low) and 1.0082 (27/01/2015 low).
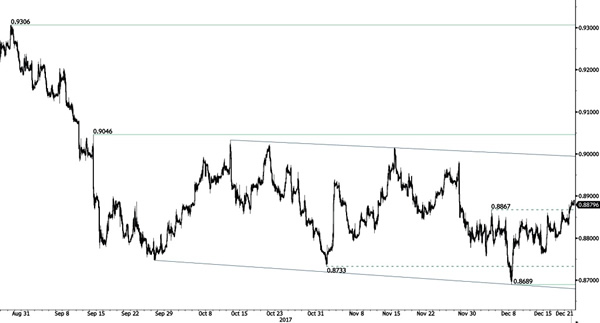
EUR/GBP Pushing Higher
EUR/GBP is trading slightly lower. The pair is trading between support at 0.8689 (08/12/2017 low). Resistance is located at 0.8867 (05/12/2017 high). Expected to show further sideways trading.
In the long-term, the pair has largely recovered from recent lows in 2015. The technical structure suggests a growing upside momentum. The pair is trading above from its 200 DMA. Strong resistance can be found at 0.9500 (psychological level).
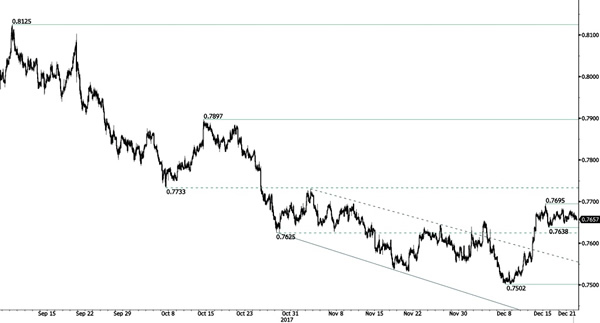
AUD/USD Consolidating Below 0.77
AUD/USD's upside pressures are growing. Hourly resistance is given at a distance at 0.7695 (15/12/2017 high). Support stands at 0.7502 (08/12/2017 low). Expected to push even higher.
In the long-term, the trend is turning positive. Key supports stands at 0.6009 (31/10/2008 low) . A break of the key resistance at 0.8164 (14/05/2015 high) is needed to invalidate our long-term bearish view.