Sample Category Title
GBP/USD Analysis: Continues To Move In Triangle
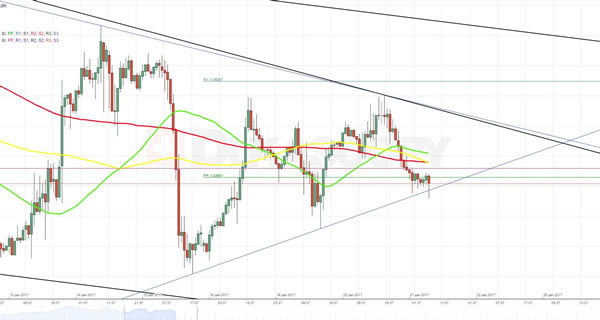
Although yesterday's fluctuations required some adjustments, the main assumption remained unchanged. The cable is continuing to trade in a symmetrical triangle pattern whose upper trend line simultaneously represents the slope of a larger falling wedge formation. From dominant pattern's perspective the breakout should happen in southern direction towards support zone located between the 1.3338 and 1.3331 marks. Most probably, traders anticipate final adoption of tax bill . However, the pair might prematurely leave the junior pattern if the pressure of 55-, 100- and 200-hour SMAs together with the monthly PP will match with release of better than expected information on the American Final GDP. On the other hand, it should be noted that 56% of pending orders in 100-pip range are set to buy.
EUR/USD Analysis: Fails To Pass Through 61.8% Fibo
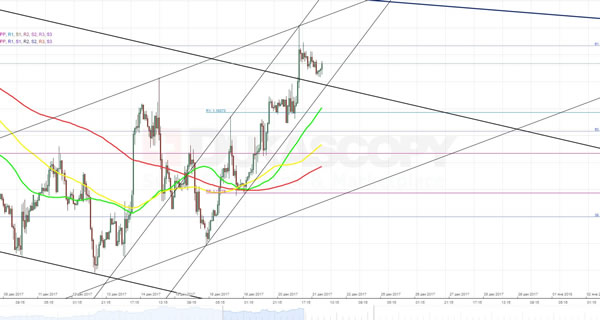
The common European currency continued to rise against the Dollar in a tiny ascending channel. Despite release of improved housing data the pair managed to break through the upper boundary of a one-month long descending channel and end the day at the 61.8% Fibonacci retracement level located at 1.1887. The rising moving averages that are lying along the lower edge of the pattern are expected to support the further surge. However, there is a need to take into account that supposed resistance zone located around the 1.1910 mark might lead to a fully-fledged rebound. If this scenario materializes it might be a sign confirming an existence of another larger ascending channel. In this regard it should be noticed that 51% of pending orders in 100-pip range are set to sell.
XAU/USD Analysis: Trades Around 1,268.00
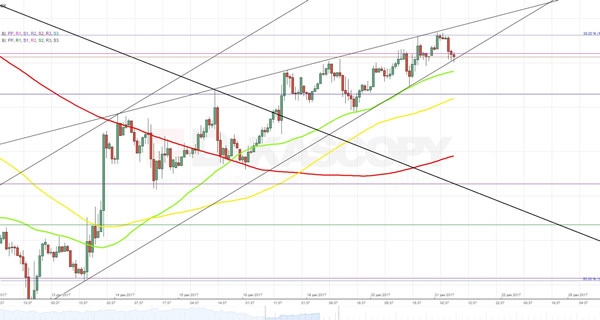
The whole previous trading session the exchange rate spent exactly as expected. First, the yellow metal continued to advance against the buck in a minor rising wedge pattern that has formed at the intersection of two junior ascending channels. Second, it surged to the 38.2% Fibonacci retracement level located at 1,268.00 and then pulled back to the weekly R1. Today the rate is expected resume the upward movement using the support provided by 55-hour SMA that lies along the lower trend line of the pattern. However, by the end of the day the pattern most probably will be dissolved. In this respect, a resistance zone located around the 1,269.00 level as well as the upcoming release of the US Final GDP data suggests that the breakout will happen to southern direction.
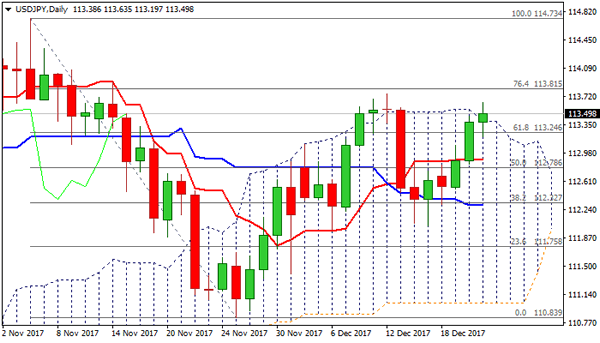
Technical Outlook: USDJPY Extends Above Daily Cloud After Unchanged BoJ
The pair remains bid and extends rally after BoJ left policy unchanged and signaled no plans for raising rates soon.
BoJ said strong economy is not enough as inflation remains well below target.
Fresh advance on Thursday broke above daily cloud (cloud top lies at 113.40) and is on track to fully retrace 113.74/112.02 corrective phase, with lift above pivotal barriers at 113.74/81 (12 Dec high / Fibo 76.4% of 114.73/110.83 descend) to open way towards key short-term barrier at 114.73 (06 Nov peak / top of multi-month range).
Close above daily cloud is needed to confirm bullish signal, however, hesitation at 113.74/81 barriers cannot be ruled out as slow stochastic in entering overbought zone on daily chart.
Rising 10SMA offers solid support at 113.04.
Res: 113.63, 113.74, 114.15, 114.40
Sup: 113.34, 113.20, 113.04, 112.87
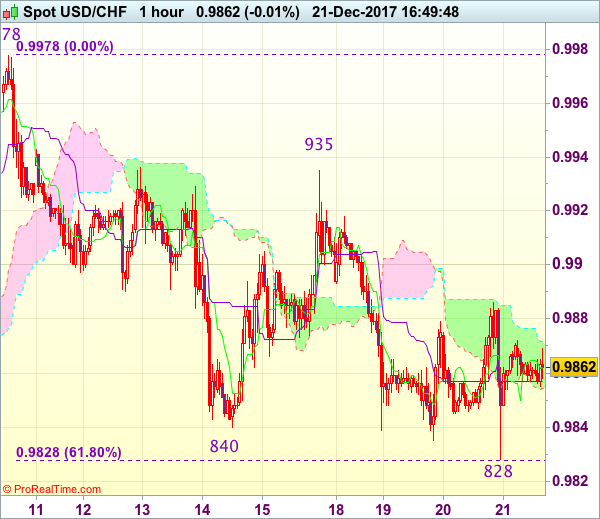
Trade Idea : USD/CHF – Stand aside
USD/CHF - 0.9862
Most recent candlesticks pattern : N/A
Trend : Near term down
Tenkan-Sen level : 0.9862
Kijun-Sen level : 0.9857
Ichimoku cloud top : 0.9870
Ichimoku cloud bottom : 0.9855
Original strategy :
Exit long entered at 0.9850,
Position : - Long at 0.9850
Target : -
Stop : -
New strategy :
Stand aside
Position : -
Target : -
Stop : -
Despite yesterday’s brief fall to 0.9828, lack of follow through selling on break of previous support at 0.9835 and the subsequent rebound suggest consolidation would be seen, however, break of 0.9886 resistance is needed to signal low has been formed, bring a stronger rebound to 0.9910-15 but indicated resistance at 0.9935-36 should hold from here, bring another decline.
On the downside, below said support at 0.9828 would extend the decline from 0.9978 to 0.9795-00, however, reckon downside would be limited to 0.9750 and risk from there has increased for a rebound later due to anticipated oversold condition. As near term outlook is still mixed, would be prudent to stand aside for now.
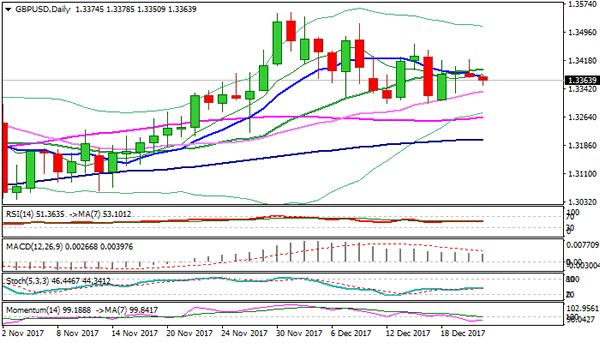
Technical Outlook: GBPUSD – Negative Near-Term Bias After Rejection Above 1.3400
Cable stands at the back foot on Thursday following previous day's strong upside rejection above 1.3400 handle.
Today's action was capped by falling 10SMA and fresh easing pressures strong supports at 1.3334 (daily cloud top / rising 30SMA), loss of which would open key near-term support (1.3300 base).
Near-term action is holding in choppy consolidation in past over one week and break of either boundary (1.3300 / 1.3464) is needed to provide stronger direction signal as technical studies are in mixed mode on daily chart, but building up negative momentum keeps near-term focus shifted lower.
However, thinning volumes ahead of Christmas holidays may keep the pair within narrow range.
Res: 1.3378, 1.3395, 1.3420, 1.3447
Sup: 1.3350, 1.3334, 1.3300, 1.3264
Forex Technical Analysis: EUR/USD, USD/JPY, GBP/USD
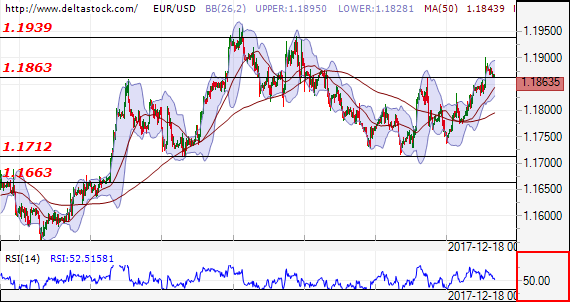
EUR/USD
Current level - 1.1863
The outlook is negative for a breakthrough of the support level at 1.1863. The next support will be at 1.1712. In positive direction the resistance level is at 1.1939.
| Resistance | Support | ||
| intraday | intraweek | intraday | intraweek |
| 1.1863 | 1.1939 | 1.1712 | 1.1663 |
| 1.1939 | 1.2090 | 1.1712 | 1.1550 |
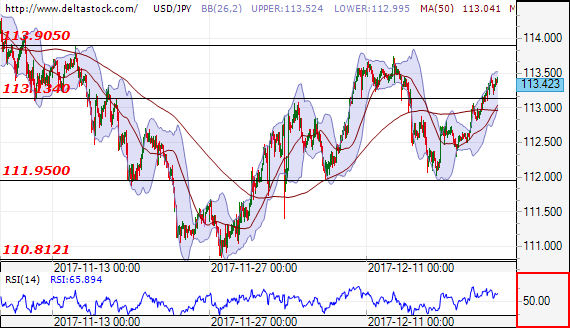
USD/JPY
Current level - 113.42
After the successful breakthrough of the resistance level at 113.13, the outlook is positive for test of the resistance at 113.90. In negative direction a breakthrough at 113.13, may lead to a test of the next support at 111.95.
| Resistance | Support | ||
| intraday | intraweek | intraday | intraweek |
| 113.90 | 113.90 | 113.13 | 109.50 |
| 113.90 | 114.50 | 111.95 | 107.30 |
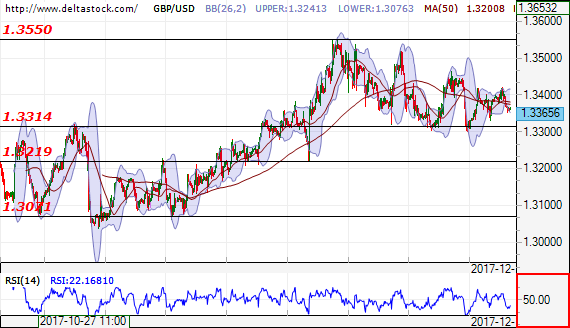
GBP/USD
Current level - 1.3365
The outlook is negative for another test of the support level at 1.3314. With a successful breakthrough of that level, the next support will be at 1.3219. In positive direction the resistance level will be at 1.3550.
| Resistance | Support | ||
| intraday | intraweek | intraday | intraweek |
| 1.3550 | 1.3660 | 1.3314 | 1.3220 |
| 1.3550 | 1.3660 | 1.3220 | 1.3070 |
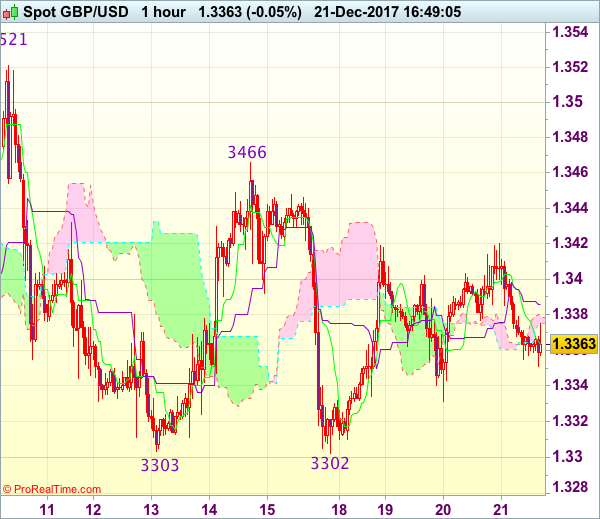
Trade Idea : GBP/USD – Stand aside
GBP/USD - 1.3369
Most recent candlesticks pattern : N/A
Trend : Sideways
Tenkan-Sen level : 1.3366
Kijun-Sen level : 1.3386
Ichimoku cloud top : 1.3379
Ichimoku cloud bottom : 1.3375
New strategy :
Stand aside
Position : -
Target : -
Stop : -
As the British pound retreated after rebounding to 1.3420 in part due to cross-trading, suggesting consolidation would be seen, however, reckon downside would be limited to 1.3350 and support at 1.3331 should hold, bring another rebound. Only a drop below 1.3331 would signal the rebound from 1.3302 has ended and revive bearishness for a retest of 1.3302 first.
On the upside, whilst recovery to 1.3400 cannot be ruled out, reckon upside would be limited to said resistance at 1.3420 and bring another retreat later. Above 1.3420 would extend the rebound from 1.3302 to 1.3445-50, however, reckon indicated resistance at 1.3466 would hold from here, bring retreat later. As near term outlook is still mixed, would be prudent to stand aside for now.
Cheer Ebbs Over U.S Tax Cuts | Higher Dollar Pushed Gold Lower
House Republicans passed tax overhaul
Stock market moves lower as optimism was already baked in
Aggressive Fed rate hike would have the potential to bring panic in the market
European markets are trading lower and we have more stocks trading lower than the stocks trading higher. We had a more upbeat reading for the French dec business confidence (112 vs 11) but investors have clearly paid no attention to it.
Back in the US, Mr Trump finally has something that he can put his name on, and it took him more than 10 months to get it across the tax line. House passed the US tax overhaul yesterday and Mr Trump celebrated his victory. However, markets have not shown any enthusiasm for this development. Wall Street closed mostly lower yesterday and all three major indices were red.
The US tax overall, under which corporation tax is cut substantially, certainly has the element to boost the US GDP, but in terms of stock market, a lot of this optimism was already basked in. Investors have been pushing the markets higher mainly on the back of this hope that the US tax overhaul will encourage firms to spend more and that will have a more positive impact on their balance sheet. Given the returns we have seen for all the major US indices for this year, you can surely make an argument that investors are exhausted and more interested in taking the profit off the table.
The pullback in the US stock market could present an opportunity for those who have been sitting on the sidelines. After all, Mr Trump also promised that he is going to spend big to upgrade the infrastructure of the US. In 2018, that would be one of his biggest goal and markets would remain focus on that simple element.
Aggressive Fed rate hike would have the potential to bring panic in the market, but the Fed has been very calm throughout this year and their approach was immensely measured. Thus, the chances of the Fed spooking the markets are still slim. This argument would hold a lot of ground only if we have had the same Fed chairperson. Unfortunately, that is not the reality, a new Fed chairperson, who currently seems like would adopt the same strategy as Janet Yellen, would have a different approach in dealing with various matters. Therefore, the threat would be serious that the Fed may derail the recovery by tightening the monetary policy aggressively.
We think that the pullback in the equity market could bring some shine for the yellow metal. Trump’s threat to withdraw aid for the countries which have voted against his Jerusalem decision also clearly states that geopolitical tensions aren't going away anytime soon and they could support the metal price in the long term.
The current weakness in the gold price is mainly due to the strength of the dollar.
Daily Wave Analysis: EURUSD Tests Resistance Whereas GBPUSD At Key Support
Currency pair EUR/USD
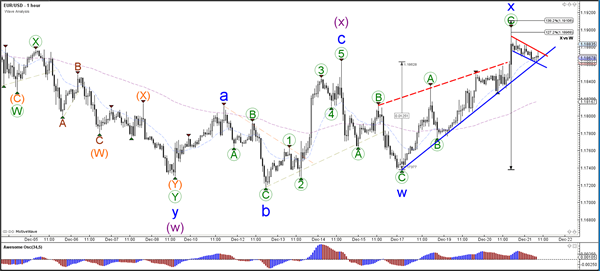
The EUR/USD is testing the Fibonacci levels of wave X v W. A break above the138.2% Fibonacci level invalidates this wave X pattern and could indicate a larger bullish breakout. A bearish reversal could send the EUR/USD lower to test the Fib levels of wave 2 vs 1 (pink).
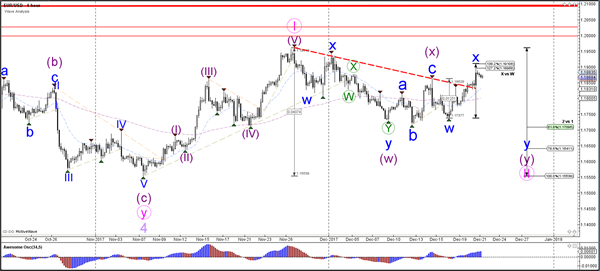
The EUR/USD broke the resistance of the rising wedge pattern yesterday and is now challenging support trend lines (blue).
Currency pair USD/JPY
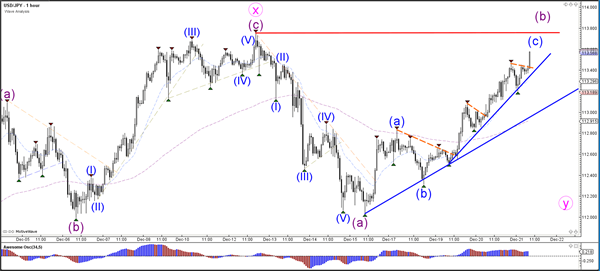
The USD/JPY is now challenging the resistance level of wave B (purple). A bearish bounce could see price fall towards the Fib levels of wave 2 or B (light purple).
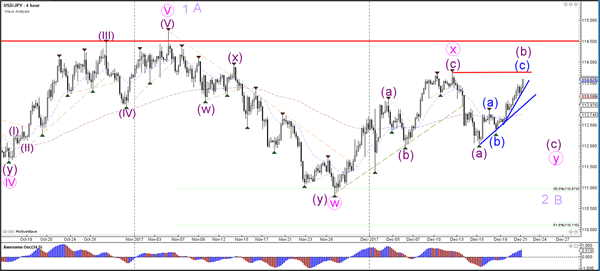
A break above the 100% level at 113.75 would invalidate the ABC zigzag (purple) and indicate that the current wave C (blue) could rather be a wave 3.
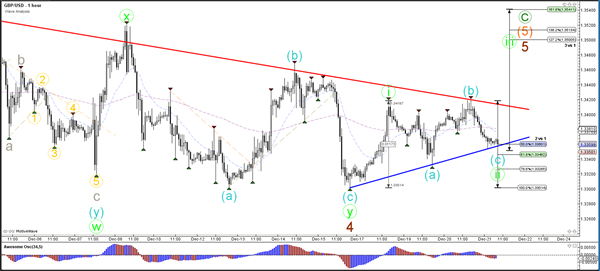
Currency pair GBP/USD
The GBP/USD support and resistance trend line seems to be a large bull flag chart pattern. A bullish breakout could confirm the pattern and a wave 5 of wave C.
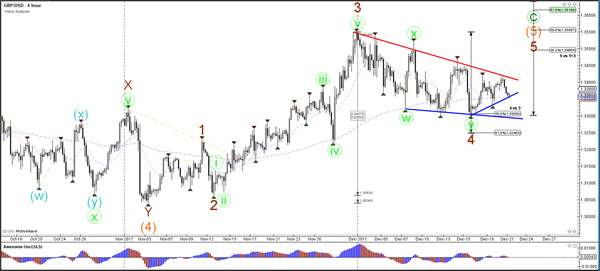
The GBP/USD seems to be building a potential ABC (blue) within a larger wave 1-2 (green) pattern.