Sample Category Title
Bitcoin Falls As South Korean Exchange Goes Bust
On Wednesday, Bitcoin fell after South Korean-based exchange, Youbit, filed for bankruptcy following a supposed hack from the North.
In the United States, Coinbase, announced that it was starting an investigation on alleged insider trading involving bitcoin cash which had just started trading on the platform.
Further, reports from the CME and CBOE indicated that the demand for bitcoin futures were not as high as expected.
Analysts interviewed by Wall Street Journal explained that big hedge funds and investment firms were studying the bitcoin market before entering their trades.
On the same day, WSJ reported that an unidentified trader or traders had placed a million dollar bet that bitcoin will trade at above $50,000 by the end of 2018.
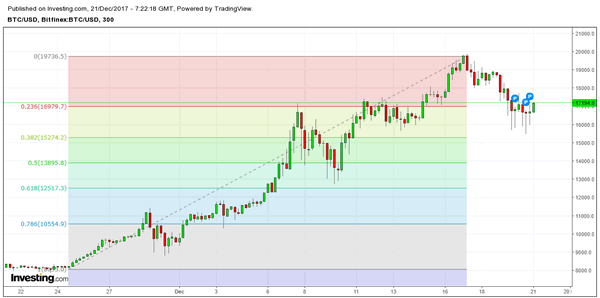
Because of the negative headlines, the prices of bitcoin fell from under $20,000 to find support slightly above the 38.2% Fibonacci retracement level and settling at the 23.6% level
Further, historically, bitcoin has experienced similar pullbacks when it hits a psychologically significant level. A few weeks ago when it hit the $10,000 level mark, it had a pullback to under $9,500 before resuming the upward trend. Also, historically, bitcoin has pulled back when there are reports of hacks in the exchanges.
Therefore, the current pullback can be taken as an ideal entry point for people bullish on bitcoins.
GBP/USD Candlesticks and Ichimoku Analysis
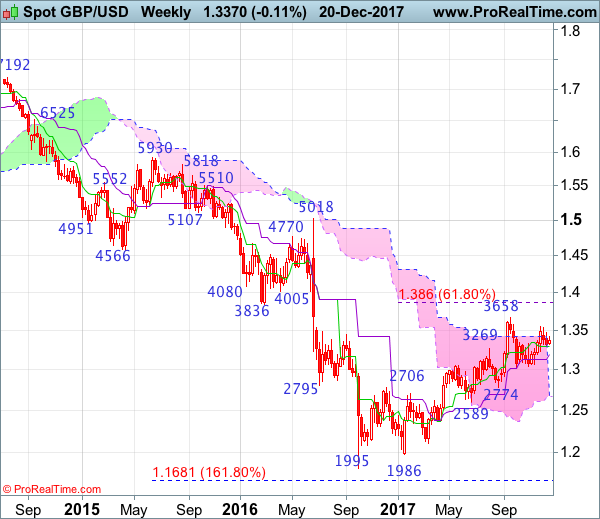
Weekly
• Last Candlesticks pattern: Shooting star
• Time of formation: 31 Jul 2017
• Trend bias: Down
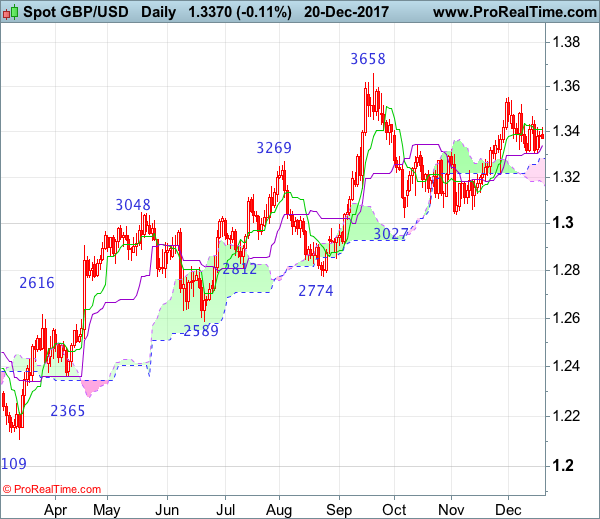
Daily
• Last Candlesticks pattern: Morning star
• Time of formation: 25 Aug 2017
• Trend bias: Near term up
GBP/USD – 1.3380
Although the British pound fell marginally to 1.3302 late last week, the subsequent rebound suggests further consolidation would b seen and test of 1.3420 cannot be ruled out, however, a daily close above resistance at 1.3466 is needed to signal the pullback from 1.3550 has ended and bring further gain to 1.3500, then retest of 1.3550. Only a break above this recent high would abort and signal the rise from 1.3027 has resumed instead, bring further subsequent headway to resistance at 1.3596, however, still reckon upside would be limited and price should falter below another previous chart resistance at 1.3658 (this year’s high).
On the downside, below 1.3330-35 would bring a retest of 1.3302, break there would extend the erratic decline from 1.3550 top for retracement o recent upmove to 1.3260-70, having said that,only a daily close below indicated support at 1.3221 retain bearishness, bring further fall to 1.3185-90 and later towards 1.3130 but sharp fall below there should not be repeated and price should stay above previous support at 1.3062.
Recommendation: Hold short entered at 1.3460 for 1.3260 with stop at break-even.
On the weekly chart, as sterling met resistance at 1.3466 last week and has retreated, retaining our bearishness and further consolidation below recent high at 1.3550 would be seen, hence mild downside bias remains for test of 1.3302 support, break there would add credence to our view that top has possibly been formed at 1.3550, bring further fall to support at 1.3221, once this level is penetrated, this would add credence to this view, bring further fall to 1.3130 and later towards strong support at 1.3062. Looking ahead, only a drop below 1.3027 support would revive bearishness and signal top has indeed been formed at 1.3658, bring a stronger correction of early rise to 1.3000, then towards support at 1.2909.
On the upside, expect recovery to be limited and said resistance at 1.3466 should hold, bring another retreat later. Above recent high at 1.3550 would shift risk back to the upside and extend the rise from 1.3027 to 1.3600, then test of last month’s high at 1.3658, break there would confirm medium term rise from 1.1986 low has resumed for headway to 1.3750-60 and 1.3800 but anticipated overbought condition should prevent sharp move beyond 1.3860 (61.8% Fibonacci retracement of 1.5018-1.1986).
NZDUSD Consolidates After Bullish Move
NZDUSD is neutral in the short-term after a bullish move from the 0.6800 handle. The trend signals on the 4-hour chart are bullish, defined by a crossover of the 50 SMA above the 200 SMA. The market has now entered a consolidation phase after rising to its highest level since October 20 last Friday at 0.7033.
NZDUSD is expected to find support on dips at some key Fibonacci retracement levels of the recent upleg from 0.6827 to 0.7033. Immediate support is now at 0.6984 (23.6% Fibonacci) followed by 0.6954 (38.2% Fibonacci).
A deeper retracement will risk eliminating the short term bullish outlook but as long as the market remains above the key 0.6900 level there is room for an extension above the 0.7033 peak towards the key 0.7100 area.
A clear break above the December 15 high would indicate the market has clearly moved into a bullish phase. For now, more range-trading is expected as the RSI has turned neutral and upside momentum has faded.
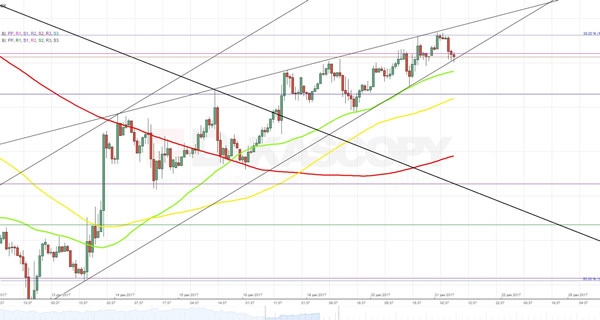
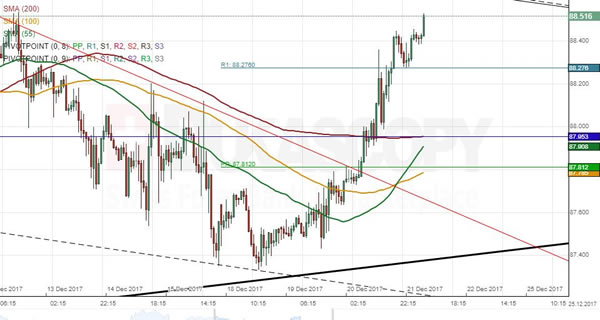
CAD/JPY 1H Chart: Pair Points To Weakness
The Canadian Dollar has been trading in a channel up against the Japanese Yen during the past nine months. After testing the upper boundary mid-September, the Loonie began its way towards the southern side, thus forming a junior channel in the opposing direction. The senior pattern was reached on November 29 and re-tested once again on Tuesday. As apparent on the chart, the Loonie has strengthened significantly during the past sessions. As a result, it breached a trend-line (in red) and dashed through several significant resistance levels. There is still some slight upside potential until the 88.60 area. The base scenario, however, favours a subsequent reversal from the junior channel and a period of decline. It is likely that bears prevail until the 55-, 100– and 200-hour SMAs are reached circa 87.80.
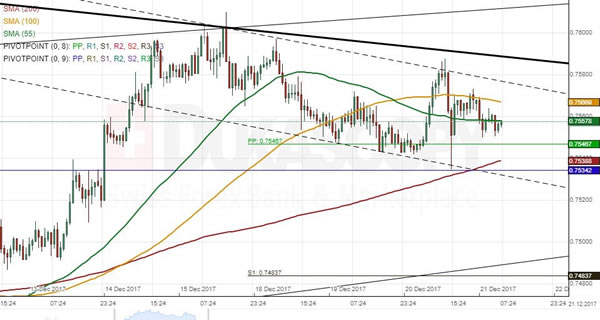
AUD/CHF 1H Chart: Aussie Likely To Test Long-Term Channel
AUD/CHF has been guided by a descending channel since early September. This pattern has had several confirmations on the southern side, while the second upper confirmation was provided last week when the Aussie reversed from the 0.76 mark. The rate, however, did not go far, as it continued to trade along the upper boundary of this long-term pattern. It is unlikely that its southern boundary is tested one more time due to the significant steepness downwards. Technical indicators suggest that the rate could enter a period of consolidation during the following week, supported by the monthly PP and the 200-hour SMA. It is likely that this movement results in an upside breakout and a subsequent surge. On the other hand, the pair might also edge lower in line with two prevailing junior channels. In this case, the downside target is the 0.7520/30 area.
Technical Outlook: AUDUSD – Double Doji Signals Recovery Stall, Falling Daily Cloud Continues To Weigh
The Aussie dollar remains directionless and trading within narrowing range capped under 200SMA.
Doji candles on Tue / Wed signal strong indecision, after recovery rally from 0.7500 stalled under key barriers.
Increasing signs of reversal are building on daily chart as falling thick daily cloud continues to weigh (cloud base lies at 0.7689 today).
Initial reversal signal will be generated on break below 0.7637 (congestion floor) with confirmation seen on sustained break below 0.7620/00 support zone (Fibo 38.2% of 0.7500/0.7694 upleg / converged daily Tenkan-sen / Kijun-sen).
Conversely, eventual penetration and close in the cloud will be bullish signal.
Res: 0.7692, 0.7729, 0.7738, 0.7787
Sup: 0.7653, 0.7637, 0.7620, 0.7597
Elliott Wave View: SPX
SPX Short term Elliott Wave view suggests that the rally to 2664.58 ended Minor wave 1 as a Leading diagonal. Below from there Minor wave 2 ended as a zigzag correction at 2624.19 low, above from there Minor wave 3 remains in progress as a double correction and showing the incomplete bullish sequence to the upside. The Minutte wave (a) of ((w)) ended in 5 waves at 2671.92 high, where internals of that leg Subminutte wave i ended at 2633.72, Subminutte wave ii ended at 2626.32 low, Subminutte wave iii ended at 2669.68, Subminutte wave iv ended at 2663.68 and Subminutte wave v of (a) ended at 2671.92 peak. Below from there, it ended the Minutte wave (b) 2651.78 low, above from there Minutte wave (c) of ((w)) ended in another 5 waves at 2695.38 peak and also ended the cycle from 12/06 low 2624.19 there.
Currently, the index could have finished correcting the cycle from 12/06 low in 3 waves at yesterday's low 2675.72 in Minute wave ((x)) pullback, where Minutte wave (a) ended at 2680.28, Minutte wave (b) ended at 2691.38. After reaching the Green box (potential buying area) 2676.19-2667.16 100%-161.8% Fibonacci extension area. While above 2675.72 low and more importantly the pivot from 12/06 low 2624.19 stays intact index can resume the upside in Minute ((y)) leg higher within wave 3. However, the index still needs to show some more separation from the 2675.72 lows to avoid the further correction lower in 7 or 11 swings to happen before index resumes higher again. We like staying long from yesterday's dip with the risk-free position but if it does the double correction lower and corrects further lower, we would like to be buyer's again at the next Green box area in 7 or 11 swings provided the pivot at 2624.19 low remains intact.
SPX 1 Hour Elliott Wave Chart
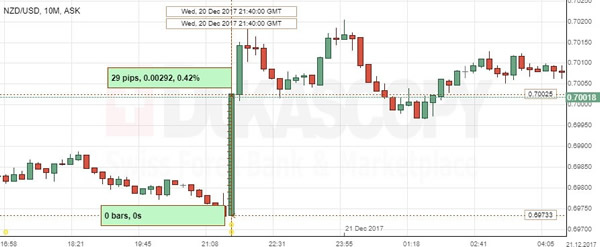
NZD/USD: NZ Gross Domestic Product
The Kiwi rose markedly against the US Dollar on the report showing the New Zealand's economic momentum accelerating in the September quarter. The NZD/USD currency pair strengthened 0.42% or 29 base points to 0.7002, trying to remain above the 0.7000 level.
The New Zealand's economy marked the better-than-anticipated annual growth pace of 2.7% in the Q3. Meanwhile, the quarterly expansion eased to 0.6% in the same period, following an upwardly revised 1.0% gain in the prior quarter. However, downturns in some sectors indicated to a muted outlook than the country's new government would prefer. The report provided the reason for the RBNZ to keep interest rates unchanged at a record low as the inflation pulse remained weak.
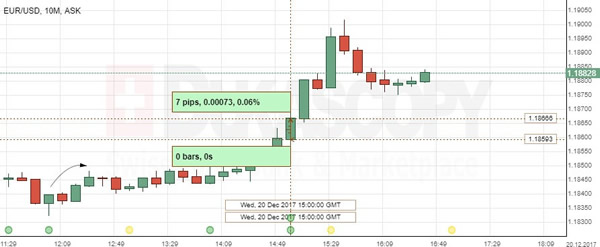
EUR/USD: US Existing Home Sales
The EUR/USD currency pair continued to appreciate on the better-than-expected data on home sales in the US. The Greenback lost 7 base points against the Euro to keep strengthening further to the 1.1895 area.
The US home sales rose more than anticipated in November to reach the highest level in 11 years, indicating that the property market growth started to regain momentum after procrastination for the most of the year. The National Association of Realtors stated that the country’s exciting home sales increased 5.6% to a seasonally adjusted yearly rate of 5.81M units due to lingering recovery of hurricanes-hurt areas. However, the market activity remained constrained by a shortage of available properties, which kept prices elevated.
USD/JPY Analysis: Ready To Bounce Off From Weekly R1
Despite existence of a rising wedge pattern, the Dollar continued to actively appreciate against the Yen. However, it does not mean that the figure was broken, as it simply needs boundaries’ readjustment. Once this is done it appears that the breaking point matches with the weekly R1 located at the 113.57 level. From this perspective, the pair should pull back to the opposite side of an ascending channel near 113.30. However, a release of information on the American Final GDP might result in further strengthening of the buck. In that case, the pair would need to test an alleged resistance zone located around the 113.70 mark. Apart from that, it faces no notable barriers from northern side.