
Sample Category Title
EUR/USD Surges To 1.1850
Despite the fact that tax bill passed through the House, the currency exchange rate continued to move upwards and ended the day in the previously specified resistance zone located around the 1.1845 level.
The further advance of Euro is possible, even though it is unlikely to exceed the 1.1860 mark, as this area represents location of the upper-boundary of a one-month long descending channel.
A plunge below the monthly PP at 1.1806 is also doubtful, as it is additionally secured by the rising 55-, 100- and 200-hour SMAs.
On the other hand, there is a need to take into account that there are scheduled no fundamental events for today except for the final vote in Senate.
Unless the Congress sorts this issue out the fall of the rate may not even exceed the 50% Fibonacci retracement level at 1.1825.
GBP/USD Forms New Triangle
Yesterday's plunge to the 1.3330 level with the subsequent return to the 1.3400 mark points out that fluctuations of the cable are framed by the minor symmetrical triangle pattern.
Theoretically, a combination of the weekly and monthly PP strengthened by the 55-hour SMA should a necessary support for a breakout to the top. However, previous trading session showed that traders are rather neglecting these technical indicators.
Accordingly, these ups and downs are likely to continue until the pair an impulse from some fundamental event, such as final adoption of tax reform by the Congress. In support of this assumption, the pending orders in 100-pip range are equally split between buys and sells.
USD/JPY Tests Resistance Zone Near 113.10
In the middle of previous trading session, the currency exchange rate made a confident breakout from a symmetrical triangle pattern. In accordance with expectations, the surge was stopped in resistance zone formed by the 200-hour SMA and the 50% Fibonacci retracement level located at 113.00.
An allocation of pending orders suggests that markets are eager to see further appreciation of the Dollar against Yen. A successful vote on tax bill later this day theoretically might throw the rate straight to the weekly R1 at 113.57.
However, until that the currency pair is expected to continue slowly climbing to the top in a little rising wedge formation. By the way, if assumption about this pattern is correct, then the rate might plunge back to support zone located around the monthly PP at 112.70.
XAU/USD Heads Towards Weekly R1
In result of the previous trading session, the pair made a breakout from rising wedge pattern that formed at the intersection of two junior ascending channels.
Surprisingly, but traders did not show much interest to release of the American housing data or successful vote in the House. Accordingly, the exchange rate continues to slowly climb towards the weekly R1 located at the 1,266.05 level.
A major recovery of the buck even in case of adoption of tax bill by the Senate looks doubtful, as the southern side is reliably covered by the monthly S1, the 55- and 100-hour SMAs plus the lower boundary of one of the above channels.
On the other hand, a serious appreciation of the bullion is also uncertain due to resistance posed the 38.2% Fibonacci retracement level at 1,268.00.
EUR/USD: German Ifo Business Climate
The Euro revealed a deceptive increase against the Greenback on Germany's business climate data. The EUR/USD exchange rate added 4 base points to the 1.1809 mark and continued the session to continued being magnetized to the 1.1820 area.
German business sentiment fell unexpectedly this month after reaching an all-time high in November, a survey revealed on Tuesday, indicating the political deadlock in the country was clouding the outlook. The Munich-based Institute for Economic Research Ifo reported that Germany's business confidence dropped to 117.2. However, experts warned of not over-interpreting the decline, as it could be difficult to anticipate better business conditions.
USD/JPY: US Building Permits
The US Dollar kept strengthening against the Japanese Yen on the US property market data and current account report. The USD/JPY currency pair rose modestly to the 112.76, targeting the weekly high at around 113.20.
The US single-family housing starts and building permits increased to the ten-year highs in November, providing a hopeful sign for the real estate market that was hindered by supply constraints. The Commerce Department stated that in overall building permits were at a 1.298M unit rate in November, being put slightly down by a weaker permits for multi-family houses' construction. However, an increase in groundbreaking singe-family homes could contribute to GDP in the Q4.
Technical Outlook: AUDUSD – Falling Daily Cloud Continues To Weigh
The Aussie dollar ticked higher on Wednesday but remains within extended congestion, capped by 200SMA (0.7692).
Falling daily cloud continues to weigh (cloud base lies at 0.7690) and risk of reversal will remain in play while recovery action is limited by the cloud.
Pivotal supports lay at 0.7637 (congestion floor) and 0.7620 (Fibo 38.2% of 0.7500/0.7694) and break lower would generate stronger bearish signal, while penetration of daily cloud will be bullish signal for extension towards next pivot at 0.7738 (Fibo 38.2% of 0.8124/0.7500 descend), break of which would signal bullish continuation of recovery leg from 0.7500.
Res: 0.7692, 0.7729, 0.7738, 0.7787
Sup: 0.7651, 0.7637, 0.7620, 0.7597
Elliott Wave View: SPX
SPX Short term Elliott Wave view suggests that the rally to 2664.58 ended Minor wave 1 as a Leading diagonal. Below from there Minor wave 2 ended as a zigzag correction at 2625.22 low, above from there Minor wave 3 remains in progress as a zigzag structure and showing the incomplete bullish sequence to the upside. The Minute wave ((a)) ended in 5 waves at 2671.92 high, where internal Minutte wave (i) ended at 2633.72, Minutte wave (ii) ended at 2626.32 low, Minutte wave (iii) ended at 2669.68, Minutte wave (iv) ended at 2663.68 and Minutte wave (v) of ((a)) ended at 2671.92 peak.
Then it ended the Minute wave ((b)) pullback ended at 2651.92 low as a flat structure and above from there Minute wave ((c)) of 3 remain in progress. Where Minutte wave (i) of ((c)) ended at 2695.38 on 12/18 peak as a zigzag, below from there index is correcting 12/14 2651.92 lower cycle as a double correction in Minutte wave (ii) of ((c)) dip. And the area in between 2673.73-2662.52 50-76.4% Fibonacci retracement area is expected to end the correction against 12/14 cycle. Then as far as a pivot from 12/14 low stays intact index is expected to resume higher from 2673.73-2662.52 area or should do a 3 wave bounce at least. We don’t like selling the index and favor buying the Minutte wave (ii) dip from the Green box area for a 3 wave bounce at least.
SPX 1 Hour Elliott Wave Chart
Forex Technical Analysis: EUR/USD, USD/JPY, GBP/USD
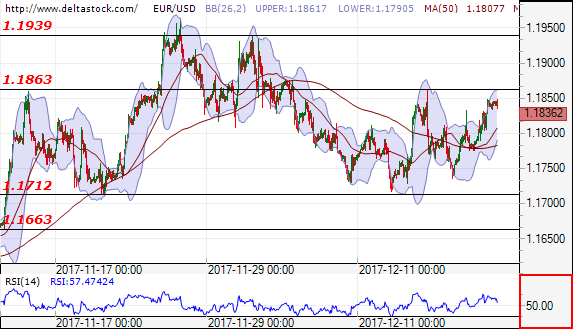
EUR/USD
Current level - 1.1836
The currency pair is before a test of the resistance level at 1.1863. A breakthrough of that level may lead to increase of the price up to 1.1939. In negative direction the support level is at 1.1712
| Resistance | Support | ||
| intraday | intraweek | intraday | intraweek |
| 1.1863 | 1.1939 | 1.1712 | 1.1663 |
| 1.1939 | 1.2090 | 1.1712 | 1.1550 |
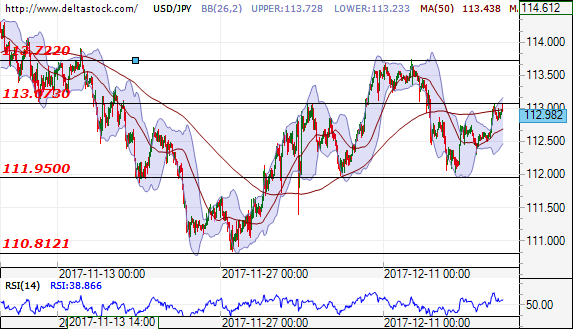
USD/JPY
Current level - 112.98
The outlook is negative for test of the support level at 111.95. In positive direction a successful breakthrough of the resistance level at 113.00 may lead to a test of the resistance at 113.72.
| Resistance | Support | ||
| intraday | intraweek | intraday | intraweek |
| 113.13 | 113.90 | 111.90 | 109.50 |
| 113.90 | 114.50 | 110.80 | 107.30 |
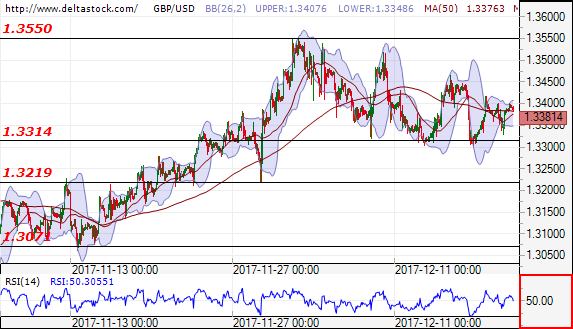
GBP/USD
Current level - 1.3381
A breakthrough of the support level at 1.3314, may lead to downtrend and test of the next support level at 1.3219. In positive direction the resistance levels are at 1.3550 and after that at 1.3630.
| Resistance | Support | ||
| intraday | intraweek | intraday | intraweek |
| 1.3550 | 1.3660 | 1.3314 | 1.3220 |
| 1.3550 | 1.3660 | 1.3220 | 1.3070 |
US Tax Bill To Be Ratified, Japanese Equities At Multi-Decade High
Here are the latest developments in global markets:
FOREX: The dollar was not much changed versus a basket of currencies as markets awaited the House of Representatives to cast a final vote in favor of tax reforms later today. The euro was roughly flat after receiving a lift from higher German bond yields.
STOCKS: The Nikkei 225 closed 0.1% higher and the Topix added 0.3% to finish at its highest since late 1991. The Hang Seng was down by 0.1%. Euro Stoxx 50 futures traded 0.1% up at 0727 GMT, with contracts on the Dow, S&P 500 and Nasdaq 100 all being up by 0.2%.
COMMODITIES: Tuesday’s API report showing an unexpected decline in US crude stockpiles supported oil prices. WTI and Brent crude were both higher by 0.3%, at $57.74 and $63.97 per barrel respectively. Gold traded up by 0.1% at $1263.61 an ounce, around two-week high levels.
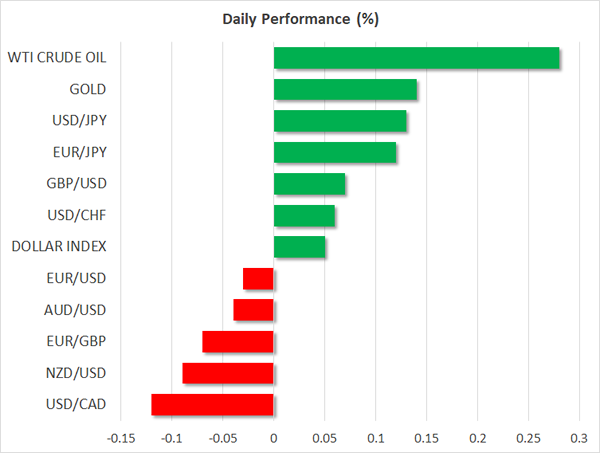
Major movers: Little movement as US House set to cast final vote on tax bill
The dollar index was 0.1% up at 93.52 49 after retreating the two previous days, with expectations that congress would today ratify tax reforms providing some support to the US currency. Both the House and Senate approved the tax bill though due to procedural issues the former would need to revote later in the day. Interestingly, the greenback didn’t get much of a boost from long-term Treasure yields rising to their highest in nearly two months.
Dollar/yen was 0.1% higher, trading at the 113 handle and not far below a one-week high hit earlier in the day. The Bank of Japan will tomorrow be completing its two-day meeting on monetary policy.
Euro/dollar was little changed after being boosted by an increase in German bond yields following the eurozone’s largest economy revealing plans to issue more 30-year bonds over the coming year. The pair traded at 1.1836.
Pound/dollar was up by less than 0.1% at 1.3389, while the antipodeans which posted hefty gains relative to the greenback in the week that preceded, were both down, though not by much. Aussie/dollar was at 0.7662 and kiwi/dollar traded at 0.6970.
Day ahead: House Republicans back to vote on taxes; New Zealand GDP growth expected to slow
The US tax story will remain among the top headlines on Wednesday after the House of Representatives approved the bill on Tuesday but procedural issues render it necessary for the House to vote for a second time today.
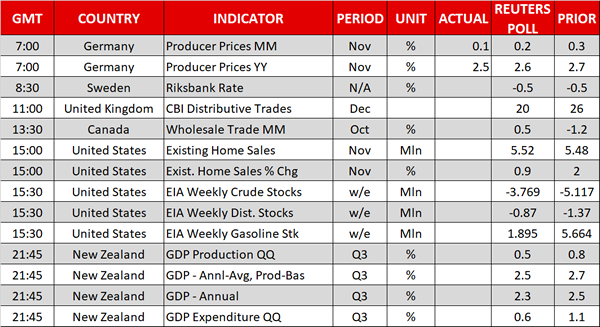
Meanwhile, the National Association of Realtors will release data on US existing home sales at 1500 GMT and the Energy Information Administration (EIA) will publish weekly readings on US crude oil stocks at 1530 GMT.
According to forecasts, residential buildings sold in the previous month are expected to inch up by 0.06 million to 5.54 million in November, with the monthly percentage change tumbling to 0.9% from the 2.0% seen in October.
Looking at the EIA report, US crude inventories and distillate stocks are said to continue falling but at a slower pace in the week ending December 15. However, gasoline inventories are anticipated to rise for the sixth consecutive week.
In Canada, October’s wholesale sales will be available at 1330 GMT. After a deep fall of 1.2% in September, the measure is now expected to increase by 0.5% m/m.
Elsewhere, New Zealand will reveal GDP growth figures for the third quarter at 2145 GMT, with analysts projecting the economy to expand by 2.3% y/y compared to 2.5% in the previous quarter. On a quarterly basis GDP growth is anticipated to slow down by 0.3 percentage points relative to the previous quarter to 0.5%.
Regarding central bankers making appearances, the BOE chief, Mark Carney is scheduled to discuss on the November’s financial stability report at 1315 GMT.
The Swedish central bank will hold a press conference unveiling it decision on interest rates at 0830 GMT.
Technical Analysis: EURUSD exhibiting bullish signals in short-term
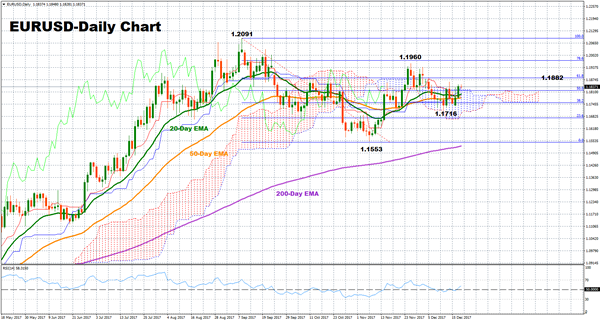
EURUSD is currently consolidating slightly above the Ichimoku cloud but the bullish cross between the 20 and the 50-day exponential moving average lines as well as the RSI starting to move up – a potential early sign of positive momentum – hint that upside movements are more likely to occur in the near-term. However, it should be stated that any subsequent increases could be softer in nature as the RSI is pointing to the downside in lower timeframes.
Should the pair head up, the 61.8% Fibonacci at 1.1882 of the dowleg from 1.2091 to 1.1553 could act as a barrier. Further above, a previous top at 1.1960 would come into view.
To the downside, the 50% Fibonacci mark at 1.1817 could provide immediate support – notice that the area around this level also encapsulates the current levels of the 20- and 50- day EMAs. Further below, the focus would shift to a previous bottom at 1.1716. A close below this level would shift the bias to bearish.