Sample Category Title
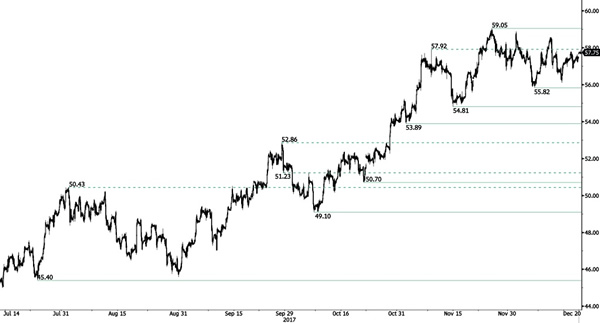
CRUDE OIL Volatility Continues To Decline
Crude oil is has failed to break resistance given at 59.05 (24/12/2017 high). Support is given at 55.82 (07/12/2017 low). As volatility declines, expected to show further bearish breakout.
In the long-term, crude oil has recovered after its sharp decline last year. However, we consider that further weakness are very likely. For the time being the pair lies in an upside momentum. Strong support lies at 35.24 (05/04/2016) while resistance can now be found at 55.24 (03/01/2017 high).
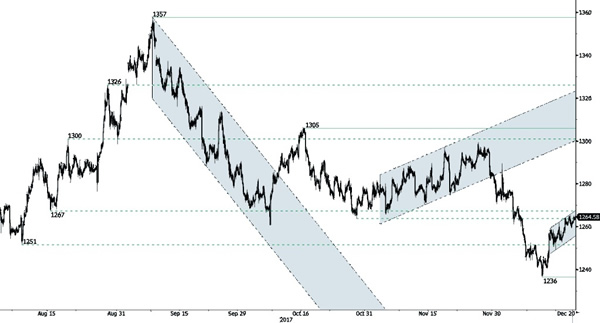
GOLD Starting A New Bullish Momentum
Gold is consolidating after the strong collapse even though traders are taking some profit. Hourly support is given at 1236 (12/12/2017 low) . Resistance is located at 1259 (14/12/2017).
In the long-term, the technical structure suggests that there is a growing upside momentum. A break of 1392 (17/03/2014) is necessary ton confirm it, A major support can be found at 1045 (05/02/2010 low).
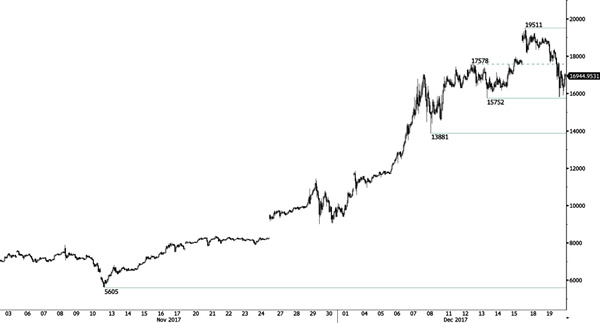
BITCOIN Strong Decline
Bitcoin's bullish momentum is far fom over despite strong retracement. The technical structure has shown a tremendous positive short-term momentum. Hourly support is located at 15'752 (13/12/2017 low). In the short-term, the digital currency should continue rising towards levels unseen so far.
In the long-term, the digital currency has had an exponential growth. There are decent likelihood that the asset will reach $40'000 in 2018.
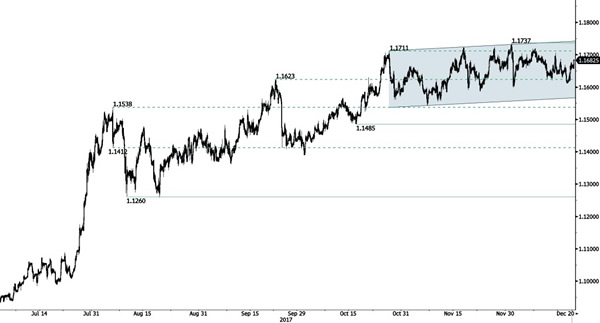
EUR/CHF Slow Increase
EUR/CHF is trading slightly higher. Hourly resistance is given at 1.1737 (01/12/2017 high). Expected to show continued short-term increase.
In the longer term, the technical structure has reversed. Strong resistance is given at 1.20 (level before the unpeg). Yet, the ECB's QE programme is likely to cause persistent selling pressures on the euro, which should weigh on EUR/CHF. Supports can be found at 1.0184 (28/01/2015 low) and 1.0082 (27/01/2015 low).
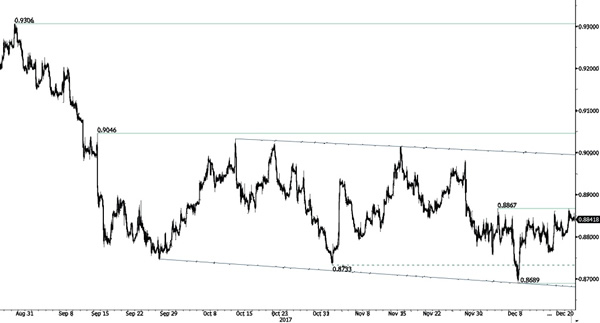
EUR/GBP Sideways Price Action
EUR/GBP is trading slightly lower. The pair is trading between support at 0.8689 (08/12/2017 low). Resistance is located at 0.8867 (05/12/2017 high). Expected to show further sideways trading.
In the long-term, the pair has largely recovered from recent lows in 2015. The technical structure suggests a growing upside momentum. The pair is trading above from its 200 DMA. Strong resistance can be found at 0.9500 (psychological level).
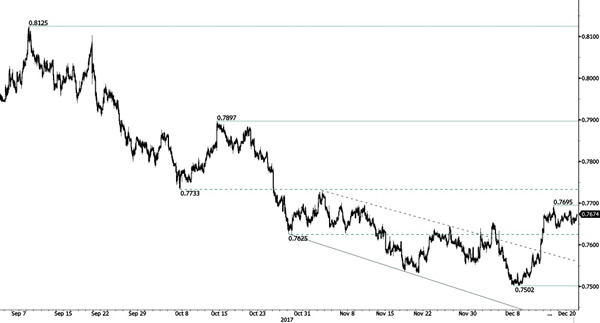
AUD/USD Consolidating Below 0.77
AUD/USD's upside pressures are growing. Hourly resistance is given at a distance at 0.7695 (15/12/2017 high). Support stands at 0.7502 (08/12/2017 low). Expected to push even higher.
In the long-term, the trend is turning positive. Key supports stands at 0.6009 (31/10/2008 low) . A break of the key resistance at 0.8164 (14/05/2015 high) is needed to invalidate our long-term bearish view.
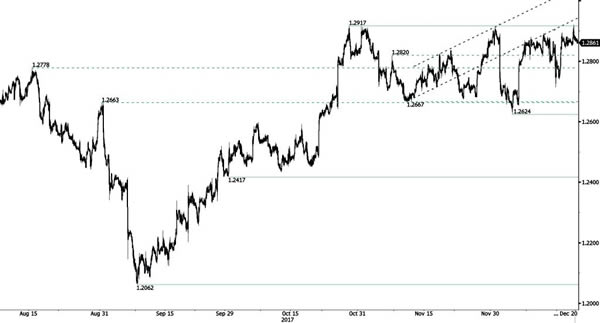
USD/CAD Stalling Below 1.29
USD/CAD is testing hourly resistance at 1.2917 (27/10/2017 high). Expected to show continued buying pressures.
In the longer term, the pair has broken longterm support that can be found at 1.2461 (16/03/2015 low). Strong resistance is given at 1.4690 (22/01/2016 high). The pair is likely to head further lower.
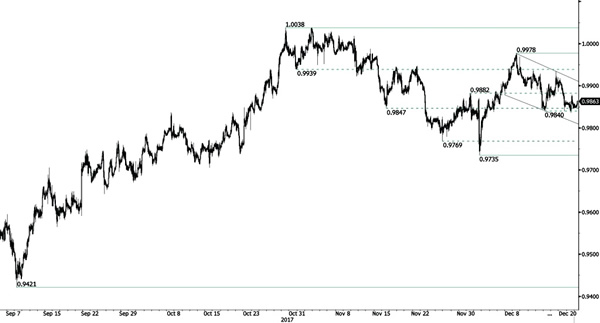
USD/CHF Riding Downtrend Channel
USD/CHF is trading lower. Yet, the technical structure indicates further downside risks. The pair has failed to hold consistently above the parity. Expected to go even lower.
In the long-term, the pair is still trading in range since 2011 despite some turmoil when the SNB unpegged the CHF. Key support can be found 0.8986 (30/01/2015 low). The technical structure favours nonetheless a long term bullish bias since the unpeg in January 2015.
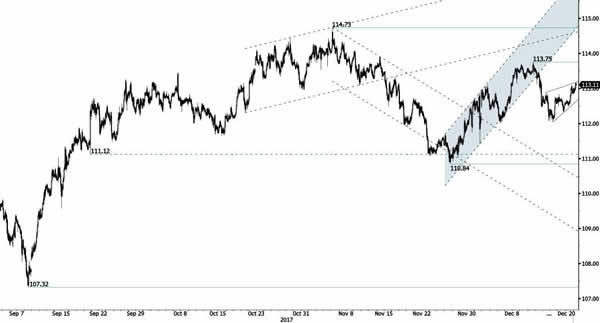
USD/JPY Pushing Higher
USD/JPY's buying demand is increasing. Hourly resistance is given at 113.75 (12/12/2017 high) while hourly support is given at 112.03 (15/12/2017 low). The technical structure suggests continued increase.
We favor a long-term bearish bias. Support is now given at 99.02 (10/08/2013 low). A gradual rise towards the major resistance at 125.86 (05/06/2015 high) seems unlikely. Expected to decline further support at 93.79 (13/06/2013 low).
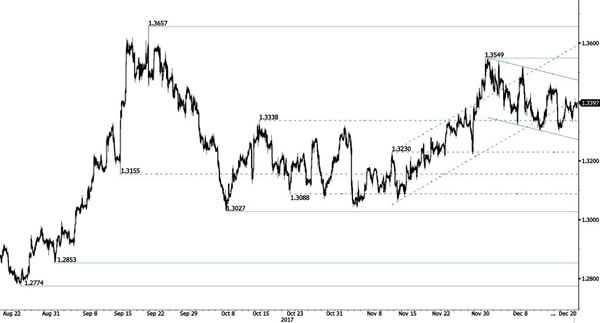
GBP/USD Riding Short-Term Downtrend Channel
GBP/USD continues to move lower within downtrend short-term channel. The technical structure indicates further weakness. Support is given at a distance at 1.3302 (15/12/2017 low).
The long-term technical pattern is reversing. The Brexit vote had paved the way for further decline. Long-term support can be found at 1.1841 (07/10/2017 low). Long-term resistance given around 1.35 is at stake and indicates a long-term reversal in the negative trend. Yet, it is very unlikely at the moment.