Sample Category Title
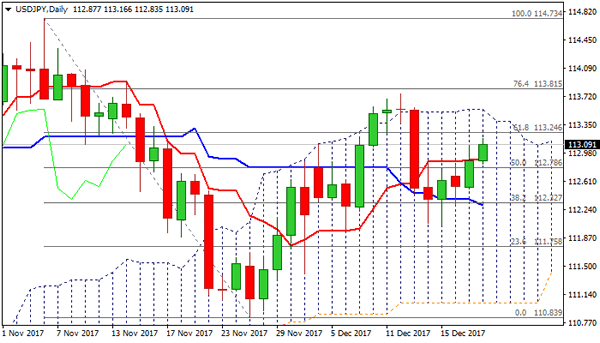
Technical Outlook: USDJPY – Fresh Bullish Extension Probes Above 113.00
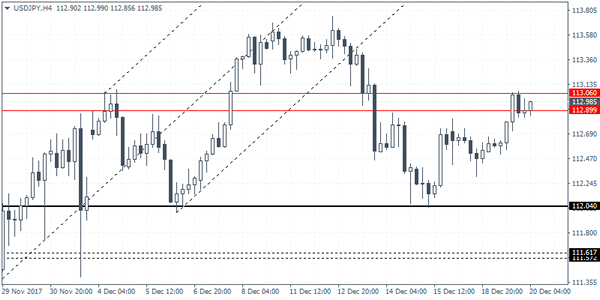
The pair extends recovery above 113.00 on Wednesday, following eventual break above three-day consolidation range top which signaled extension of recovery leg from 112.02 (15 Dec low). Today's fresh extension higher probed above 113.09 pivot (Fibo 61.8% of 113.74/112.02), with close above here to generate bullish signal for test of key barriers at 113.55 (daily cloud top) and 113.74 (12 Dec top). Broken 55SMA holds today's action and marks key near-term support at 112.85.
Res: 113.24, 113.55, 113.74, 114.00
Sup: 112.97, 112.85, 112.57, 112.43
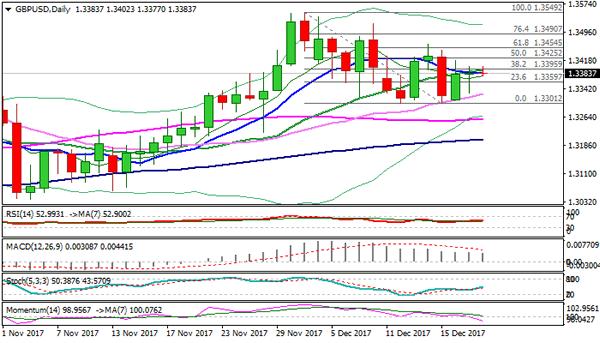
Technical Outlook: GBPUSD – Repeated Failures At 1.3395 Fibo Barrier Would Keep The Downside At Risk
Cable is holding within narrow range in early Wednesday's trading but upside remains limited at 1.3400 (Tue/today's session highs), as near-term bulls repeatedly failed to close above cracked 1.3395 pivot (Fibo 38.2% of 1.3549/1.3301 downleg) Tuesday's action ended in long-tailed Doji candle and signaling indecision of recovery rally from 1.3300 base. Near-term action remains underpinned by thickening and rising daily cloud but daily studies show loss of momentum which could signal recovery stall. The downside is expected to remain vulnerable if the price stays below pivots at 1.3395/1.3410 (Fibo 38.2%/daily Tenkan-sen) and risk pullback to rising daily 30SMA (1.3327) which also underpins near-term action. Sustained break above 1.3410 would open way for bullish continuation towards 1.3454/64 (Fibo 61.8% of 1.3549/1.3301/14 Dec high) which mark next pivotal points for 1.3500+ extension.
Res: 1.3395, 1.3410, 1.3425, 1.3454
Sup: 1.3360, 1.3340, 1.3327, 1.3300
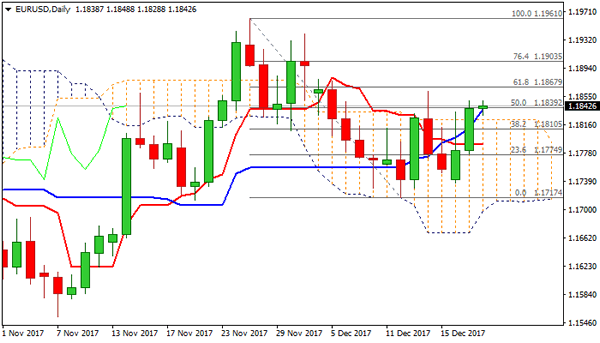
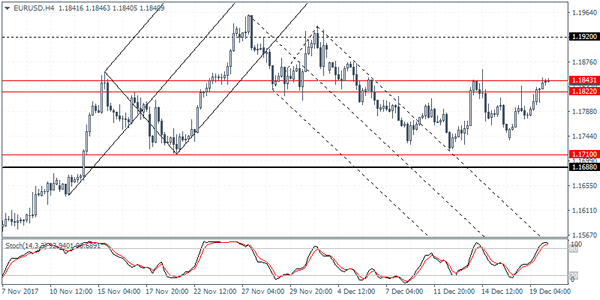
Technical Outlook: EURUSD – Bulls Eye Fibo Barriers At 1.1867/1.1900 After Closing Above Daily Cloud
The Euro is consolidating under fresh weekly high at 1.1848 after strong rally on Tuesday eventually broke and closed above daily cloud, generating bullish signal.
Cloud top now acts as support, with daily MA’s in bullish setup and slow stochastic heading north and signaling room for extension towards Fibo barriers at 1.1867 (Fibo 61.8% of 1.1961/1.1717) and 1.1900 (Fibo 76.4%).
Sustained break above 1.1900 would open way for full retracement of 1.1961/1.1717 downleg.
Daily cloud top should ideally keep the downside protected, however, deeper corrective attempts are expected to hold above 1.1800 handle (broken 100SMA) to keep bulls in play.
Res: 1.1848, 1.1867, 1.1900, 1.1940
Sup: 1.1823, 1.1800, 1.1786, 1.1762
GBP/USD Elliott Wave Analysis
GBP/USD – 1.3394
As cable met resistance at 1.3466 and retreated again, retaining our bearishness and as long as this level holds, mild downside bias remains for another test of 1.3302 support, break there would extend the erratic fall from 1.3550 to 1.3470, however, a break of indicated support at 1.3221 is needed to signal top has been formed at 1.3550, bring further fall to 1.3200, then towards 1.3150-55. later.
Our preferred count on the daily chart is that cable's rebound from 1.3500 (wave (A) trough) is unfolding as a wave (B) with A ended at 1.7043, followed by triangle wave B and wave C as well as wave (B) has possibly ended at 1.7192, below support at 1.4232 would add credence to this count, then further fall to 1.4000 level would follow but reckon downside would be limited to 1.3655 support and price should stay above previous support at 1.3500.
On the upside, whilst initial recovery cannot be rude out, reckon 1.3430-40 would limit upside and bring another decline later. Above said resistance at 1.3466 would defer and risk a stronger rebound to 1.3521 but break there is needed to signal the pullback from 1.3550 has ended, bring retest of this level, break there would signal the rise from 1.3027 has resumed for gain to 1.3595-00 but break there is needed to confirm early upmove has resumed for retest of 1.3658 resistance first.
Recommendation: Hold short entered at 1.3470 for 1.3270 with stop lowered to break-even.
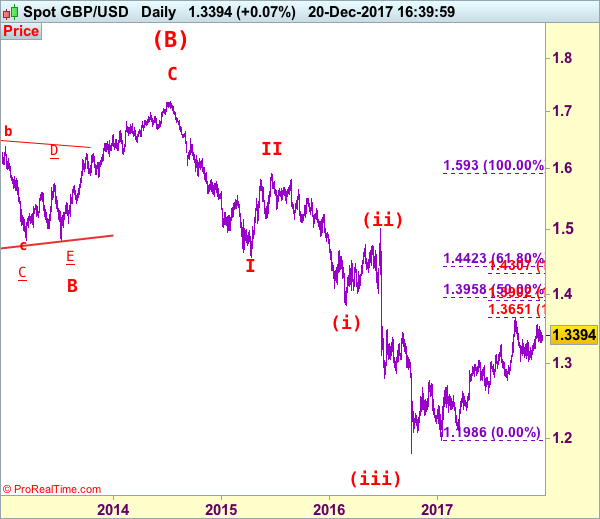
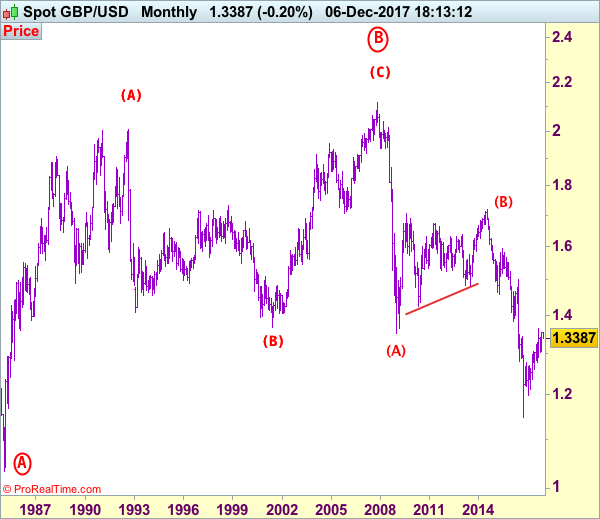
Longer term - Cable's rise from 1.0520 (Feb 1985) to 2.0100 (September 1992) is seen as [A], the decline to 1.3682 is labeled as (B) and (C) wave rally has ended at 2.1162 (9 Nov, 2007) which is also the top of larger degree wave B with circle. The selloff from there is a 5-waver with wave (A) ended at 1.3500 (23 Jan 2009), wave (B) itself is labeled as A: 1.6733, triangle wave B: 1.4813 and wave C as well as top of wave (B) ended at 1.7192 (2014), hence the selloff from there is an impulsive wave (C) with wave I : 1.4566, wave II 1.5930, an extended wave III is unfolding and already exceeded our downside target at 1.3500 and 1.3000, hence weakness to 1.2500 and possibly 1.2000 cannot be ruled out, however, price should stay well above psychological level at 1.0000.
Trade Idea: AUD/USD – Buy at 0.7605
AUD/USD – 0.7670
Original strategy:
Buy at 0.7605, Target: 0.7805, Stop: 0.7545
Position: -
Target: -
Stop:-
New strategy :
Buy at 0.7605, Target: 0.7805, Stop: 0.7545
Position: -
Target: -
Stop:-
As aussie has maintained a firm under one after staging a strong rebound to 0.7695, adding credence to our view that a temporary low has been formed at 0.7501 and consolidation with upside bias remains for at least a retracement of recent decline to 0.7700, then towards resistance at 0.7730, above there would encourage for subsequent headway to 0.7800-05 which is likely to hold from here due to near term overbought condition.
In view of this, would not chase this rise here and we are looking to buy aussie on pullback as 0.7600-05 should limit downside and bring another rally. Below previous resistance at 0.7580 would defer and risk weakness to 0.7550-55 but price should stay well above said support at 0.7501, bring another strong rebound later this month.
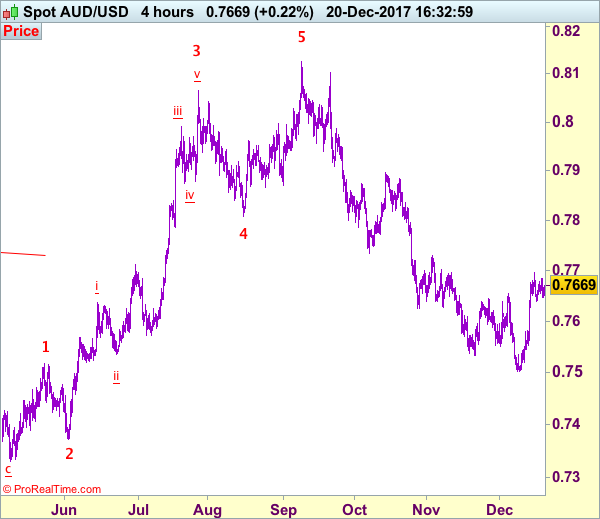
On the 4-hour chart, recent upmove from 0.7329 is unfolding as an impulsive rise with wave 3 as well as smaller degree wave (iii) extending, only minor wave v of (iii) has ended at 0.8125, hence bullishness remains for this move to extend headway to 0.8200, then towards 0.8300, however, reckon upside would be limited to 0.8400 and the final wave 5 should falter below 0.8500, bring correction later.
NZDUSD Intraday Analysis
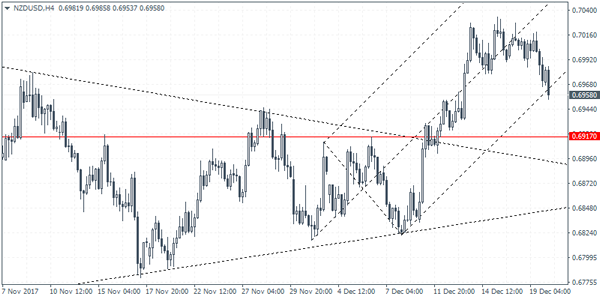
NZDUSD (0.6958): The New Zealand dollar was seen declining for the second day as price action failed to reach the 0.70 handle. The declines could see the kiwi dollar falling back to the 0.6917 level where support could be established. Forming support at this level could signal a new leg in the rally to the upside. However, failure to hold the declines could signal further losses in the NZDUSD. The next lower support is formed at 0.6841.
USDJPY Intraday Analysis
USDJPY (112.98): The U.S. dollar was seen trading stronger against the Japanese yen with price managing to close at a four-day high yesterday. On the intraday charts, price action is back at the resistance level of 113.00 - 112.90 region. A reversal at this level could potentially put USDJPY back within the range. Support is seen at 112.04 level. However, in the event of a breakout above the resistance level, further gains to 114.00 can be expected. A pullback to the breached resistance level to form support could establish more upside bias in price.
USD/CHF Candlesticks and Ichimoku Analysis
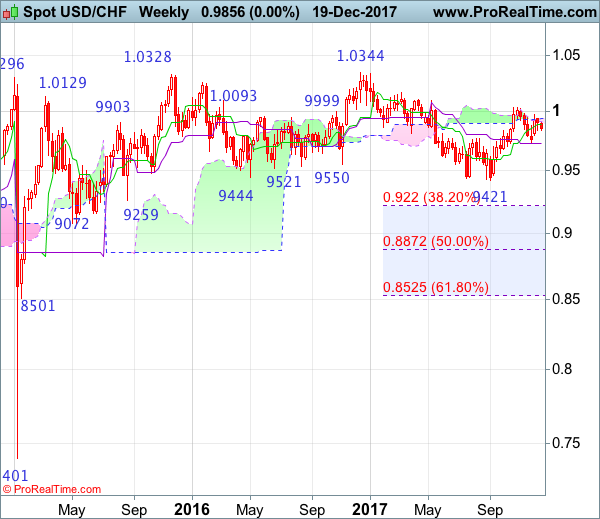
Weekly
• Last Candlesticks pattern: Shooting star
• Time of formation: 7 Mar 2017
• Trend bias: Sideways
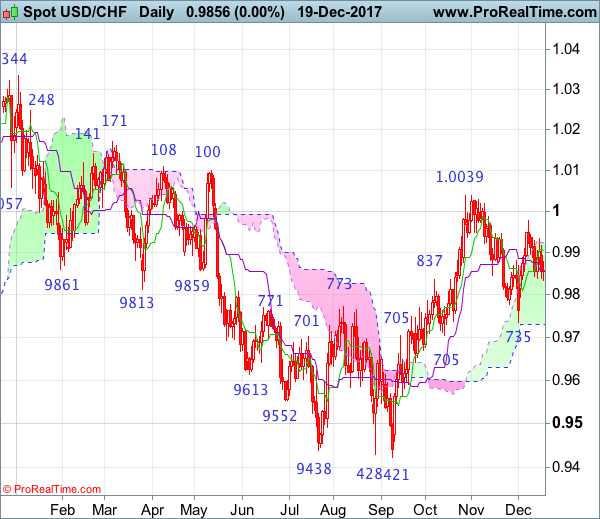
Daily
• Last Candlesticks pattern: Morning star
• Time of formation: 9 May 2017
• Trend bias: Near term up
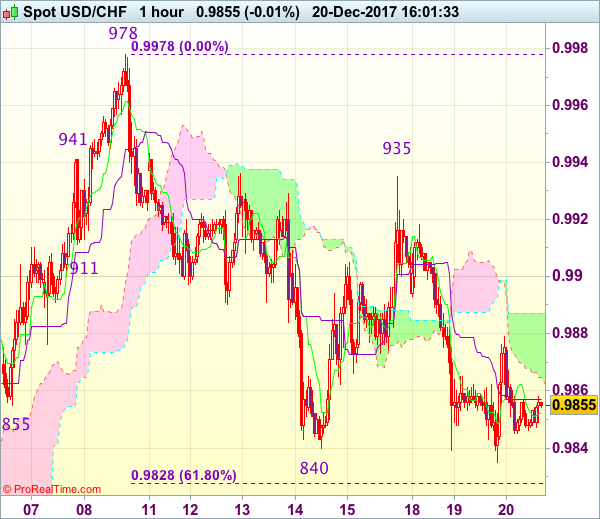
USD/CHF – 0.9860
Although the greenback slipped again late last week and fell to 0.9835 (a long position was entered), as this move from 0.9978 is still viewed as retracement of early rise form 0.9735, reckon downside would be limited and bring rebound later, above the Tenkan-Sen (now at 0.9908) would bring test of resistance at 0.9935 but break there is needed to signal the retreat from 0.9978 has ended, bring test of resistance area at 0.9978-87, a daily close above this level would indicate the fall from 1.0039 has ended at 0.9735 earlier, bring test of indicated resistance at 1.0018, break there would provide confirmation and bring retest of this level first.
On the downside, whilst marginal fall below 0.9835 cannot be ruled out, reckon 0.9795-00 would hold from here, bring rebound later. A daily close below 0.9795-00 would risk retest of said support at 0.9735 but only a drop below this support would shift risk back to downside and signal top has been formed at 1.0039 earlier, bring retracement of recent upmove from 0.9421 to minor support at 0.9670, then 0.9642 (another support) but reckon downside would be limited to 0.9590-00 and support at 0.9565 should remain intact.
Recommendation: Hold long entered at 0.9835 for 1.0035 with stop below 0.9735.
On the weekly chart, although the greenback has retreated again this week after meeting resistance at 0.9978 earlier this month, reckon downside would be limited to 0.9795-00 and mild upside bias remains for another rebound, a break above 0.9978-87 resistance would confirm the pullback from 1.0039 has ended, bring a retest of 1.0039, above there would extend the rise from 0.9421 low to previous resistance at 1.0100-08, having said that, overbought condition should prevent sharp move beyond previous resistance at 1.0171 and 1.0200-10 should hold from here.
On the downside, although initial pullback towards 0.9795-00 cannot be ruled out, price should stay well above support at 0.9730-35 and bring another rise later. A weekly close below there would defer and signal top is formed instead, this also suggest first leg of rebound from 0.9737 has ended and bring weakness to 0.9690-00, however, reckon support at 0.9642 would limit downside and price should stay above support at 0.9565 and the greenback shall stage another strong rebound next month.
EURUSD Intraday Analysis
EURUSD (1.1840): The EURUSD closed with a bullish bias for the second day following the consolidation above 1.1730 level. Price action is seen once again trading back near the resistance level of 1.1843 - 1.1822 level. The euro had previously declined following establishing resistance at this level. Currently, the retest to the resistance level is likely to coincide with a double top pattern. To the downside, EURUSD is expected to trade within the range above the support level of 1.1710 - 1.1688. A break out from this range will potentially clear the way for the EURUSD towards the next leg in the trend.
Trade Idea : USD/CHF – Hold long entered at 0.9850
USD/CHF - 0.9860
Most recent candlesticks pattern : N/A
Trend : Near term down
Tenkan-Sen level : 0.9854
Kijun-Sen level : 0.9857
Ichimoku cloud top : 0.9887
Ichimoku cloud bottom : 0.9865
Original strategy :
Bought at 0.9850, Target: 0.9950, Stop: 0.9820
Position : - Long at 0.9850
Target : - 0.9950
Stop : - 0.9820
New strategy :
Hold long entered at 0.9850, Target: 0.9950, Stop: 0.9825
Position : - Long at 0.9850
Target : - 0.9950
Stop : - 0.9825
Although the greenback fell marginally to 0.9835 yesterday, lack of follow through selling and current rebound from 0.9835 suggest consolidation with mild upside bias is seen for gain to 0.9880, then 0.9900, however, break of resistance at 0.9935-36 is needed to signal low is formed, bring a stronger rebound to 0.9950-55 but price should falter well below resistance at 0.9978, bring retreat later.
In view of this, we are holding on to our long position entered at 0.9850. Below 0.9825-30 (61.8% Fibonacci retracement of 0.9735-0.9978) would signal the fall from 0.9978 top is still in progress and may extend further fall to 0.9795-00 and possibly towards 0.9775-80.