Sample Category Title
Market Update – European Session: German IFO Moves Off Record Highs
Notes/Observations
German IFO survey was mixed with Business Climate moving off recent record high)
Republicans appear all but certain to pass tax legislation
Asia:
Reserve Bank of Australia (RBA) Dec Minutes reiterated that the low level of interest rates was continuing to support the Australian economy with inflation to pick up gradually as the economy strengthens. appreciating exchange rate would be expected to result in a slower pick-up in economic activity and inflation than currently forecast.
Japan Cabinet Office (Govt) raises FY17/18 and FY18/19 GDP growth forecast citing improvement in domestic demand. Raised FY17 GDP from 1.5% to 1.9% and FY18 GDP from 1.4% to 1.8%. Cut FY18 CPI to 1.1%
China Embassy in the US commented following release of US National Security Strategy: US should accept and adapt to China’s development (**Note: US stated that it would no longer tolerate chronic trade abuses)
World Bank raised China 2017 GDP from 6.7% to 6.8% but maintained 2018 GDP at 6.4%
Europe:
EU Chief Brexit Negotiator Barnier: its not possible to give UK banks a 'special deal' in Brexit
PM May plan on Brexit transition said to have been met with skepticism from pro-Brexit lawmakers fearful of a watered-down EU exit.
South Africa ANC party elects Ramaphosa is the new President
Americas:
House of Representatives to vote on tax bill early Tuesday afternoon; Sen Collins (R-ME); Sen Lee (R-UT) pledge to back bill in Senate
Fed's Kashkari (dovish dissenter; non-voter in 2018): do not appear to be moving toward our inflation target; should not raise rates until we are more confident inflation will rise
S&P affirmed Mexico Foreign Currency Sovereign Ratings at BBB+, cuts Local Currency Ratings On Revised Criteria to A-; outlook stable
Economic Data:
(ZA) South Africa Oct Leading Indicator: 105.4 v 104.7 prior
(DE) Germany Dec IFO Business Climate:117.3 v 117.5e (moved off record level); Current Assessment: 125.4 v 124.7e, Expectations Survey: 109.5 v 110.8e
(EU) Euro Zone Oct Construction Output M/M: -0.4% v +0.1% prior; Y/Y: 2.0% v 3.5% prior
(EU) Euro Zone Q3 Labour Costs Y/Y: 1.6 v 1.8% prior
Fixed Income Issuance:
None seen
SPEAKERS/FIXED INCOME/FX/COMMODITIES/ERRATUM
Equities
Indices [Stoxx600 +1% at at 393.1, FTSE +0.2% at 7554, DAX flat at 13317, CAC-40 -0.1% at 5416, IBEX-35 +0.3% at 10275, FTSE MIB +0.1% at 22420, SMI +0.1% at 9460 , S&P 500 Futures +0.1%]
Market Focal Points/Key Themes:
European Indices trades higher across the board continuing the upward trend as year end approaches with positive sentiment on US tax reform, as well as a continued elevated IFO reading aiding sentiment.
On the earnings front Cecnomy trades lower of FY17 results; Hugo Boss trades higher after postiive comments from the CEO for 2018 whileTechnicolor trades over 3% lower after lower their outlook. GoCompare trades higher after acquiring Myvoucher codes, with Old Mutual also higher after divesting its single strategy unit for £600M.
Looking ahead looking out for earnings from Darden, Renesola and Carnival.
Equities
Consumer Discretionary [Ceconomy [CEC.DE] -5.3% (Earnings), Hugo Boss [BOSS.DE] +1.0% (Upbeat CEO comments), Technicolor [TCH.FR] -3.1% (Adjust FY outlook)]
Consumer Staples [Greenyard [GREEN.BE] +0.3% (Confirms its in advanced negotiations to acqire Dole)]
Financials [OML [OML.UK] +3.1% (Disposal)]
Technology [ GoCompare [GOCO.UK] +4.3% (Acquires MyVoucherCodes)]
Speakers
ECB’s Hansson (Estonia): Important for ECB to change guidance gradually and expected communication to be adjusted in H1 of 2018
ECB’s Visco (Italy): Domestic banking crisis was not due to lack of supervision but to the great economic crisis and magnified by bad management
Swiss SECO Dec Economic Forecasts which raised 2017 GDP growth forecast from 0.9% to 1.0% and 2018 GDP from 2.0% to 2.3%. On inflation its raised 2018 CPI from 0.2% to 0.3% and set 2019 CPI at 0.7%
Bank of Finland Economic Outlook raised both 2017 and 2018 growth outlook. Raised 2017 GDP growth from 2.4% to 3.1% and 2018 GDP growth from 1.6% to 2.4%. It set 2019 GDP at 1.9%
Spain PM Rajoy proposed to raise minimum wage by 4% before year-end. Proposal subject to reasonable economic growth and the creation of at least 450K jobs per year
Norway Central Bank (Norges) Gov Olsen: Still had spare capacity in the domestic economy. Low interest rates had a price and risk; did not wish for them (rates) to move lower
Norway Fin Min Jensen stated that the scope for further spending increases was limited and noted that the recent decline in House prices was a welcomed sight
Sweden Fin Min Andersson: Still having good developments within the economy
German IFO Economists stated that economy was waiting for the formation of a govt; one should not exaggerate the decline in monthly data
Russia Central Bank stated that it did not see any FX liquidity issues heading into year-end
Bank of Korea (BOK) Nov Minutes noted that the dissenter believed that the domestic economy was not strong enough for a rate hike. Believed that a rate hike in early 2018 would have been better
Thailand Cabinet approved its 2018 inflation target range between 1.0-4.0% with 2.5% midpoint
Currencies
EU session saw a relatively subdue price action but the USD was marginally softer as dealers assessed the potential impact of US tax bill.
EUR/USD was higher by 0.2% to test back above the 1.18 level. GBP/USD 1.3370 and USD/JPY at 112.60.
The ZAR currency (Rand) saw some of its recent sharp gains retrace in the aftermath of the ANC party leadership vote outcome. USD/ZAR tested 12.40 area after market-favored Ramaphosa was formally elected. The pair was hovering around 12.77 area just ahead of the NY morning.
Fixed Income
Bund futures trade 163.22 down 8 ticks, after German IFO misses and comes off record levels. Bunds are continuing to respect the November highs. Continued upside sees 163.63 then 164.25. A reversal targets 162.50 then 162.38.
Gilt futures trade at 126.37 down 10 ticks near the mid-point for the 2017 trading range. Continued upside eyeing 126.75 then 127.25. Downside targets include 125.75 then 125.24.
Tuesday’s liquidity report showed Monday's use of the marginal lending facility rose to €133M from €124M prior.
Corporate issuance - Primary expected to close for the year
Looking Ahead
(US) House of Representative vote on Tax Reform (expected in early PM)
(IL) Israel Dec CPI-12 Month Forecast: No est v 0.8% prior
(UR) Ukraine Q3 Final GDP Q/Q: No est v 0.2% prelim; Y/Y: 2.1%e v 2.1% prelim
05.30 (UK) Weekly John Lewis LFL sales data
05:30 (EU) ECB allotment in 7-day Main Financing Tender (MRO) tender
05:30 (HU) Hungary Debt Agency (AKK) to sell in 3-month Bills
06:00 (PT) Portugal Nov PPI M/M: No est v 0.4% prior; Y/Y: No est v 2.7% prior
06:00 (NO) Norway Central Bank (Norges) Gov Olsen
07:00 (RU) Russia announces weekly OFZ bond auction
07:45 (US) Weekly Goldman Economist Chain Store Sales
08:00 (HU) Hungary Central Bank (NBH) Interest Rate Decision: Expected to leave Base Rate unchanged at 0.90%
08:00 (RU) Russia Nov Unemployment Rate: 5.2%e v 5.1% prior, Real Disposable Income: -0.3%e v -1.3% prior, Real Wages Y/Y: 4.5%e v 4.3% prior
08:00 (RU) Russia Nov Real Retail Sales M/M: -0.3%e v +0.2% prior; Y/Y: 3.3%e v 3.0% prior
08:00 (PL) Poland Nov Sold Industrial Output M/M: -1.3%e v +5.1% prior; Y/Y: 9.3%e v 12.3% prior, Construction Output Y/Y: 14.1%e v 20.3% prior
08:00 (PL) Poland Nov PPI M/M: 0.3%e v 0.3% prior; Y/Y: 2.2%e v 3.0% prior
08:00 (PL) Poland Nov Retail Sales M/M: -3.9% v +3.3% prior; Y/Y: 7.4%e v 8.0% prior, Real Retail Sales Y/Y: 6.5%e v 7.1% prior
08:05 (UK) Baltic Dry Bulk Index
08:30 (US) Q3 Current Account: -$116.2Be v -$123.1B prior
08:30 (US) Nov Housing Starts: 1.250Me v 1.29M prior; Building Permits: 1.270Me v 1.316M prior (revised from 1.297M)
08:55 (US) Weekly Redbook Sales
09:00 (EU) Weekly ECB Forex Reserves
09:00 (HU) Hungary Central Bank Gov Matolcsy post rate decision statement
09:00 (NZ) Fonterra Global Dairy Trade Auction
11:30 (US) Treasury to sell 4-Week Bills
15:00 (MX) Mexico Citibanamex Survey of Economists
16:30 (US) Weekly API Oil Inventories
AUDJPY Struggling To Break Above 86.65, Hits 1-Month High
AUDJPY has shifted to a bullish bias in the short to medium-term timeframe after strong upside momentum in the prior weeks and recorded a one-month high at 86.10. The price rebounded on the 84.30 support barrier, which overlaps with the ascending trend line that is holding since September 27.
However, since Monday's trading session, the pair is trading near the 50-day simple moving average as well as near the upper boundary of the Bollinger band and both are acting as significant resistance obstacles for the bears. Momentum faded over the last few days when market reached positive levels. The daily RSI crossed the 50 level to the upside but is moving with weaker momentum than before. In addition, the Rate of Change (ROC) indicator is sloping to the downside in the overbought zone indicating for a bearish correction.
The rally could slow down in case of a failed attempt to continue the bullish tendency above the aforementioned obstacles. The AUDJPY may approach the 38.2% Fibonacci retracement level (84.90) of the last big upward movement with low at 76.20 and high at 90.30.
An alternative scenario is a daily close above the immediate resistance at 86.65 and the 23.6% Fibonacci level (86.96) would help keep momentum to the upside but the tentative falling trend line needs to be broken to strengthen the move up to target the key 88.10 area soon.
Forex Technical Analysis: EUR/USD, USD/JPY, GBP/USD
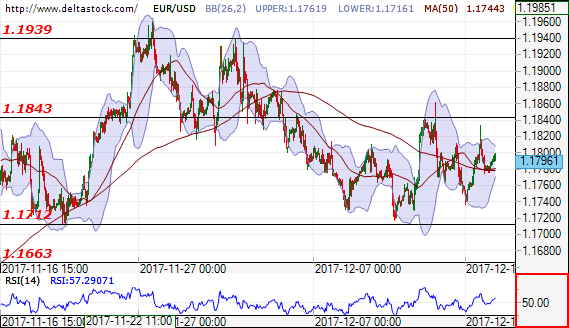
EUR/USD
Current level - 1.1796
The outlook is positive for test and breakthrough of the resistance level at 1.1843. In negative direction the support levels are at 1.1712 and after that at 1.1663.
| Resistance | Support | ||
| intraday | intraweek | intraday | intraweek |
| 1.1843 | 1.1939 | 1.1712 | 1.1663 |
| 1.1939 | 1.2090 | 1.1712 | 1.1550 |
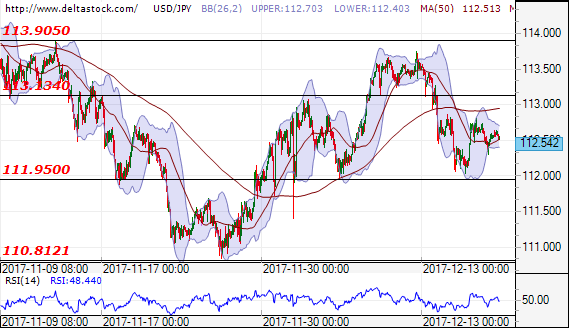
USD/JPY
Current level - 112.54
The negative outlook is still intact for breakthrough of the support level at 111.95 and after that for a test of the next support at 110.80. In positive direction only a breakthrough at 113.95, may lead to another increase of the price.
| Resistance | Support | ||
| intraday | intraweek | intraday | intraweek |
| 113.13 | 113.90 | 111.90 | 109.50 |
| 113.90 | 114.50 | 110.80 | 107.30 |
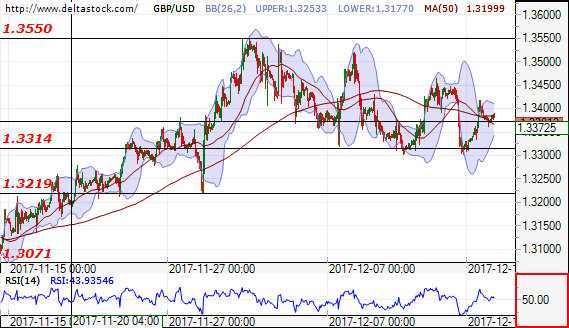
GBP/USD
Current level - 1.3372
The forecast is positive for test of the resistance level at 1.3550. In negative direction a successful breakthrough of the support level at 1.3314, may lead to the next support at 1.3219.
| Resistance | Support | ||
| intraday | intraweek | intraday | intraweek |
| 1.3550 | 1.3660 | 1.3314 | 1.3220 |
| 1.3550 | 1.3660 | 1.3220 | 1.3070 |
Technical Outlook: Gold Recovery Hits New 2-Week High But Risk Of Stall Exists
Spot Gold maintains firm tone and holding near two-week high at $1265, on Tuesday, following strong rally on Monday.
The yellow metal was lifted by weaker dollar on concerns about US tax reforms plan and ahead of US housing data, due later today.
Tuesday's action is holding above broken pivotal barrier at $1260 (Fibo 38.2% of $1299/$1236 downleg) and eyeing strong resistance at $1267 (converged 20/200SMA's) and break here could trigger fresh recovery extension towards $1275 (Fibo 61.8% of $1299/$1236).
However, risk of recovery stall exists as 20/200SMA's are on track to form death-cross and slow stochastic is overbought on daily chart.
Initial signal of stall could be expected on return below $1260 while fall below 10SMA ($1253) would confirm reversal.
Res: 1265, 1267, 1275, 1280
Sup: 1260, 1253, 1250, 1244
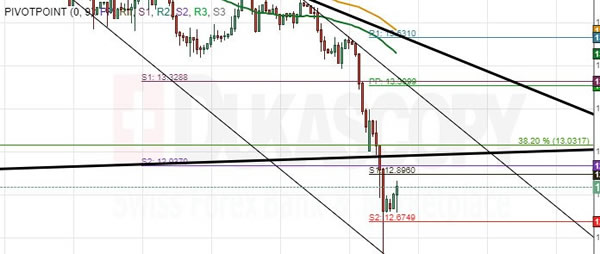
USD/ZAR 4H Chart: Breaking Massive Pattern
The US Dollar recently plummeted against the South African Rand. From a technical perspective the reason for the fall was the encountering of a Fibonacci retracement level, which is measured by connecting the high and low levels of the last decade.
However, that move was not as surprising as the fact that the following decline broke the support of a massive scale channel up pattern, which represented the pair’s rebound of 2017.
In regards to what the traders want to know, the pair is set to trade between two levels in the near future until it breaks to the downside and begins an approach of the 2017 low level at 12.32.
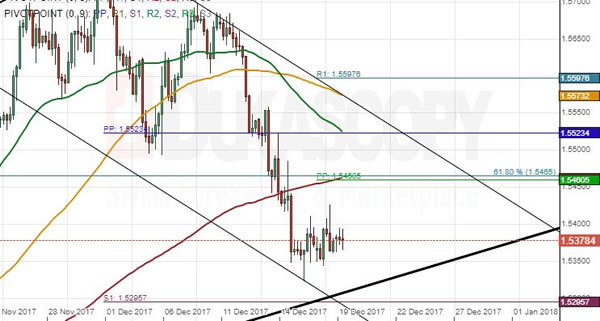
EUR/AUD 4H Chart: Continues downward movement
Some development have taken place on the EUR/AUD currency exchange rate. Due to that reason an update to the situation is being done.
First of all the previously drawn channel down pattern was broken, as a new one revealed itself. However, that move has actually extended the gains of the short sellers of the Euro against the Australian Dollar.
Secondly, the pair has bounced off the lower trend line of the new channel and seems to have begun a surge, which is aimed to reach the resistance cluster near 1.5460 mark.
Meanwhile, the lower trend line of a dominant channel up pattern will provide support close by.
Bank Of Japan Preview: Things Just Got Interesting, But Still Too Early For Tightening Discussions
- We expect the Bank of Japan to maintain its 'QQE with yield curve control' policy unchanged at this week's monetary policy meeting and we will be listening closely whether Kuroda will elaborate on recent comments.
- We see USD/JPY trading mostly sideways within the 111.65-114.50 range near term, targeting 113 in 1-3M.
BoJ unchanged – focus on tightening talks and BoJ leadership
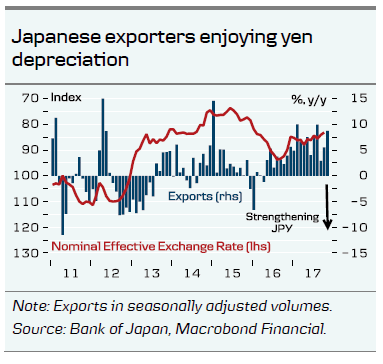
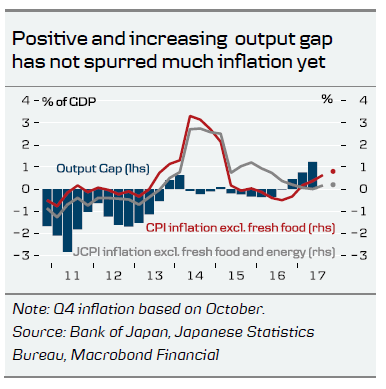
Speculation about policy tightening from the Bank of Japan (BoJ) has gained momentum since governor Kuroda gave a speech at the University of Zurich, where he mentioned the “reversal rate”. Since then, Kuroda has backtracked somewhat on the Zurich remarks, saying that the yield curve control is designed to be highly sustainable. The economic upturn in Japan is still mainly driven by foreign demand as Japanese exporters enjoy tailwind from the relatively weak Yen. See Big Picture (4 December) for details. In our view, a policy tightening would strengthen the yen and potentially derail the economic upturn, and as long as we are not seeing any pickup in core inflation and long global yields remain low, we believe any tightening will be too soon. Hence, we do not expect the BoJ to be close to tightening yet. But we will be listening closely as to whether Kuroda will elaborate on recent comments. In our main scenario, we still expect Koruda to be reappointed and expect the BoJ to keep its current 'QQE with yield curve control' policy unchanged in 2018. We believe the BoJ would like to allow for higher longer-term rates in order to give banks some breathing space, but in the current environment with a flat global yield curve, we simply do not think there is room for this.
Record spending and wage growth incentives to support growth
Japan's ruling bloc has approved a plan to cut the corporate tax rate to around 20% from 30%. The plan, which would be effective for three years from fiscal 2018, needs parliamentary approval to be enacted. If endorsed it would be a helping hand for the BoJ, as the proposed tax cut would apply only for companies that raise wages aggressively and boost domestic capital spending. Along with what looks to be another record public budget for fiscal 2018, this is set to push the economic upswing even further next year. However, tax breaks are in place for only three years and the question is whether companies will be reluctant to increase permanent fixed costs (wages) on the back of this.
USD/JPY to remain range-bound near term
We expect US tax reform and USD liquidity to remain USD/JPY supportive in the short term but we still see USD/JPY trading mostly sideways within the 111.65-114.50 range near term, targeting 113 in 1-3M. While we still expect Fed-BoJ divergence, solid global growth and higher global yields (eventually) to support the cross, we see little potential for a substantial move higher over the medium term. We target 114 in 6-12M, with risks increasingly skewed to the downside amid stretched short JPY positioning, further flattening pressure of the US yield curve and a weaker growth outlook in China
The Oil Calmed Down After Forties Pipeline System Failure
Last week, the commodity market was very sensitive to the news about the Forties pipeline system breakdown and the fact that the pipeline had to be closed for maintenance. Brent reached the local high at 65.83 USD per barrel. However, after a couple of days this "bullish frenzy" died down and investors started analyzing the situation. It became quite clear why Brent was rising so fast, WTI was behind, and what was the reason of all this.
The Forties pipeline is very important for the United Kingdom and the oil extraction in the North Sea in general. In fact, it's the only way to transport northern oil to the continent. At first, there was information about a small crack in the pipeline, which resulted in a spillage. It was assumed that the problem might be resolved by reducing the pressure the pipe section where the crack had been detected. However, this plan didn't work, the crack got bigger, and the pipeline had to be closed for unscheduled maintenance.
Brent's response to this was pretty obvious. Forties is one of the BFOE and influences the total Brent price. First of all, the cost of Brent is some kind of a baseline for the Middle East countries for pricing their own oil. This pricing policy is quite complicated, but it's clearly seen that all parts of this chain are closely connected. Hence the reactions that were seen last week.
The Forties pipeline system maintenance will last about two weeks, considering that it is empty for already a week. They are planning to get it back to operation by New Year, and that's when the price of Brent will exclude the risk factor.
Last Friday's statistics on the Oil Rigs changes in the USA from Baker Hughes showed the decrease by 1 unit and didn't attract much attention. The components of the report indicated that the number of gas rigs increased by 3 units and the number of oil rigs decreased by 4. There is nothing really surprising in this, it's quite usual. This year, the number of rigs has expanded by one third, and this is what really should be taken into account when analyzing this indicator.
From the technical point of view, the chart of Brent is quite mixed, but very interesting. After breaking the resistance line of the previous channel, the price moved back, and reached a new low, which may start a new rising channel. The upside target may be the resistance line at 67.05. However, we should ignore a possibility that the downtrend may yet continue. If the price breaks the support line of the current trend channel and fixes below 62.60, it may fall towards the projected support line at 59.20.
Elliott Wave Analysis: Stocks As S&P500 And Dax Can Slowdown In The Near-Term
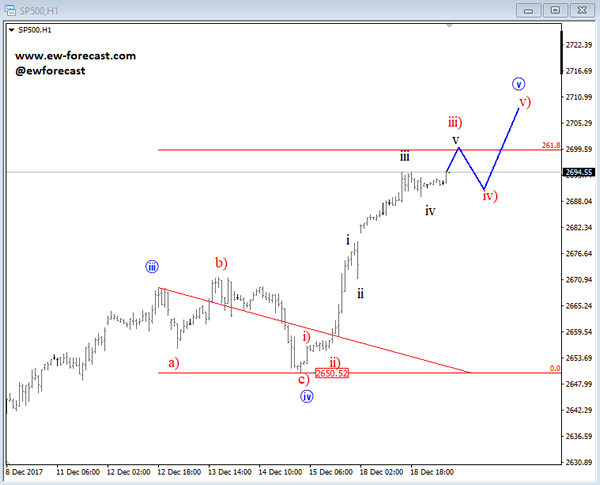
Yesterday we have seen a sharp leg up on US stocks with E-mini S&P500, which lift prices to 2695 level and can be aiming for 2700 and above. This strong rally followed a completed Elliott wave flat pattern, that was located in corrective blue wave iv. That said, around the metioned 2700 region, price may slow donw and turn choppy for a temporary pullback.
S&P500, 1h
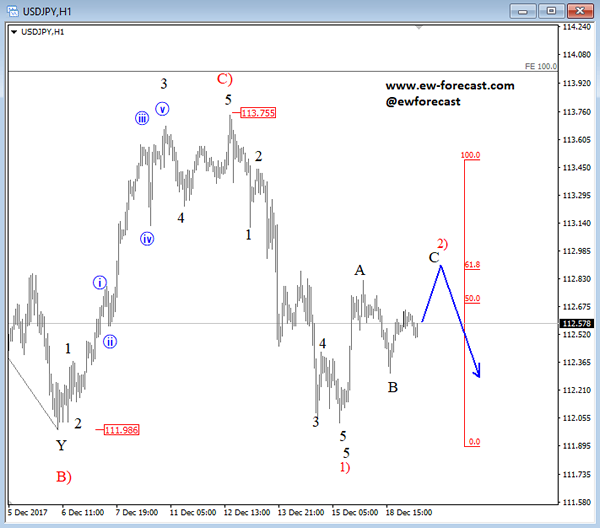
While stocks are up there is a chance that USDJPY will make a rally to higher levels as well, but still in corrective fashion. We are looking at an A-B-C in wave 2) that can reach 113.00 resistance from where I would expect a sell-off based on a clear bearish Elliott Wave pattern while price trades below 113.75.
USDJPY, 1h
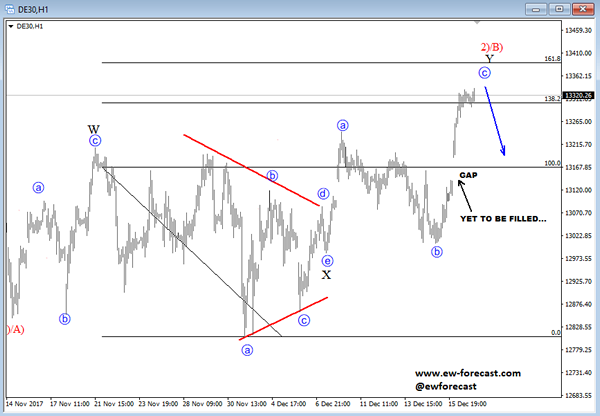
At the same time we may see DAX turning south as well, as index can be in late stages of sub-wave c of Y. Resistance is now around 13330-13350 price region.
German dax, 1h
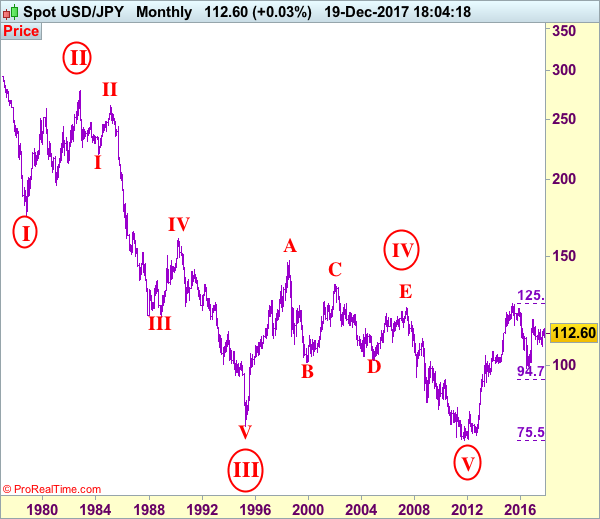
USD/JPY Elliott Wave Analysis
USD/JPY - 112.61
USD/JPY – Wave V of larger degree circle V has possibly ended at 75.31 and major correction has commenced and already met indicated target at 125.00.
The greenback only slipped to 112.03 late last week before rebounding (just missed our long entry at 112.00) and gain to 113.00-05 cannot be ruled out, however, as outlook remains consolidative, reckon upside would be limited to 113.50 and resistance at 113.75 would hold from here, bring further choppy trading. Only a break of 113.75 would revive bullishness and signal the rebound from 110.84 is still in progress and may extend gain to 113.91 resistance, break there would add credence to our view that the pullback from 114.74 has ended at 110.84, bring further rise to 114.30-35, then retest of said recent high which is likely to hold on first testing and price should falter below 115.00-10.
Our preferred count is that, triangle wave IV (with circle) ended at 101.45 and the circle wave V brought dollar down to the record low of 75.31 in 2011 and the subsequent rebound signal major correction has commenced with A leg ended at 84.19, followed by wave B at 77.14 and impulsive wave C is now unfolding (indicated upside target at 125.00 had been met) for gain towards 127.00 level. In the event dollar drops below support at 99.01, this would confirm medium term decline from 125.86 top (2015 high) has resumed for subsequent weakness to 98.00 and possibly 97.00.
Under this count, this wave C is unfolding as impulsive waves with (1) (2), 1 2 ended at 80.67, 79.07, 82.84 and 81.69 respectively, hence the extended wave 3 has ended at 103.74 and wave 4 correction of recent upmove should bring weakness to 92.57, then towards 90.88 but psychological support at 90.00 should limit downside and bring another rally later in wave 5, indicated target at 125.00 had been met and gain to 127.00 cannot be ruled out but reckon price would falter below 130.00.
On the downside, whilst initial pullback cannot be ruled out, reckon indicated support at 111.99-112.03 would limit downside and bring another rise later. Below 111.99 would risk test of support at 111.41 but a daily close below there is needed to signal the rebound from 110.84 has ended, then retest of this support would follow, a drop below this level would revive bearishness and extend the fall from 114.74 top to 110.50, then 110.00.
Recommendation: Stand aside in the meantime.
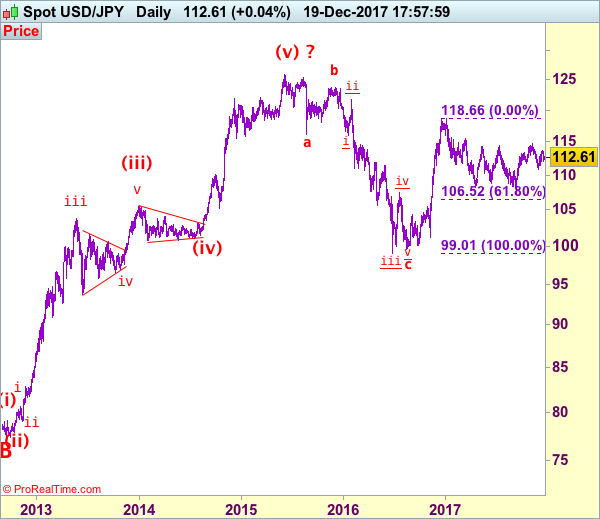
On the monthly chart, we have changed our preferred count that an impulsive wave is unfolding with major wave III with circle ended at 79.75, then followed by wave IV with circle and is labeled as a triangle with A: 147.64 (11 August, 1998), B: 101.25, C: 135.20, D: 101.67 and E leg ended at 124.14 to end the wave IV with circle. Hence, wave V with circle commenced from there and hit a record low of 75.31, however, the subsequent strong rebound signals this circle wave V has possibly ended there, hence gain to (indicated upside target at 122.00 and 125.00 had been met), the retreat from 125.86 suggests wave A of major correction has ended there and wave B correction back to 99.00, then 95.00 would be seen, however, reckon downside would be limited to 90.00, bring another rebound in wave C next year.