Sample Category Title
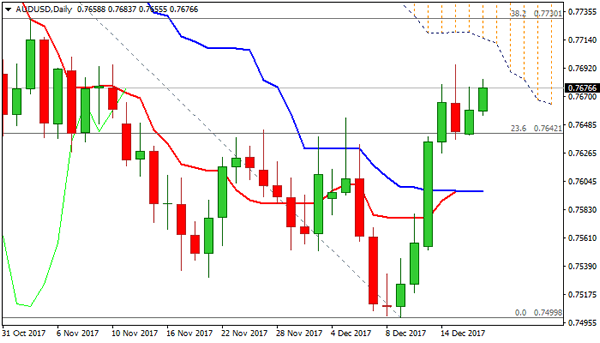
Technical Outlook: AUDUSD – Recovery Remains Limited By 200SMA As Falling Daily Cloud Continues To Weigh
The Aussie dollar maintains firm tone on Tuesday and ticked higher in attempts to test three-day consolidation top at 0.7694.
Resistance is reinforced by 200SMA and marks the lower side of strong resistance zone between 0.7694 and 0.7714, provided by 200SMA and the base of falling thick daily cloud.
The pair is facing strong headwinds here and stall of recovery leg from 0.7500 cannot be ruled out.
Dip below 0.7626 (consolidation range floor) would generate initial bearish signal while return below 0.7597 (converged daily Tenkan-sen / Kijun-sen) is needed to confirm reversal and re-focus 0.7500 base.
Alternative scenario needs penetration of daily cloud and lift above 0.7730 (Fibo 38.2% of 0.8102/0.7500 descend) to signal stronger correction.
Res: 0.7694, 0.7714, 0.7730, 0.7800
Sup: 0.7655, 0.7626, 0.7597, 0.7574
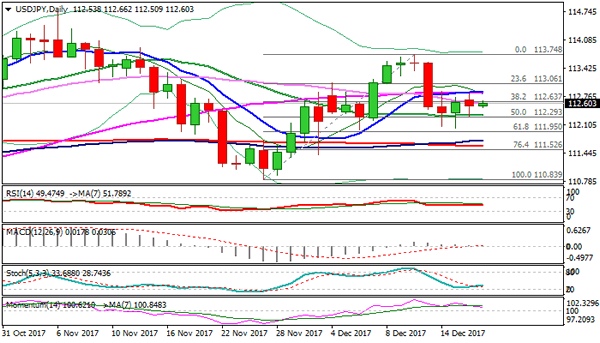
Technical Outlook: USDJPY – Trading In Extended Consolidation Between 20 And 10SMA’s
The pair is holding in consolidation for the fourth straight day, entrenched in the range between 20SMA (112.33) and converged 10/55SMA's (112.85).
Mixed daily techs do not provide clear direction signal but last week's long bearish candle continues to weigh and keep the downside at risk.
Clear break below cracked 20SMA would open way for fresh attack at next pivotal support at 111.95 (Fibo 61.8% of 110.83/113.74 rally) and shift near-term bias lower on break.
Conversely, sustained break above 10/55SMA's is needed to turn focus higher and signal higher low formation at 112.00 zone (lows of 14/15 Dec).
Vote on US tax bill remains one of key events for the dollar, with vote in US Senate planned as early as today.
Res: 112.66, 112.85, 113.09, 113.57
Sup: 112.50, 112.33, 111.95, 111.74
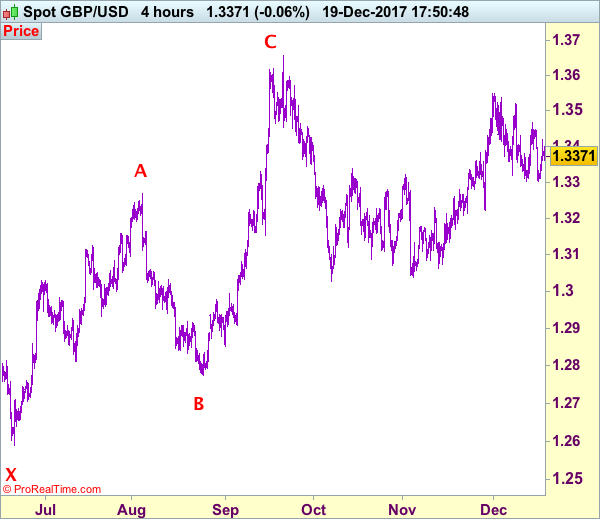
Trade Idea: GBP/USD – Stand aside
GBP/USD – 1.3373
New strategy :
Stand aside
Position: -
Target: -
Stop:-
Despite falling marginally to 1.3302, lack of follow through selling on break of previous support at 1.3303 and the subsequent rebound to 1.3419 (Monday’s high) suggest further choppy trading would be seen, however, a break above said resistance is needed to suggest low has possibly been formed, bring a stronger rebound to 1.3450 but only break of resistance at 1.3466 (last week’s high) would confirm and bring further subsequent gain to 1.3500 and later towards 1.3521. Only a break of 1.3521 would suggest the correction from 1.3550 has ended, bring retest of this level later. Looking ahead, a break of 1.3550 would extend the rise from 1.3027 low to 1.3595-00, however, reckon recent high at 1.3658 (Sept high) would hold from here due to near term overbought condition, bring retreat later. Our preferred count is that (pls see the attached chart) the wave IV is unfolding as a complex double three (ABC-X-ABC) correction with 2nd wave B ended at 1.2774, hence 2nd wave C could have ended at 1.3658.
On the downside, whilst pullback to 1.3330-35 cannot be ruled out, said support at 1.3302 should remain intact, bring another rebound later. Only a drop below said support at 1.3302 would revive bearishness and extend the fall from 1.3550 for retracement of recent rise to 1.3250-60 but previous support at 1.3221 should remain intact, bring rebound later.
Our preferred count on the daily chart is that cable's rebound from 1.3500 (wave (A) trough) is unfolding as a wave (B) with A ended at 1.7043, followed by triangle wave B and wave C as well as wave (B) has ended at 1.7192, the subsequent selloff is the larger degree wave (C) which is still unfolding with minor wave (III) of larger degree wave 3 ended at 1.1986, hence wave (IV) correction is in progress which could either be a triangle wave (IV) of a complex formation but upside should be limited to 1.3500 and price should falter well below 1.4000, bring another decline in wave (V) of 3 for weakness to 1.1500, then 1.1200.
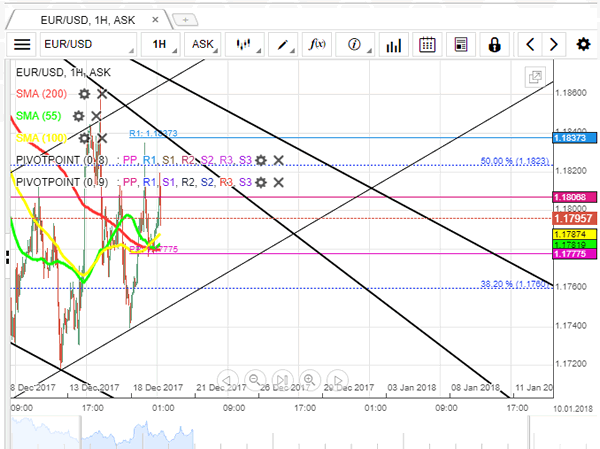
EUR/USD Starts New Day Above MAs
Despite increasingly positive stance on the Dollar, the Euro continued to inch higher yesterday, being driven by the minor head and shoulders pattern.
As the currency rate managed to end previous trading session above the combination of 55-, 100- and 200-hour SMAs as well as the weekly PP, they are expected to provide support for further advance.
Accordingly, the main target for the pair would an intersection of the monthly PP and the upper trend-line of a senior descending channel. Whether the exchange rate will manage to break this barrier will heavily depend on result of today's vote in the Congress.
An adoption of tax reform might push the rate down to the 38.2% Fibonacci retracement level at 1.1760, while the opposite result is likely to elevate the rate straight to the last week high at 1.1845.
EUR/USD Candlesticks and Ichimoku Analysis
Weekly
• Last Candlesticks pattern: Shooting star
• Time of formation: 31 Jul 2017
• Trend bias: Near term up
Daily
• Last Candlesticks pattern: Shooting star
• Time of formation: 2 Aug 2017
• Trend bias: Up
EUR/USD – 1.1798
Although the single currency met resistance at 1.1863 last week and retreated, as euro continued finding support just above last week’s low at 1.1717 and recovered, suggesting further consolidation would be seen and another bounce to 1.1830-35 cannot be ruled out, however, said resistance at 1.1863 should hold, bring another decline later. A break of indicated support at 1.1713-17 would signal the rebound from 1.1554 has ended, bring further fall to 1.1650-60, then towards 1.1600 but said support at 1.1554 should remain intact.
On the upside, whilst recovery to 1.1830-35 cannot be ruled out, reckon upside would be limited to 1.1863 and bring another decline to aforesaid downside targets. Above indicated resistance at 1.1940 would risk retest of recent high at 1.1961 but only break there would signal the rise from 1.1554 is still in progress and extend gain to 1.2005. Looking ahead, above there would confirm recent upmove has resumed for retest of 1.2093, break there would extend the rise from 1.0340 low to 1.12150-55 first.
Recommendation: Stand aside for the time being
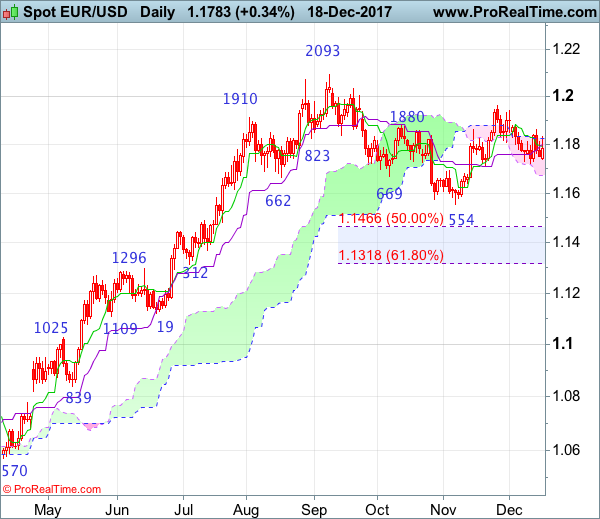
On the weekly chart, as euro has retreated again after meeting resistance at 1.1863 last week, retaining our view that further consolidation below indicated level at 1.1961 would be seen and test of 1.1713-17 support cannot be ruled out, however, break there is needed to signal the rebound from 1.1554 has ended, bring weakness to 1.1650-60, then towards said support at 1.1554 which is likely to hold from here. A drop below said support at 1.1554 would signal a temporary top has been formed at 1.2093, bring retracement of recent rise to 1.1500, then 1.1466 (50% Fibonacci retracement of 1.0839-1.2093) but reckon downside would be limited to 1.1400 and 1.1312-18 (previous support and 61.8% Fibonacci retracement) should hold, price should stay above previous minor resistance at 1.1296, bring another rebound.
On the upside, expect recovery to be limited to 1.1863 and resistance at 1.1940 should hold, bring another retreat. Above said resistance at 1.1961 would revive bullishness and signal early pullback from 1.2093 has ended at 1.1554, bring further gain to 1.2005, once this level is penetrated, this would confirm early rise from 1.0340 low has resumed for retest of 1.2093, above there would extend headway to 1.2150-55, then 1.2200-10 later.

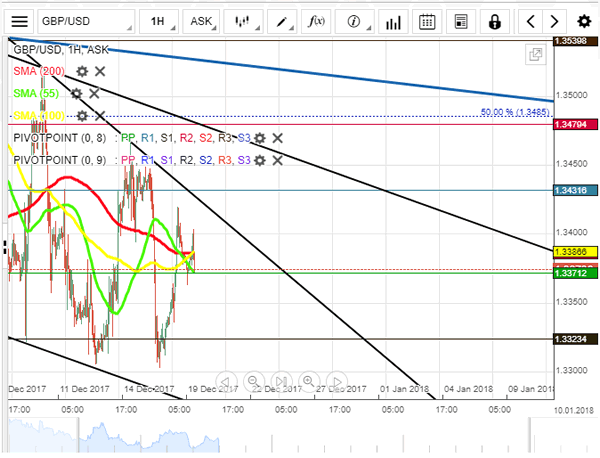
GBP/USD Breaks Above 1.3370
In first half of the previous trading session the currency pair struggled to bypass a combination of the weekly and monthly PP as well as the 55-, 100- and 200-hour SMAs, as expected.
Nevertheless, the overall depreciation of the Dollar allowed the cable to surge to the 1.3420 mark and only then make a rebound. As the above yesterday's resistance has turned to support, the rate most probably will resume the surge, trying to properly reach an alleged upper trend-line of a senior falling wedge formation.
However, the upcoming vote on tax reform is likely to alter this scenario and push the Dollar back to 1.3340. In support of this assumption, a majority of pending orders in 100-pip range are set to sell.
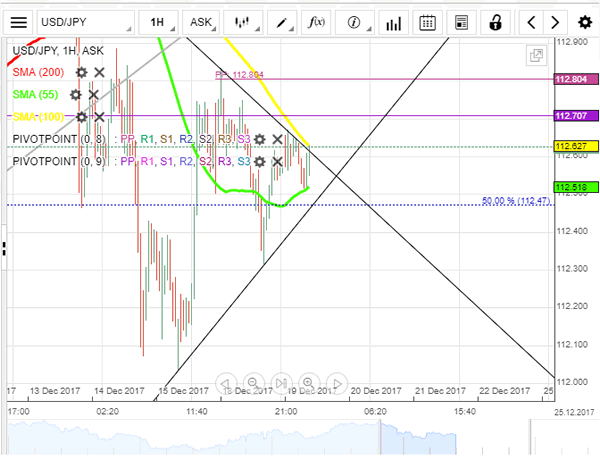
USD/JPY Fluctuates Between 55- And 100-Hour SMAs
In line with expectations, the currency exchange rate did not make any significant moves yesterday.
To put it differently, despite the pressure from the weekly and monthly PP as well as the 100-hour SMA, a combination of the 55-hour SMA and the 50% Fibonacci retracement level managed to constrain the downfall.
As for today, the vote in Congress should lead to appreciation of the buck. In support of this scenario, 54% of pending orders in 100-pip range are set to buy.
However, a concentration of the above technical indicators plus the 200-hour SMA most probably will either neutralize the surge or even cause a rebound and retreat back to support zone near the 112.10 level.
XAU/USD Ready To Test Weekly R1
In accordance with expectations, a support zone formed near the 1,254.00 mark did not allow the buck to gain value, while the rising 55-hour SMA pushed the yellow metal higher.
In result of the soar, the pair has broken the three-week long ascending channel and started new trading day from the monthly S1 at 1,261.45. As the exchange rate is located in an ascending channel the surge is expected to continue.
However, an alleged resistance located around the weekly R1 at 1,266.05 most probably will halt the upward movement, while adoption of tax bill by the Congress later this day might dissolute the above pattern and throw the rate back to the 100-hour SMA. In case of disappoint news the price of the bullion could spike right to the 1,270.00 mark.
EUR/USD: EZ Final Consumer Price Index
The European single currency was trading lower against the US Dollar on some pessimistic sings in the CPI reports for the Euro zone. The EUR/USD currency pair reached the 1.1785 mark, though the Greenback recovery remained restricted by looms of the US tax reform.
Euro zone's consumer inflation rose markedly in line with estimates, the final Eurostat report showed on Monday. The EZ Consumer Price Index growth confirmed preliminary gain of 1.5% in November, following a 1.4% increase in the prior month. However, inflation kept staying below, but very close to the ECB target of 2.0%. Higher energy prices were the major driver for growth, climbing 4.7% for the month. Meanwhile, prices of food, tobacco and alcohol eased to 2.2% from 2.3%.
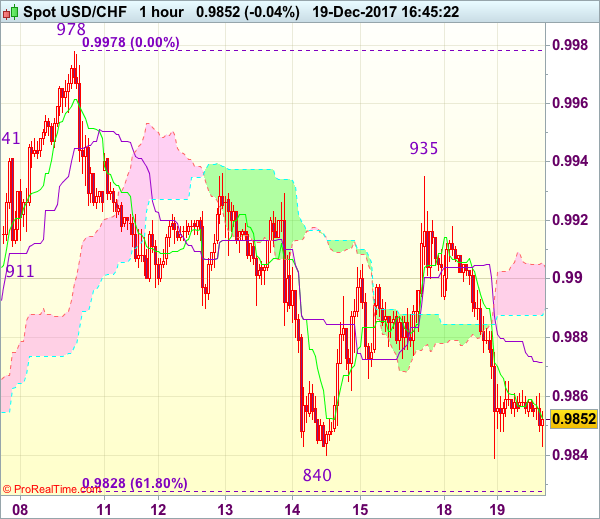
Trade Idea : USD/CHF – Stand aside
USD/CHF - 0.9857
Most recent candlesticks pattern : N/A
Trend : Near term down
Tenkan-Sen level : 0.9853
Kijun-Sen level : 0.9870
Ichimoku cloud top : 0.9904
Ichimoku cloud bottom : 0.9890
New strategy :
Stand aside
Position : -
Target : -
Stop : -
Despite falling marginally to 0.9839, lack of follow through selling on break of previous support at 0.9840 suggests consolidation would be seen and another bounce to 0.9875-80 cannot be ruled out, however, reckon upside would be limited to the upper Kumo (now at 0.9904) and bring another decline later, below said support would extend recent decline from 0.9978 top to 0.9820, then 0.9800 which is likely to hold from here due to near term oversold condition.
In view of this, would not chase this fall here and stand aside in the meantime. Above 0.9905-10 would bring another test of indicated resistance at 0.9935-36, however, break of this level is needed to revive bullishness and signal the pullback from 0.9978 has ended at 0.9840, bring retest of this level later.