Sample Category Title
Technical Outlook: SPOT GOLD – Post-Fed Rally Struggles At Falling 10SMA
Spot Gold rallied on Wednesday on weaker dollar but was so far unable sustain extension on Thursday, after upside attempts were capped by falling 10SMA at $1259 which marks one-week high.
Positive fundamentals are supportive for the yellow metal, but technical studies remain in full bearish setup on daily chart and see risk of recovery stall.
Initial requirement for bullish continuation is close above 10SMA ($1257), with extension above 200SMA ($1267) needed to generate stronger bullish signal.
The downside is expected to remain vulnerable while falling 10SMA/base of falling 4-hr cloud caps, with stronger bearish signals expected on reversal below $1250/$1245 (Fibo 38.2% and 61.8% of $1236/$1259 upleg).
Res: 1257, 1259, 1264, 1267
Sup: 1253, 1250, 1245, 1240
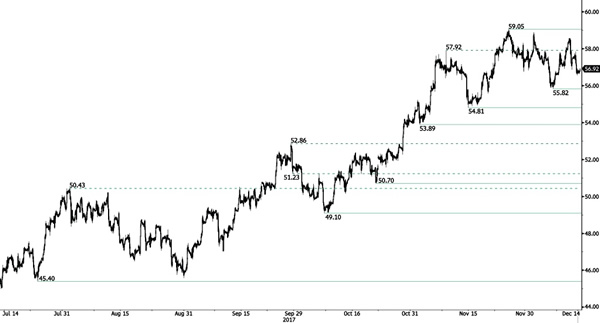
CRUDE OIL Ready For Another Leg Higher
Crude oil is has failed to break resistance given at 59.05 (24/12/2017 high). Support is given at 55.82 (07/12/2017 low). Expected to bounce back.
In the long-term, crude oil has recovered after its sharp decline last year. However, we consider that further weakness are very likely. For the time being the pair lies in an upside momentum. Strong support lies at 35.24 (05/04/2016) while resistance can now be found at 55.24 (03/01/2017 high).
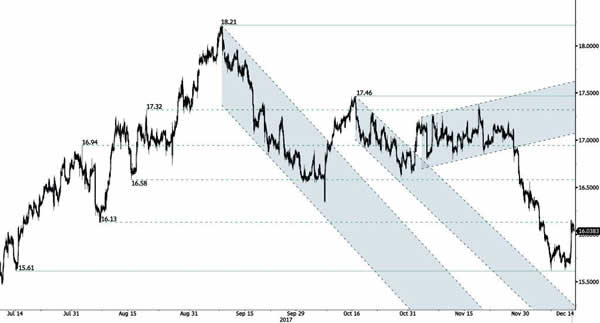
SILVER Lack Of Follow-Through
Silver has been bouncing on hourly support at 15.61 (14/07/2017 low). Hourly resistance is given at 17.46 (13/10/2017 high). Expected to show renewed bearish pressures.
In the long-term, the trend is rater negative. Further downsides are very likely. Resistance is located at 25.11 (28/08/2013 high). Strong support can be found at 11.75 (20/04/2009).
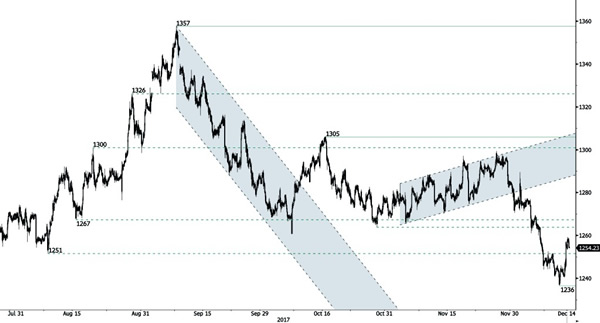
GOLD Short-Squeeze
Gold is still going lower after strong collapse even though traders are taking some profit. . Hourly support is given at 1236 (12/12/2017 low) . Resistance is located at 1259 (14/12/2017).
In the long-term, the technical structure suggests that there is a growing upside momentum. A break of 1392 (17/03/2014) is necessary ton confirm it, A major support can be found at 1045 (05/02/2010 low).
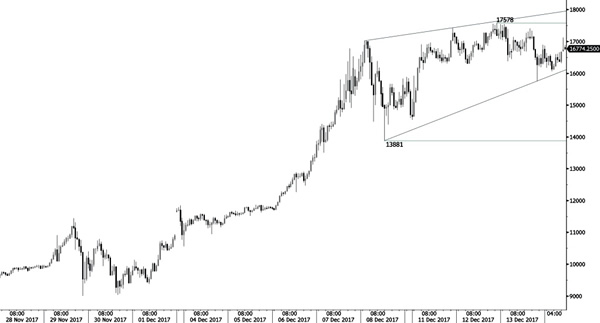
BITCOIN Bullish Triangle
Bitcoin's bullish momentum is far fom over. The technical structure has shown a tremendous positive short-term momentum. Hourly support is located below 14k (08/12/2017 low). Strong support stands very far at 2975 (22/08/2017 low). In the short-term, the digital currency should continue rising at levels unseen so far.
In the long-term, the digital currency has had an exponential growth. There are decent likelihood that the asset will reach $40'000 in 2018.
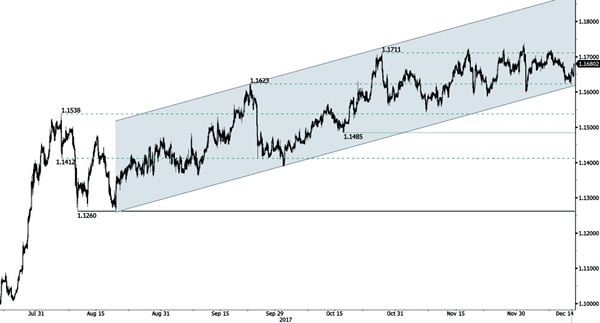
EUR/CHF Stalling Below 1.1700
EUR/CHF continues to push towards resistance area above 1.17 and support given at 1.1610 (27/10/2017 low). Expected to show continued increase.
In the longer term, the technical structure has reversed. Strong resistance is given at 1.20 (level before the unpeg). Yet, the ECB's QE programme is likely to cause persistent selling pressures on the euro, which should weigh on EUR/CHF. Supports can be found at 1.0184 (28/01/2015 low) and 1.0082 (27/01/2015 low).
EUR/GBP Sideways Price Action
EUR/GBP is trading mixed. The pair has failed to hold below broken support at 0.8791 (07/11/2017 low). Resistance is located at 0.8943 (27/11/2017 high). Expected to show further sideways trading.
In the long-term, the pair has largely recovered from recent lows in 2015. The technical structure suggests a growing upside momentum. The pair is trading above from its 200 DMA. Strong resistance can be found at 0.9500 (psychological level).
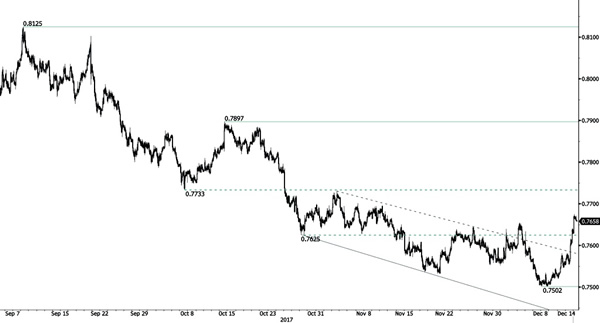
AUD/USD Bullish Move
AUD/USD's downside pressures have vanished. Hourly resistance is given at a distance at 0.7730 (02/11/2017 high). Support stands at 0.7502 (08/12/2017 low). Expected to push even higher.
In the long-term, the trend is turning positive. Key supports stands at 0.6009 (31/10/2008 low) . A break of the key resistance at 0.8164 (14/05/2015 high) is needed to invalidate our long-term bearish view.
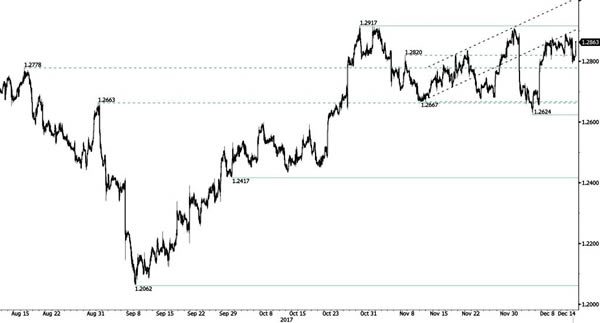
USD/CAD Stalling Below 1.29
USD/CAD has bounced back after testing hourly support lies at 1.2792 (13/12/2017 low). Hourly resistance stands at 1.2917 ( 27/10/2017 high). Expected to show further consolidation around 1.2900.
In the longer term, the pair has broken longterm support that can be found at 1.2461 (16/03/2015 low). Strong resistance is given at 1.4690 (22/01/2016 high). The pair is likely to head further lower.
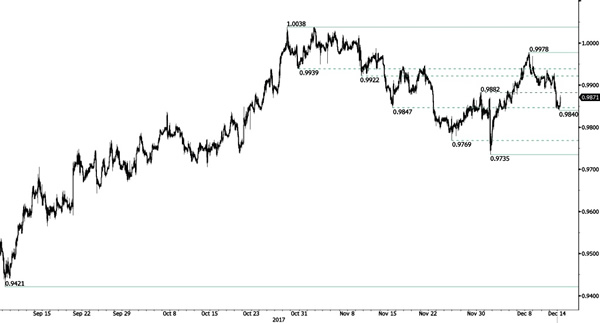
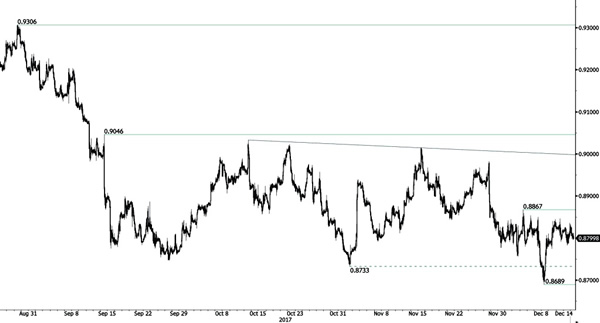
USD/CHF Sideways Price Action
USD/CHF is trading mixed. Yet, the technical structure indicates further downside risks. The pair has failed to hold consistently above the parity. Expected to go even lower.
In the long-term, the pair is still trading in range since 2011 despite some turmoil when the SNB unpegged the CHF. Key support can be found 0.8986 (30/01/2015 low). The technical structure favours nonetheless a long term bullish bias since the unpeg in January 2015.