Sample Category Title
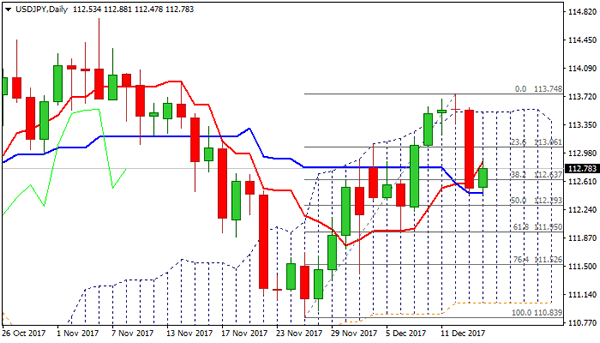
Technical Outlook: USDJPY – Bears Eye Targets At 112.30/111.95, Limited Correction To Precede
The pair stands deeply in daily cloud on Thursday and consolidating after previous day's strong fall (the biggest one-day loss since 22 Nov).
Bears found footstep at 112.46 where daily Kijun-sen contained Wednesday's post-Fed acceleration, with limited upside action seen ahead of fresh attempts lower as
Wednesday's long bearish candle continues to weigh.
Recovery was so far capped by broken converged 10/55SMA's which previously acted as strong support, with extended upticks expected to stall at 113.00 zone.
Fresh bearish acceleration through 112.46 handle would look for next targets at 112.30 (50% retracement of 110.83/113.74 / weekly cloud top) and 111.95 (Fibo 61.8% of 110.83/113.74) break of which would further inflate bears and signal an end of recovery phase from 110.83.
At the upside, daily cloud top marks key barrier (113.51) and only break here would neutralize downside threats and turn focus higher again.
Res: 112.88, 113.00, 113.51, 113.74
Sup: 112.46, 112.30, 111.95, 111.52
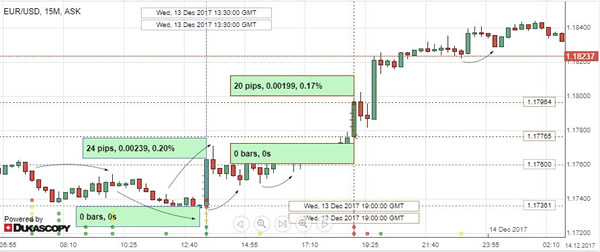
EUR/USD: US CPI, Fed Interest Rate Decision
The Euro strengthened against the US Dollar, as most of the releases matched expectations on Wednesday. The EUR/USD currency pair added 28 pips, to continue appreciation and reveal one more 22 pips jump, following the Fed interest rate decision.
The Labour Department stated that the US consumer prices slowed growth to 1.7% year-on-year in November, held down by a strong decrease in apparel prices and weak costs of healthcare, which is likely to determine the pace at which the Fed hikes rates next year. Later, the Federal Reserve announced its decision to raise rates to 1.50% from 1.25%, as widely anticipated, but kept future projections unchanged, despite a possible short-term jump amid Trump’s proposed cuts of tax.
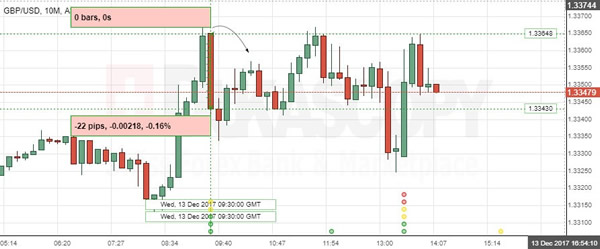
GBP/USD: UK Unemployment Rate
The Sterling fell sharply against the Greenback on the data showing lingering weakness in the UK employment growth. The GBP/USD exchange rate lost 22 pips to continue the wide-range fluctuation until the US reports put it back to the 1.3360 mark .
The number of employed people in the UK dropped again in October, indicating that employers were turning more cautious ahead of Brexit. Meanwhile, pay growth accelerated slightly, remaining lower than inflation. The Office for National Statistics reported that the unemployment rate held at historical low of 4.3%. The Bank of England hiked rates last month, expecting that stronger job market could boost wage growth, though today it is widely expected to keep rates on hold.
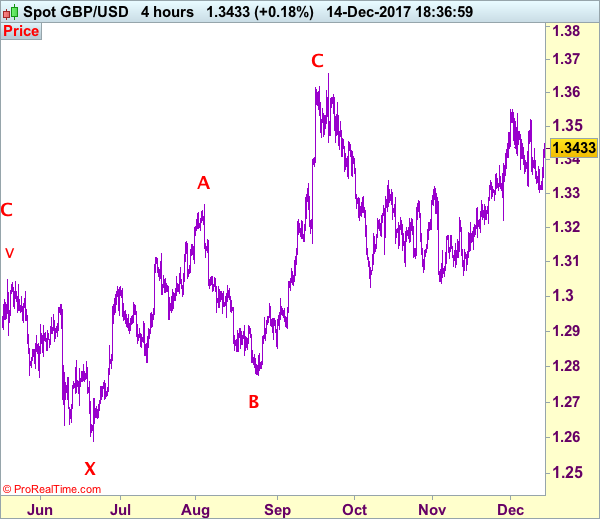
Trade Idea: GBP/USD – Stand aside
GBP/USD – 1.3427
New strategy :
Stand aside
Position: -
Target: -
Stop:-
As cable found good support at 1.3303 and has staged a strong rebound, suggesting low has possibly been formed there and upside risk remains for further gain to 1.3460-70, however, reckon resistance at 1.3521 would limit upside and bring further consolidation. Only a break of 1.3521 would suggest the correction from 1.3550 has ended, bring retest of this level later. Looking ahead, a break of 1.3550 would extend the rise from 1.3027 low to 1.3595-00, however, reckon recent high at 1.3658 (Sept high) would hold from here due to near term overbought condition, bring retreat later. Our preferred count is that (pls see the attached chart) the wave IV is unfolding as a complex double three (ABC-X-ABC) correction with 2nd wave B ended at 1.2774, hence 2nd wave C could have ended at 1.3658.
On the downside, whilst pullback to 1.3350-60 cannot be ruled out, said support at 1.3303 should remain intact, bring another rebound later. Only a drop below said support at 1.3303 would revive bearishness and extend the fall from 1.3550 for retracement of recent rise to 1.3250-60 but previous support at 1.3221 should remain intact, bring rebound later.
Our preferred count on the daily chart is that cable's rebound from 1.3500 (wave (A) trough) is unfolding as a wave (B) with A ended at 1.7043, followed by triangle wave B and wave C as well as wave (B) has ended at 1.7192, the subsequent selloff is the larger degree wave (C) which is still unfolding with minor wave (III) of larger degree wave 3 ended at 1.1986, hence wave (IV) correction is in progress which could either be a triangle wave (IV) of a complex formation but upside should be limited to 1.3500 and price should falter well below 1.4000, bring another decline in wave (V) of 3 for weakness to 1.1500, then 1.1200.
XAU/USD Analysis: Soars To 1,259.00
After forming an inverse head and shoulders pattern and bouncing off from the weekly S2 at 1,235.93 the yellow metal managed to advance by 1.23% against the buck. In daily perspective the surge the is expected to last until the rate makes a new rebound either from the 1,263.63 resistance level or from a combination of the 200-day SMA and the 38.2% Fibonacci retracement level at 1,268.00. However, through the day the soar is likely to be stopped by release of information on the American Core Retail Sales. In this sense, there is a need to take into account the resistance zone formed between the 1,259.00 and 1,259.32 marks and support zone located between the 1,254.00 and 1,253.62 levels, which are likely to squeeze the pair for some time.
USD/JPY Analysis: Falls To 50% Fibo At 112.45
Due to interest rate hike by the Federal Reserve, the currency exchange rate got a downside momentum, which lasted until the pair reached the last combined support level formed by the weekly S1 and the 50% Fibonacci retracement level at 112.45. A successful recovery of the buck looks unlikely, as the rate will need to cross a combination of the weekly PP, the 200-hour SMA and another 50% retracement level near the 113.00 mark. In addition to that, the northern side is strengthened by the falling 55- and 100-hour SMAs. From the opposite direction, the pair, in contrast, faces no notable support levels up until the 112.10 mark. In support of this assumption, majority in pending orders in 100-pip range are set to sell.
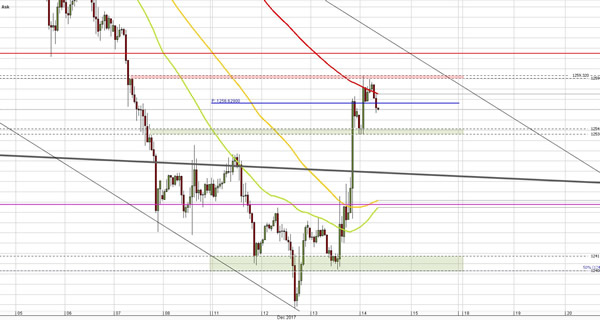
GBP/USD Analysis: Crosses 200-Hour SMA
Despite the pressure from three moving averages as well as from other technical indicators, the pair ended the day near the 1.3420 mark.
Today the cable is expected to continue the rally due to absence of any notable barriers on its way up until the 50% Fibonacci retracement level located at 1.3485. In case of appreciation of the buck, a combination of the weekly PP and the 200-hour SMA or the monthly PP and the 100-hour SMA should constrain the downfall.
However, these support and resistance barriers might be relatively easy broken due to the upcoming Bank of England meeting as well as release of information on the UK and US Retail Sales.
EUR/USD Analysis: Jumps By 44 Points Amid Rate Hike
As the currency rate was falling the last three weeks in a row, traders used the Federal Funds Rate hike to sell the Dollar and elevate the pair to the 1.1844 level. As long as market sentiment remains predominantly bearish the rate is expected to continue moving in southern direction. As for today, a deep plunge back to 1.1776 seems unlikely, as this road is obstructed by the weekly and monthly PP as well as the 200-hour SMA. From this perspective, the pair most probably will make another rebound and resume the upward movement towards the upper boundary of a medium-term descending channel. However, there is a need to take into account an effect from today’s ECB meeting and American data release, which are likely to alter the above scenario.
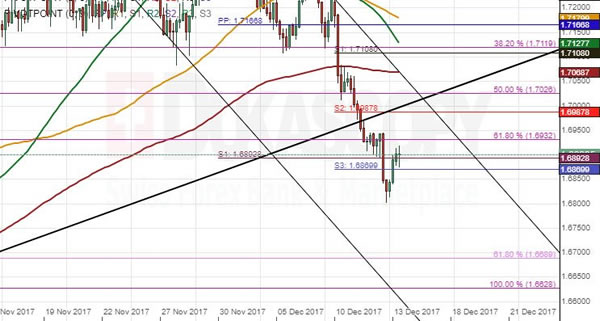
EUR/NZD 4H Chart: Going Down
The large scale situation on the EUR/NZD pair has not changed. However, there has been one notable development, as the pair has formed a new medium term channel down pattern.
The channel has guided the pair down to touch the 1.68 mark, and the decline is likely going to continue. The reason for that is the fact that the pair has passed a strong support cluster from the 1.6930 to 1.6870 levels.
As that cluster has been passed, the next notable support level is located below the 1.67 mark, where a long term 61.80% Fibonacci retracement level is located at.
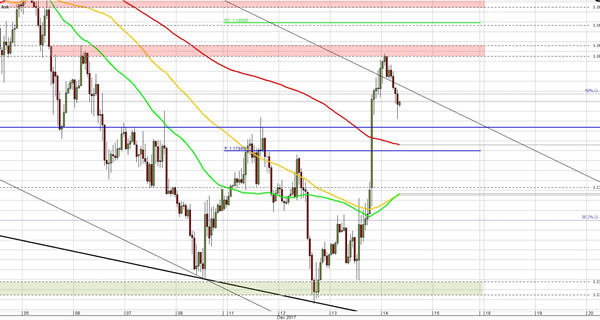
EUR/GBP 4H Chart: Breaks Support
The situation on the EUR/GBP has not changed. There is no real need to change the already drawn medium and large scale patterns. Although, there is a reason why a review is done.
The currency exchange rate has broken the support of a long term channel up pattern. The passing of the support was already expected, as the pair had bounced off the resistance of a more dominant channel down pattern.
Meanwhile, in regards to the short term one can observe that the pair is being kept flat by the weekly PP and will likely remain so until the resistance of the medium scale channel down pattern will force it