Sample Category Title
NZDUSD Intraday Analysis
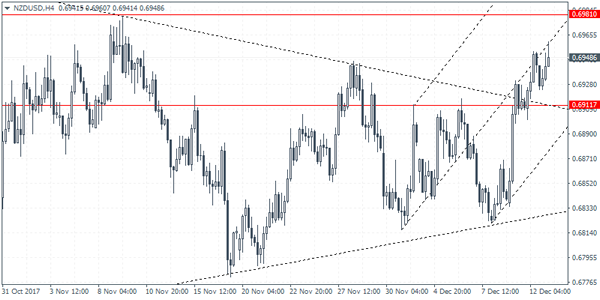
NZDUSD (0.6948): The New Zealand dollar extended gains for three consecutive days. Price action managed to remain supported above the short term price level of 0.6911. Resistance is seen at 0.6981 which could be the near term upside target in price. The breakout to the upside from the triangle consolidation pattern potentially suggests further scope for gains in NZDUSD. This will however change in the event that the kiwi slips back below the 0.6911 level. We expect to see support being formed near this level ahead of further gains towards 0.6981.
USDJPY Intraday Analysis
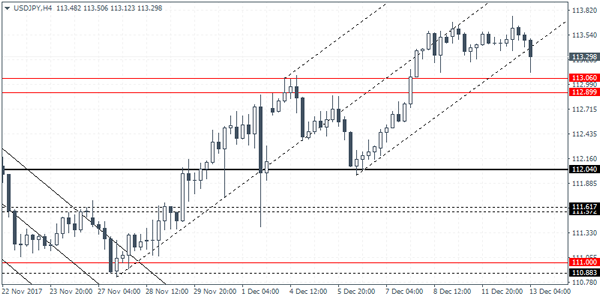
USDJPY (113.29): The USDJPY formed another doji pattern on the daily chart yesterday. A bearish close below the doji's low today could potentially signal further downside in price. USDJPY is seen trading just below the previously established resistance level of 114.31 - 114.07 region. To the downside, price is pending retest of the support level near 110.70. On the 4-hour chart, the immediate support near 113.06 - 112.90 remains in focus. A break down below this support could potentially turn USDJPY's bias to the downside as price will then likely slide towards the 112.05 level of support. To the upside, the gains could be limited towards the previously established resistance level.
EURUSD Intraday Analysis
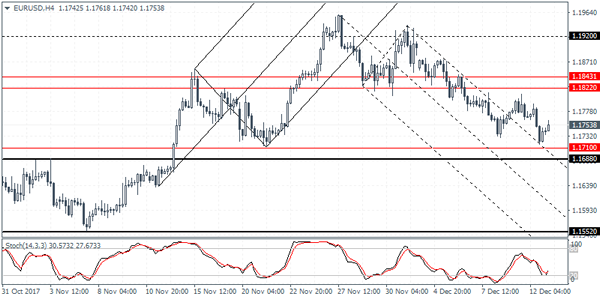
EURUSD (1.1753): The euro posted declines yesterday as the currency pair remains trading above the 1.1700 level of support. In the short term, we could expect to see a brief retest of this support level. On the 4-hour chart, price action posted a lower low but was seen finding support off the outer median line. A short term correction towards 1.1822 - 1.1843 is quite likely where resistance could be formed. The EURUSD could be seen maintaining the range within the resistance level mentioned and the support region near 1.1710 - 1.1700 level. A breakout below this support could potentially push EURUSD lower. This could see price action testing the November lows near 1.1552 support.
Trade Idea : USD/JPY – Buy at 112.90
USD/JPY - 113.43
Most recent candlesticks pattern : N/A
Trend : Near term up
Tenkan-Sen level : 113.35
Kijun-Sen level : 113.44
Ichimoku cloud top : 113.47
Ichimoku cloud bottom : 113.41
Original strategy :
Buy at 112.90, Target: 114.00, Stop: 112.55
Position : -
Target : -
Stop : -
New strategy :
Buy at 112.90, Target: 114.00, Stop: 112.55
Position : -
Target : -
Stop : -
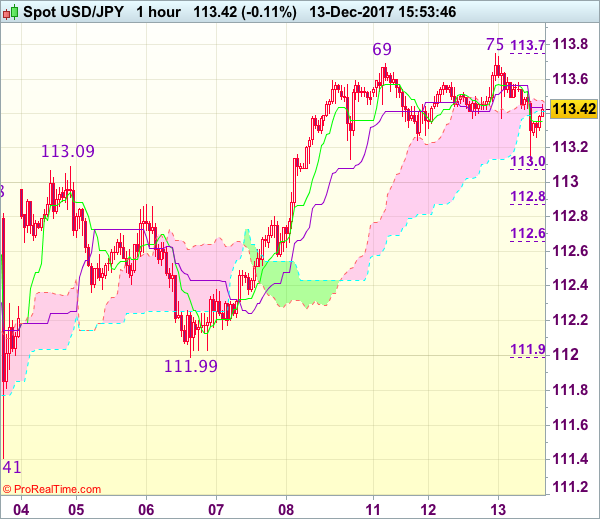
As the greenback has retreated after marginal rise to 113.75, suggesting consolidation below this level would be seen and pullback to 113.08-09 (38.2% Fibonacci retracement of 111.99-113.75 and previous resistance turned support) is likely, however, reckon 112.85-87 (50% Fibonacci retracement) would limit downside and bring another rise later, above said resistance at 113.75 would extend recent upmove from 110.84 low to resistance area at 113.91-114.07 but a sustained breach above this region is needed to signal early uptrend has resumed for headway towards 114.34.
In view of this, would not chase this rise here and would be prudent to buy dollar again on pullback as 112.85-87 should limit downside and bring another rise later. Below 112.66 (61.8% Fibonacci retracement of 111.99-113.75) would defer and risk test of 112.55-57 but only break of latter level would signal top is formed instead, bring subsequent fall to 112.20-25.
Traders Look To FOMC Meeting, Fed Set To Hike Rates
The U.S. dollar was seen trading mixed as investors gear up for the Fed meeting today. On Tuesday, economic data from the U.S. showed that the U.S. producer price index advanced 3.1% on the year in November. This was the biggest gain since January 2012. The price increase at factory gate stoked expectations that the consumer price index could come out stronger.
The November CPI data will be released today with forecasts showing a 0.4% increase on the month. The Fed's rate hike decision is also coming up. Expectation for a 25 basis points rate hike is almost certain. The Fed's projections for the year ahead and forward guidance will be key.
In the UK, the inflation data for November released yesterday showed that CPI accelerated 3.1% on the month. However, core CPI was steady, rising 2.7%.
The UK's monthly jobs data will be coming out today with forecasts showing a modest increase in wages to 2.5%.
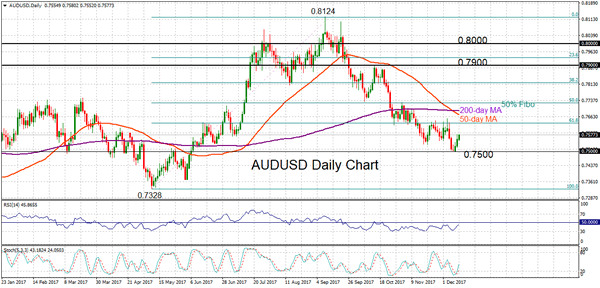
AUDUSD In A Downtrend, Bearish Below 200-Day MA
AUDUSD is clearly in a downtrend since falling from the multi-year high of 0.8124 to the 0.7500 area. The crossover of the 50-day moving average below the 200-day MA highlights the bearish outlook.
Immediate downside pressure has eased and the market has moved out of oversold conditions, as both the RSI and stochastics have risen out of their respective extreme levels.
The psychological level at 0.7500 has proven to be a strong support level and AUDUSD has been trading above it since June. This support is expected to remain firm and limit further downside for now. If it fails to hold, then prices could extend lower to re-test the May 9 low at 0.7328.
Looking at the Fibonacci retracement level of the upleg from 0.7328 to 0.8124, the market needs to rise above the 61.8% Fibonacci (0.7631) to develop stronger upside momentum and this would open the way towards the 200-day MA (0.7690) and 50% Fibonacci (0.7725).
AUDUSD has stalled its downtrend for now and is neutral in the near term. But the pair remains vulnerable with no change in the bearish outlook unless it can reclaim the 0.7900 handle.
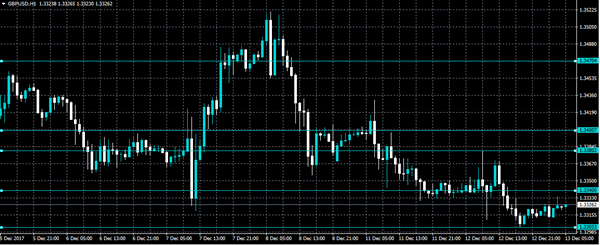
GBPUSD Still Bearish Below 1.3340 Level
The British pound has fallen to the 1.3303 level against the U.S dollar, but managed to recover marginally overnight, on U.S political woes. The GBPUSD pair is currently trading around the 1.3326 level, after crashing below the 1.3340 support level yesterday. In the upcoming European trading session, the UK economy releases key wage data for the month of November. Any uptick in UK wage growth, or wage inflation will be taken as bullish for the pound, ahead of tomorrow’s Bank of England monetary policy decision.
The GBPUSD pair remains intraday bearish while trading below the 1.3340 technical level, strong support is found at the 1.3303 and 1.3268 levels.
Should GBPUSD buyers push price-action above the 1.3340 technical level, further buying towards the 1.3380 and 1.3400 levels seems possible.
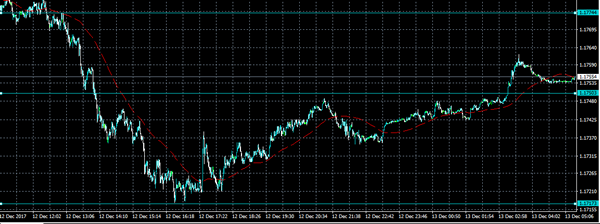
EURO Still Intraday Bearish Below 1.1774 Level
The euro currency earlier failed to break below the key 1.1713 support level against the U.S dollar, as the pair quickly reversed direction during yesterday’s late U.S session. The EURUSD quickly slumped to 1.1717, but moved back above the 1.1750 level, after the greenback dipped following the U.S Democrat party winning the in the state of Alabama yesterday. The victory weakens the U.S Republican parties position in the U.S Senate and is weighing on the intraday sentiment around the U.S dollar. Traders now look to the U.S CPI reading for the month of November, ahead of the FED interest rate decision.
The EURUSD pair remains intraday bearish while price-action trades below the 1.1774 level, downside support is now found at the 1.1750 and 1.1717 technical levels.
If the EURUSD pair starts to move above the 1.1774 technical level, intraday buyers may start to target towards the 1.1790 and 1.1813 resistance levels.
Wednesday Is Fed Day
A deluge of market-moving events will make headlines on Wednesday, as all eyes turn to the Federal Reserve’s final policy meeting of the year.
Action begins at 06:00 GMT with a German report on the wholesale price index. One hour later, the German government will report on the final November consumer price index (CPI). Annual inflation in Europe’s largest economy is forecast to come in at 1.8% year-over-year. The harmonized index of consumer prices (HICP) is expected to hit the same level.
The United Kingdom will release headline employment data at 09:30 GMT. The number of unemployed workers is expected to rise by 3,200 in November following an increase of 1,100 the month before.
Unemployment, as calculated by the International Labour Organisation (ILO) standard, is expected to dip to 4.2% in the three months through October from 4.3%.
Meanwhile, average hourly earnings are expected to rise 2.5% annually in the three months through October.
Shifting gears to the Eurozone, Brussels will report on industrial production and employment at 10:00 GMT. Output in the 19-nation Eurozone is expected to rise 3.5% annually in October despite registering no growth month-on-month.
Overall employment is also expected to rise 0.4%.
In the United States, the Labor Department will issue its official consumer price index (CPI) at 13:00 GMT. Annual inflation in the world’s largest economy is expected to rise 2.2% annually in November, following a 2% gain the previous month.
The Federal Open Market Committee (FOMC) will deliver its rate verdict at 19:00 GMT. Policymakers are widely expected to vote in favour of a 25 basis-point increase in the federal funds rate, bringing it to 1.5%.
The Fed will also release a revised summary of economic projections covering GDP, unemployment, and inflation. It will be the last projection under the guidance of Chairwoman Janet Yellen. In February, she will be replaced by Fed governor Jerome Powell.
EUR/USD
Europe’s common currency tumbled to three-week lows on Tuesday, as investors turned their attention to the US Fed. The EUR/USD exchange rate was in recovery mode Wednesday, where it gained 0.2% to 1.1756. Its short-term outlook will be governed by the upcoming Fed decision.
GBP/USD
Cable has declined sharply in recent sessions, as sterling gave back some of last week’s rapid gains. GBP/USD was last seen trading around 1.3330. Wednesday is expected to be an active session for the pair amid UK data and Fed policy.
USD/CAD
The Canadian dollar has been on a sharp downward spiral for nearly a week after the Bank of Canada tempered expectations about future rate hikes. The USD/CAD approached 1.2900 on Tuesday, but has since tempered its gains. Prices were last seen consolidating around 1.2852, having declined 0.2% from the previous close.

Daily Wave Analysis: EUR/USD, GBP/USD Retest Key And Vital Support Zone
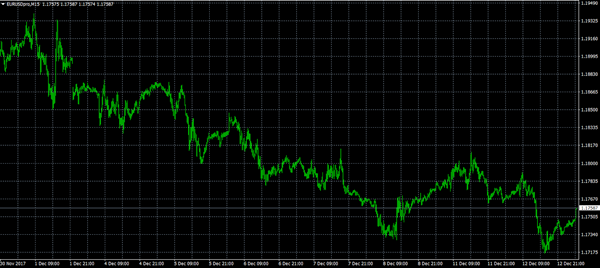
Currency pair EUR/USD
The EUR/USD tested the 61.8% Fibonacci zone of wave 2 vs 1 and price used the support level for a bullish bounce. This could be part of an ABC (blue) flat correction within wave X (purple) of a larger wave 2 (pink) if price bounces at the resistance trend line (red). Alternatively a break below the 138.2% Fib invalidates the wave B (blue) and could indicate a bearish move towards 1.1650 and 1.16.
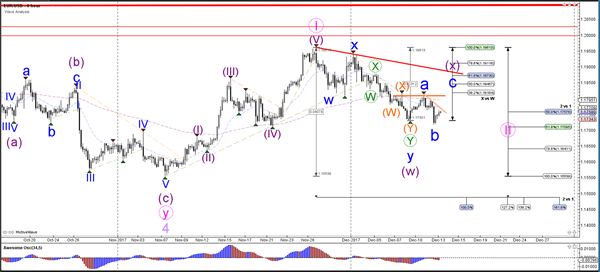
The EUR/USD could build a bullish ABC (blue) flat correction within wave X (purple). Price seems to be bouncing at the 127.2% Fib of wave B (blue) and could move towards the 61.8% Fib of wave X (purple).
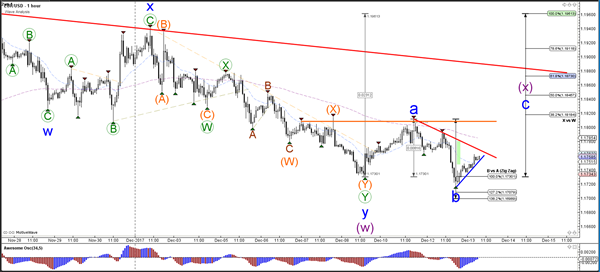
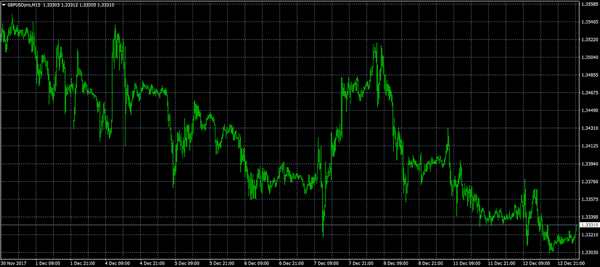
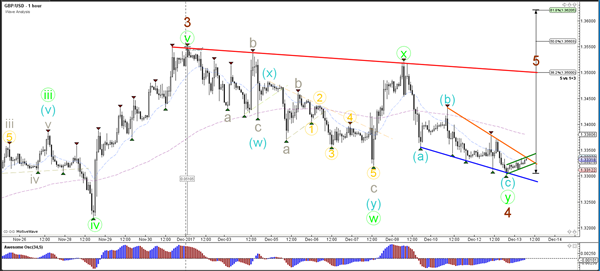
Currency pair GBP/USD
A GBP/USD is showing choppy and corrective price action which is probably part of a wave 4 (brown). The wave 4 (brown) pattern is valid as long as price stays above the top of wave 1 (blue).
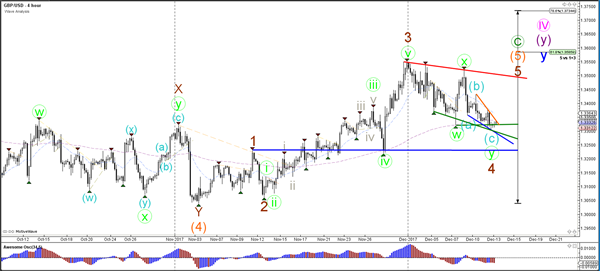
The GBP/USD is building a falling wedge reversal chart pattern which could indicate a potential bullish breakout if price manages to break above the resistance trend line (orange). A break below the support trend line (blue) could indicate a bearish breakout.
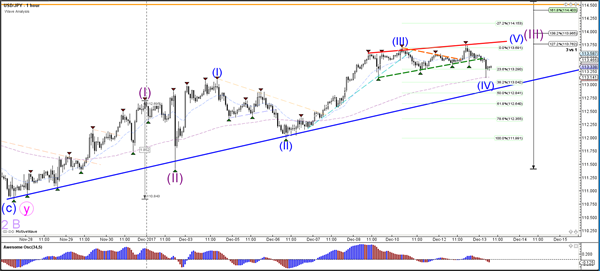
Currency pair USD/JPY
The USD/JPY could be a in wave 3 (purple) if price manages to stay above the support trend line (blue) and 50% Fibonacci level. The alternative scenario is that price is building a wave C rather than a wave 3.
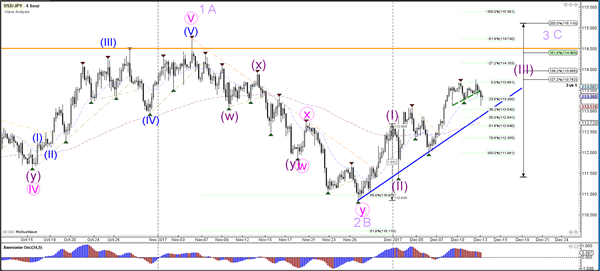
The USD/JPY broke the trend lines but is still moving sideways. Price seems to be respecting the Fibonacci levels of wave 4 (blue) but a break below the 50% Fib would make a wave 4 unlikely.