Sample Category Title
GBP/USD Awaits Fed Decision, US CPI And UK Employment Change
Key Highlights
- The US Dollar and British Pound awaits key risk events today such as the fed interest rate decision, US CPI and UK’s employment report.
- GBP/USD is forming a contracting triangle on the 4-hour chart with support at 1.3300 and resistance near 1.3480.
- UK’s Claimant Count is forecasted to post a change of 3.2K in Nov 2017.
- The feds are likely to increase interest rates from 1.25% to 1.50% for the third time in 2017.
GBPUSD Technical Analysis
Today, there are many major economic releases lined up in the US and the UK. Both the US Dollar and British Pound would be impacted, especially the GBP/USD pair.
Technically, the pair held the 1.3300 support zone recently and is currently forming a contracting triangle on the 4-hour chart with support at 1.3300 and resistance near 1.3480.
The pair recently failed near the 23.6% Fib retracement level of the last drop from the 1.3520 high to 1.3310 low. Moreover, there are many barriers on the upside such as 1.3400 and 1.3450 waiting to stop the current upside move.
The overall price action is negative for GBP/USD heading into key risk events today. Only a successful close above 1.3400 followed by the 50% Fib retracement level of the last drop from the 1.3520 high to 1.3310 low would be a positive sign.
In the mentioned scenario, the pair might even attempt an upside break above the triangle resistance at 1.3480. On the flip side, if buyers fail to contain losses below 1.3300, the pair could decline sharply towards 1.3200.
Impact of Fed Interest Rate Decision
Today, Fed interest rate decision could be a game changer for the US Dollar. The central bank is expected to increase interest rates from 1.25% to 1.50% for the third time in 2017.
If they fail to deliver, it could be a bullish opening for GBP/USD. On the other hand, should they raise rates, the pair might come under a bearish pressure.
Recently, the UK saw the release of the CPI numbers for Nov 2017. The result was better than the forecast of +3.0% as there was a rise of 3.1% in the CPI (YoY). In terms of the monthly change, there was a rise of 0.3%, better than the last +0.1%.
U.S. Inventory Draw Spurs Crude Oil Recovery
Key Points:
- Crude oil inventories decline by 2.89 million barrels.
- Brent and WTI prices increased 36, and 50 cents, respectively.
- Higher prices likely to bring about additional U.S. shale oil production.
Crude Oil prices have continued to feel the pinch of increased rig counts as additional supply has constrained the recent rally. However, an inventory draw of 2.89 million barrels caught the market by surprise and has helped to largely stabilise markets overnight. Subsequently, West Texas Intermediate (WTI) rose around 36 cents on the news whilst Brent was up 50 cents. However, it remains to be seen if the result was simply an anomaly or part of a new trend in lower stocks.
Interestingly, the American Petroleum Institutes (API) forecast actually exceeded the official numbers with the industry association estimating that there had been a fall of 7.4 million barrels last week. This is a relatively staggering number and far exceeds what most analysts were expecting by a factor of at least two. Subsequently, there is plenty of evidence that the current production levels are being eroded by increased domestic demand.
In fact, there is plenty of evidence of growing global demand for oil which bodes well for prices given that the EIA is also projecting that domestic production will rise to 10.02 million bpd in 2018. However, it remains uncertain how OPEC will react to both the increased shale oil production and creeping crude prices.
The reality is that OPEC has largely changed their tune over the past six months and there is likely plenty of political will to curb further production with the view to stabilising prices above $65.00 a barrel. In fact, compliance has been relatively high for the present OPEC production caps which have surprised me greatly given that previous agreements have typically been fraught with cheating across the board.
Subsequently, we could see crude oil prices moving back towards a multi-year high in the ensuing months. However, the medium term to long term view is relatively different with higher prices likely to drive additional shale oil production activity as well as inward investment in the sector. So it is difficult to see Brent prices persisting above $65.00 a barrel in the long run. In fact, advancements in shale oil techniques will only undermine the oil cartels power in the long run and bring about further re-balancing in a market that is already moving away from Middle Eastern dominance.
GBP/JPY Daily Outlook
Daily Pivots: (S1) 150.89; (P) 151.31; (R1) 151.63; More...
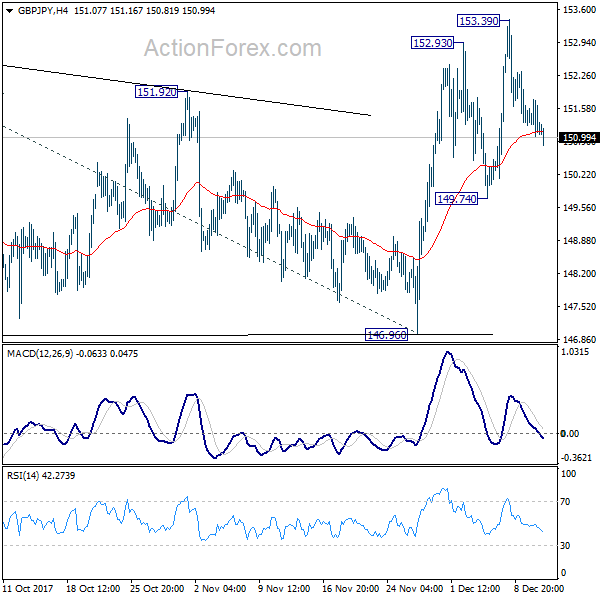
GBP/JPY's corrective fall from 153.39 is still in progress and intraday bias remains neutral. As long as 149.74 support holds, outlook remains bullish in the cross. Break of 153.39 will resume the medium term up trend and target 61.8% projection of 139.29 to 152.82 from 146.96 at 155.32. However, break of 149.74 will dampen our bullish view and turn bias back to the downside for 146.96 key support instead.
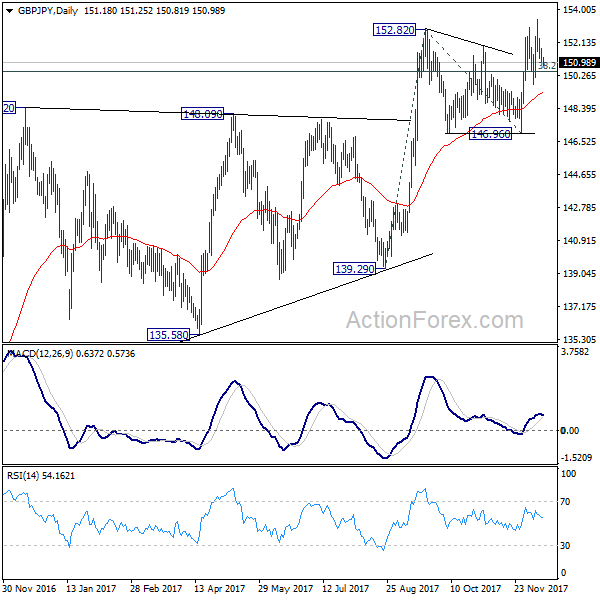
In the bigger picture, current development suggests that medium term rise from 122.36 is resuming. Sustained trading above 38.2% retracement of 196.85 to 122.36 at 150.43 will carry long term bullish implications. In that case, GBP/JPY could target 61.8% retracement at 167.78. However, break of 146.96 support will indicate rejection from 150.43 key fibonacci level. And the three wave corrective structure of rebound from 122.36 will argue that larger down trend is resuming for a new low below 122.26.
EUR/JPY Daily Outlook
Daily Pivots: (S1) 132.96; (P) 133.35; (R1) 133.71; More....
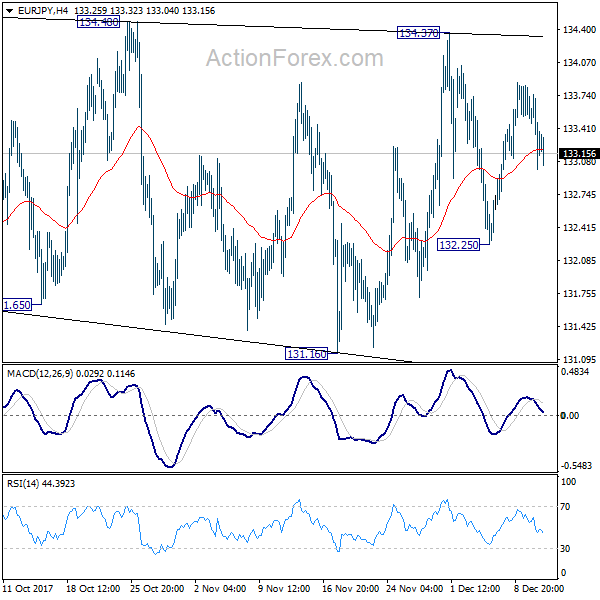
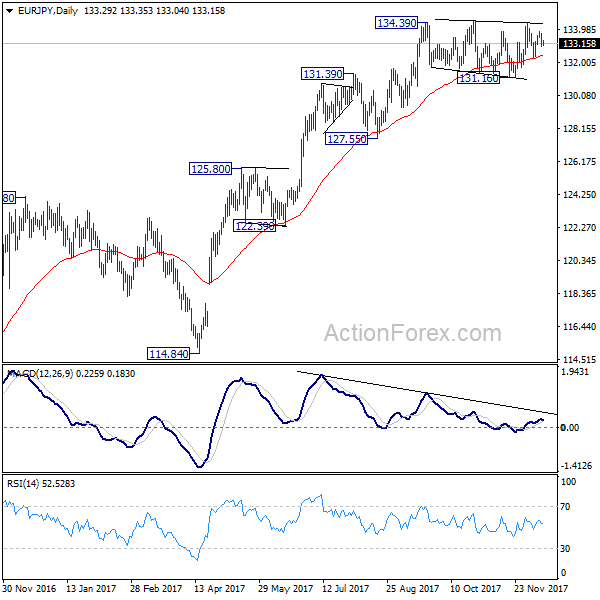
EUR/JPY is still confined in range of 131.16/134.48 and intraday bias remains neutral. Further rise is expected as long as 131.16 support holds. Decisive break of 134.48 will resume medium term rise from 114.84 and target 141.04 resistance next. However, sustained break of 131.16 support will now indicate near term trend reversal and turn outlook bearish for 127.55 key support.
In the bigger picture, medium term rise from 109.03 (2016 low) is seen as at the same degree as the down trend from 149.76 (2014 high) to 109.03 (2016 low). Sustained break of 61.8% retracement of 149.76 to 109.03 at 134.20 will pave the way to key long term resistance zone at 141.04/149.76. However, break of 127.55 support will suggest medium term topping and will turn outlook bearish for deeper fall back to 114.84/124.08 support zone at least.
EUR/AUD Daily Outlook
Daily Pivots: (S1) 1.5480; (P) 1.5570; (R1) 1.5622; More....
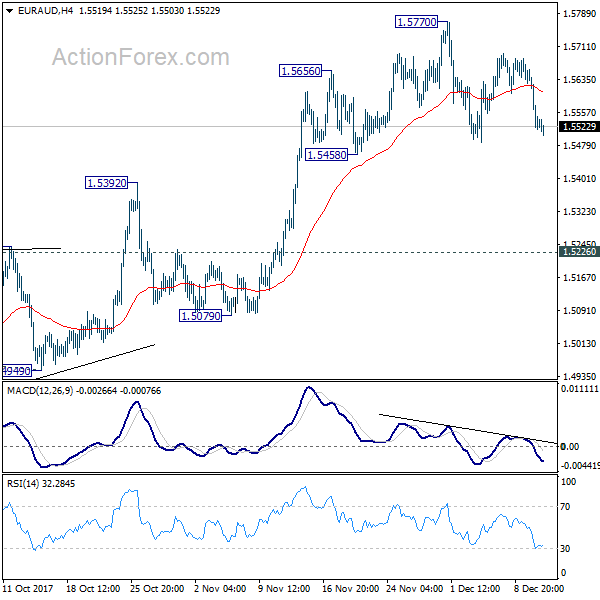
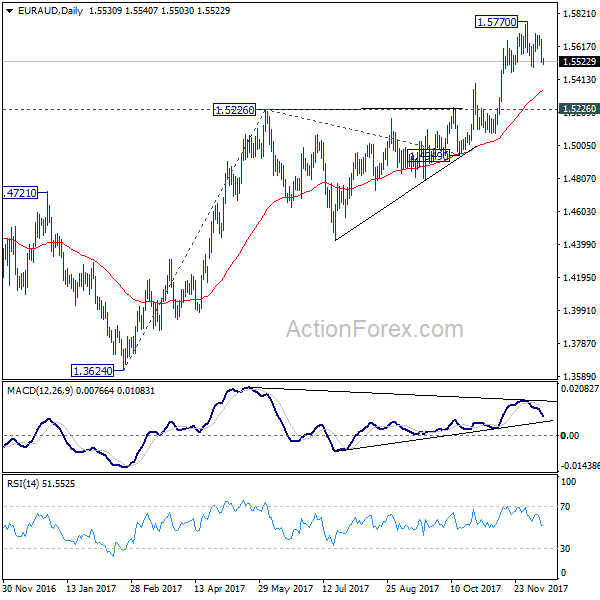
EUR/AUD's correction from 1.5770 is still extending and deeper fall could be seen. But downside should be contained above 1.5226 key support to bring rally resumption. On the upside, break of 1.5770 will resume the medium term rise and target 61.8% projection of 1.3624 to 1.5226 from 1.4949 at 1.5939 first.
In the bigger picture, we're holding on to the view that corrective decline from 1.6587 medium term top (2015 high) has completed at 1.3624. Rise from 1.3624 is expected to extend to retest 1.6587. We'll hold on to this bullish view as long as 1.5226 resistance turned support holds. Firm break of 1.6587 will resume long term rise from 1.1602 (2012 low).
EUR/GBP Daily Outlook
Daily Pivots: (S1) 0.8788; (P) 0.8817; (R1) 0.8843; More...
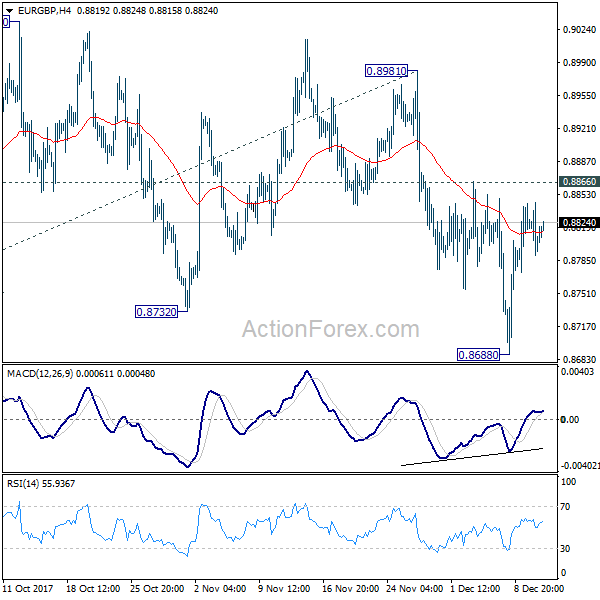
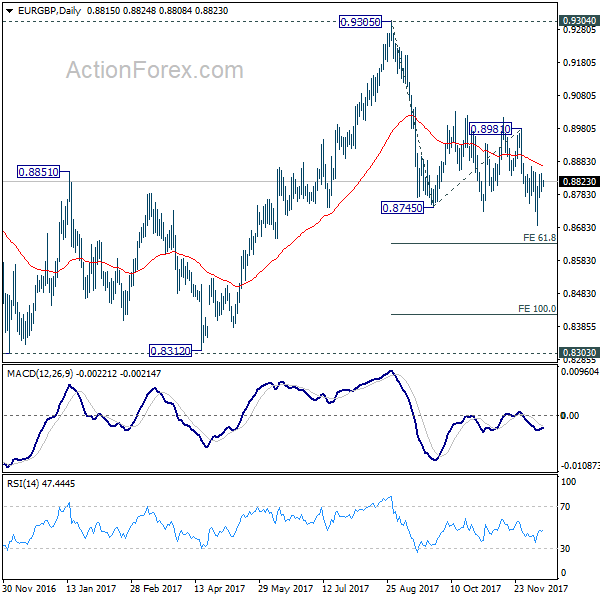
Intraday bias in EUR/GBP stays neutral at this point. With 0.8866 resistance intact, near term outlook remains mildly bearish and deeper fall is expected. Break of 0.8688 will extend the fall from 0.9305 and target 61.8% projection of 0.9305 to 0.8745 from 0.8981 at 0.8468 first and then 100% projection at 0.8151 next. However, break of 0.8866 resistance will indicate near term reversal and turn bias back to the upside for 0.8981 resistance instead.
In the bigger picture, there are various ways to interpret price actions from 0.9304 high. But after all, firm break of 0.9304/5 is needed to confirm up trend resumption. Otherwise, range trading will continue with risk of deeper fall. And in that case, EUR/GBP could have a retest on 0.8303. But we'd expect strong support from 0.8116 cluster support (50% retracement of 0.6935 to 0.9304 at 0.8120) to contain downside.
EUR/CHF Daily Outlook
Daily Pivots: (S1) 1.1614; (P) 1.1649; (R1) 1.1674; More...
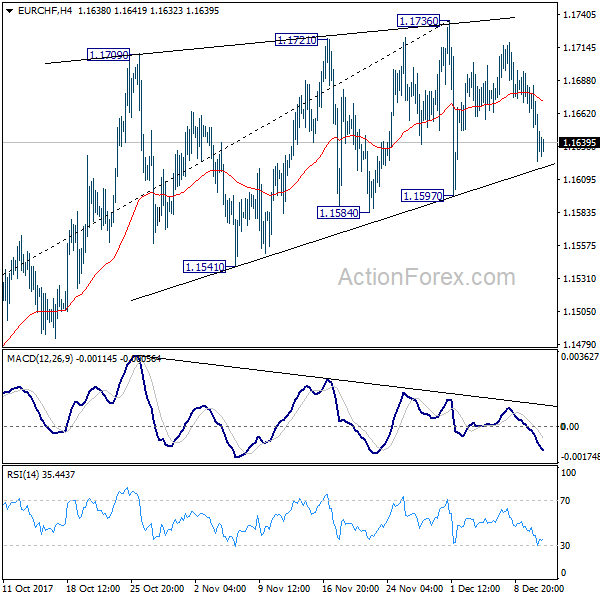
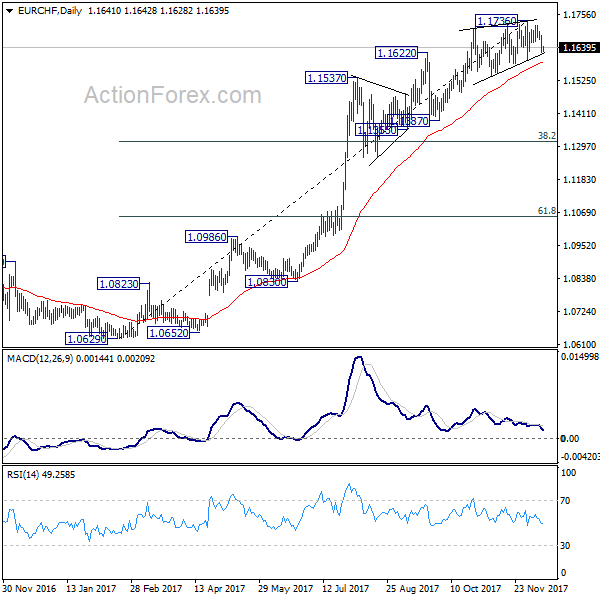
EUR/CHF dips notably but is held above 1.1597 support. Intraday bias remains neutral first. We maintained the view that EUR/CHF is close to topping, if not formed. This is supported by persistent bearish divergence condition in 4 hour MACD, and rising wedge like structure. On the downside, break of 1.1597 support will will be a strong sign of trend reversal and should turn outlook bearish for 38.2% retracement of 1.0629 to 1.1736 at 1.1313.
In the bigger picture, while a medium term top could be around the corner, there is no change in the larger outlook. That is, long term rise from SNB spike low back in 2015 is still in progress and would extend. As long as 1.1198 resistance turned support holds, we'll hold on to this bullish view and expect another to prior SNB imposed floor at 1.2000. Though, we'll reassess the outlook if 1.1198 is firmly taken out.
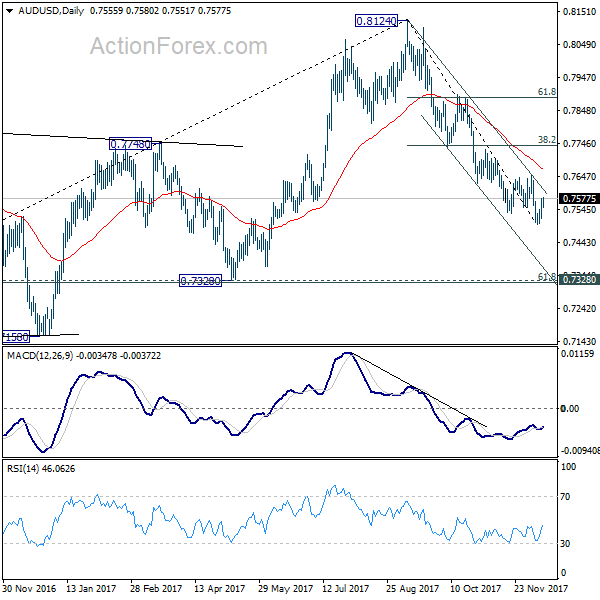
AUD/USD Daily Outlook
Daily Pivots: (S1) 0.7525; (P) 0.7552; (R1) 0.7586; More...
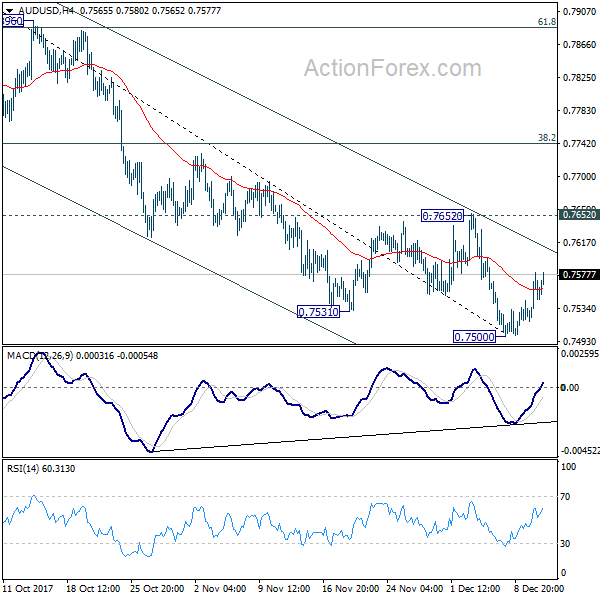
AUD/USD recovers further today but it's seen as staying in corrective trading above 0.7500. Intraday bias remains neutral at this point. Upside of recovery should be limited below 0.7652 resistance to bring fall resumption. Break of 0.7500 will extend the fall from 0.8124 and target 0.7322/8 cluster support next. Nonetheless, decisive break of 0.7652 will indicate near term reversal and bring stronger rebound back to 0.7732 support turned resistance.
In the bigger picture, corrective rise from 0.6826 medium term bottom is likely completed at 0.8124, after hitting 55 month EMA (now at 0.8029). Decisive break of 0.7328 key cluster support (61.8% retracement 0.6826 to 0.8124 at 0.7322) will confirm. And in that case, long term down trend from 1.1079 (2011 high) will likely be resuming. Break of 0.6826 will target 61.8% projection of 1.1079 to 0.6826 from 0.8124 at 0.5496. This will now be the favored case as long as 0.7732 near term resistance holds.
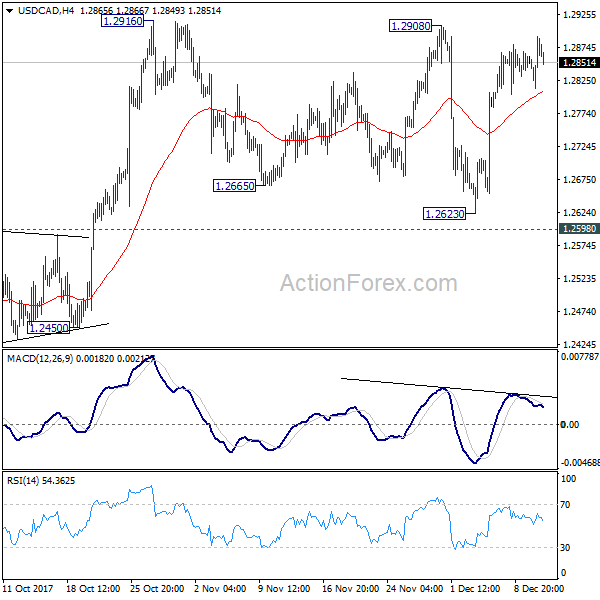
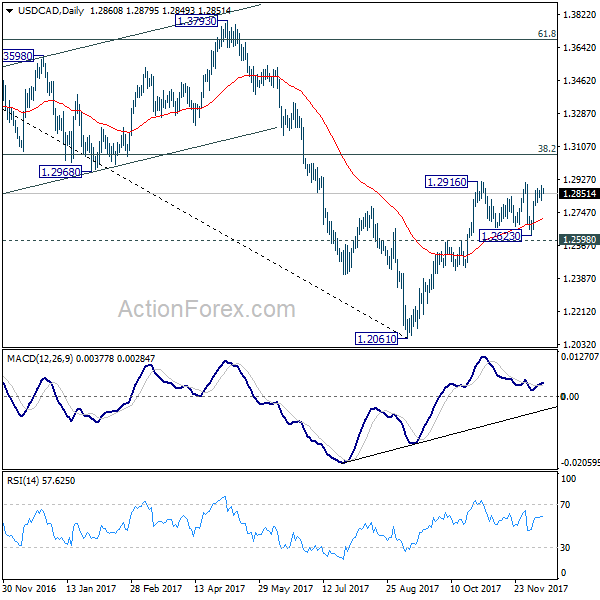
USD/CAD Daily Outlook
Daily Pivots: (S1) 1.2821; (P) 1.2856; (R1) 1.2901; More....
USD/CAD is staying in range below 1.2916 and intraday bias remains neutral first. On the upside, firm break of 1.2916 will resume whole rally from 1.2061 and target 1.3065 medium term fibonacci level next. In case of another fall, we'd expect strong support from 1.2598 to contain downside and bring rebound. However, sustained break of 1.2598 will argue that rebound from 1.2061 has completed after hitting 55 week EMA (now at 1.2888). Near term outlook will be turned bearish in this case.
In the bigger picture, USD/CAD should have defended 50% retracement of 0.9406 (2011 low) to 1.4689 (2016 high) at 1.2048. And with 1.2048 intact, we'd favor the case that fall from 1.4689 is a correction. Rise from 1.2061 medium term bottom should now target 38.2% retracement of 1.4689 to 1.2061 at 1.3065. Firm break there will target 1.3793 key resistance next (61.8% retracement at 1.3685). We'll now hold on to this bullish view as long as 1.2450 support holds.
USD/JPY Daily Outlook
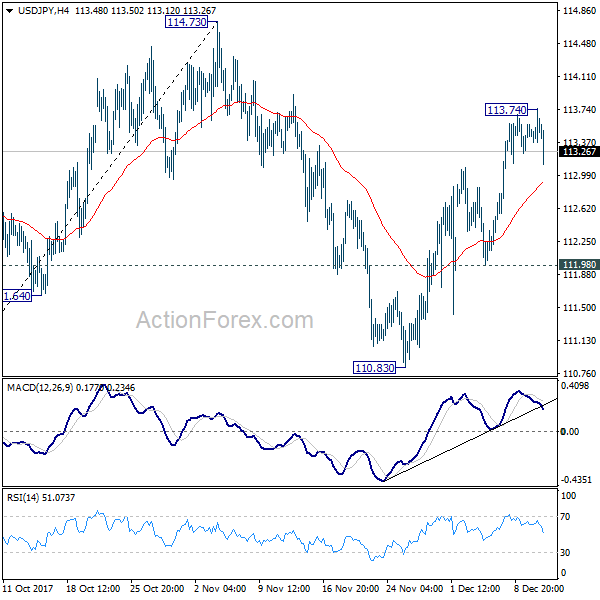
Daily Pivots: (S1) 113.36; (P) 113.55; (R1) 113.74; More...
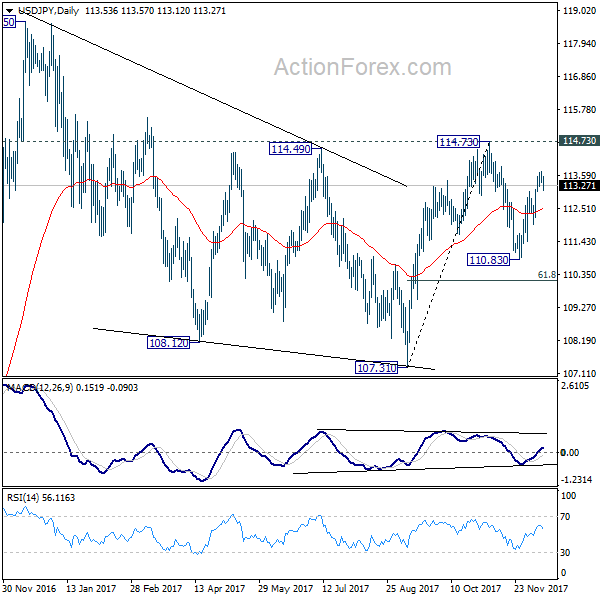
USD/JPY edged higher to 113.74 but quickly retreated. Intraday bias remains neutral first. As long as 111.98 support holds, further rally is expected in the pair. On the upside, above 113.68 will extend the rise from 110.83 to 114.73 resistance first. Decisive break there will resume whole rise from 107.31. More importantly, that will confirm completion of medium term correction from 118.65 at 107.31. In that case, retest of 118.65 should be seen next. However, break of 111.98 support will extend the correction from 114.73 with another fall, possibly to 61.8% retracement of 107.31 to 114.73 at 110.14 before completion.
In the bigger picture, we're holding on to the view that correction from 118.65 is completed a 107.31. And medium term rise from 98.97 (2016 low) is resuming. Sustained break of 114.73 should affirm our view and send USD/JPY through 118.65. However, break of 107.31 will dampen this will and extend the medium term fall back to 98.97 low.