Sample Category Title
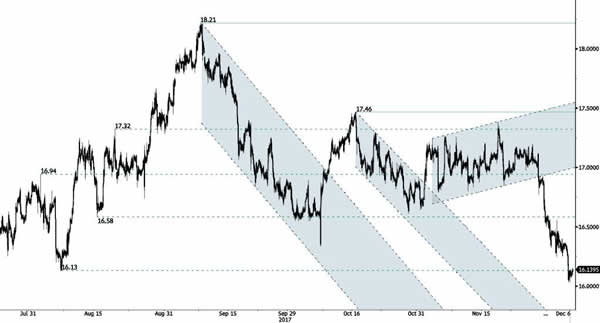
SILVER Collapsing
Silver is heading lower. Hourly support can be found at 16.13 (07/08/2017 low). Hourly resistance is given at 17.46 (13/10/2017 high). Expected to keep pushing lower.
In the long-term, the trend is rater negative. Further downsides are very likely. Resistance is located at 25.11 (28/08/2013 high). Strong support can be found at 11.75 (20/04/2009).
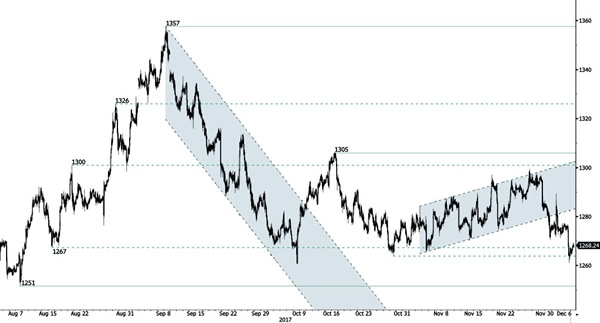
GOLD Ready For Further Downside
Gold is pushing lower. The technical structure confirms the end of the consolidation phase. Support lies at a distance at 1251 (08/08/2017 high). Resistance is located at 1288 (20/10/2017).
In the long-term, the technical structure suggests that there is a growing upside momentum. A break of 1392 (17/03/2014) is necessary ton confirm it, A major support can be found at 1045 (05/02/2010 low).
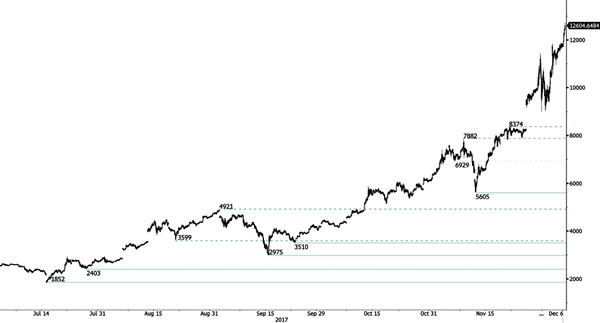
BITCOIN $15’000 Before Year-End
Bitcoin is still consolidating below 12k. The technical structure shows a tremendous positive short-term momentum. Hourly support is located at 9000 (29/11/2017 low). Strong support stands very far at 2975 (22/08/2017 low). In the shortterm, the digital currency should continue rising.
In the long-term, the digital currency has had an exponential growth. There are decent likelihood that the asset will reach $40'000 in 2018.
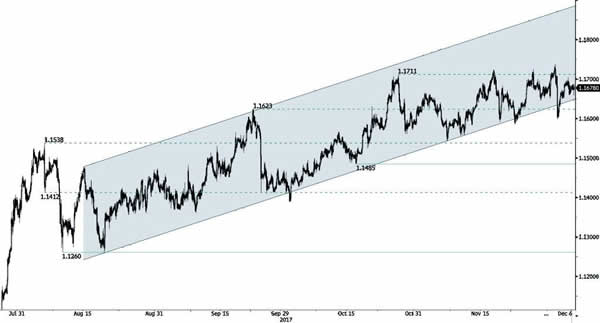
EUR/CHF Monitoring The 1.17 Level
EUR/CHF continues to push towards resistance area above 1.17 and support given at 1.1610 (27/10/2017 low). Expected to show continued increase.
In the longer term, the technical structure has reversed. Strong resistance is given at 1.20 (level before the unpeg). Yet, the ECB's QE programme is likely to cause persistent selling pressures on the euro, which should weigh on EUR/CHF. Supports can be found at 1.0184 (28/01/2015 low) and 1.0082 (27/01/2015 low).
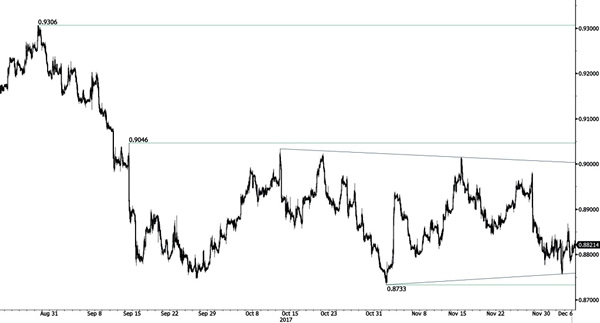
EUR/GBP Ready For Further Downside
EUR/GBP is heading lower. The pair has failed to hold above broken support at 0.8791 (07/11/2017 low). Resistance is located at 0.8943 (27/11/2017 high). Expected to go even lower.
In the long-term, the pair has largely recovered from recent lows in 2015. The technical structure suggests a growing upside momentum. The pair is trading above from its 200 DMA. Strong resistance can be found at 0.9500 (psychological level).
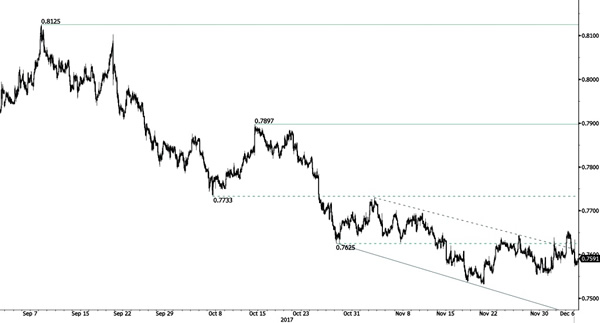
AUD/USD Sideways Price Action
AUD/USD's momentum is reversing showing that downside pressures are weakening. Hourly resistance is given at a distance at 0.7897 (13/10/2017 high). Expected to show renewed pressures towards key support at 0.7535 (22/06/2017 low).
In the long-term, the trend is turning positive. Key supports stands at 0.6009 (31/10/2008 low) . A break of the key resistance at 0.8164 (14/05/2015 high) is needed to invalidate our long-term bearish view.
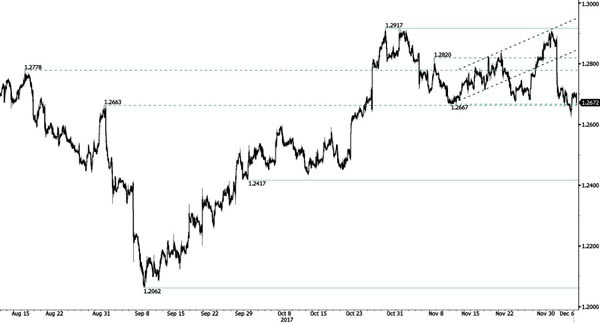
USD/CAD Breaking Support At 1.2667
USD/CAD is testing hourly support lies at 1.2667 (10/11/2017 low). Hourly resistance stands at 1.2917 ( 27/10/2017 high). Expected to show further bearish pressures.
In the longer term, the pair has broken longterm support that can be found at 1.2461 (16/03/2015 low). Strong resistance is given at 1.4690 (22/01/2016 high). The pair is likely to head further lower.
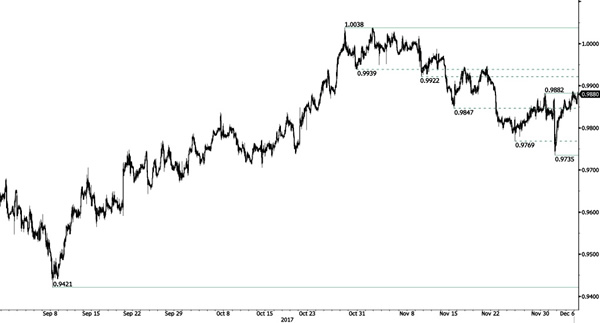
USD/CHF Stalling Below 0.9900
USD/CHF has been very volatile lately. The technical structure indicates further downside risks. The pair has failed to hold consistently above the parity. The road is wide-open for further decline.
In the long-term, the pair is still trading in range since 2011 despite some turmoil when the SNB unpegged the CHF. Key support can be found 0.8986 (30/01/2015 low). The technical structure favours nonetheless a long term bullish bias since the unpeg in January 2015.
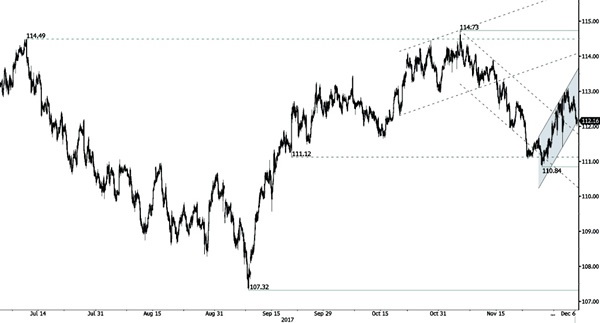
USD/JPY Short-Term Bullish Momentum
USD/JPY keeps on pushing higher. The pair has strongly bounced back. Hourly resistance is given at 112.70 (30/11/2017 high).
We favor a long-term bearish bias. Support is now given at 99.02 (10/08/2013 low). A gradual rise towards the major resistance at 125.86 (05/06/2015 high) seems unlikely. Expected to decline further support at 93.79 (13/06/2013 low).
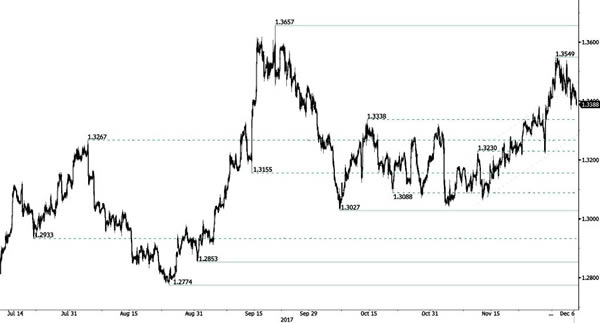
GBP/USD Short-Term Bearish Consolidation
GBP/USD has been trading lower over the past few days but the technical structure indicates an extension of bullish momentum. Support is given at a distance at 1.3027 (06/10/2017 low). Expected to show continued increase towards resistance at 1.3657 (20/09/2017 high).
The long-term technical pattern is reversing. The Brexit vote had paved the way for further decline. Long-term support can be found at 1.1841 (07/10/2017 low). Long-term resistance given around 1.35 is at stake and indicates a long-term reversal in the negative trend. Yet, it is very unlikely at the moment.