Sample Category Title
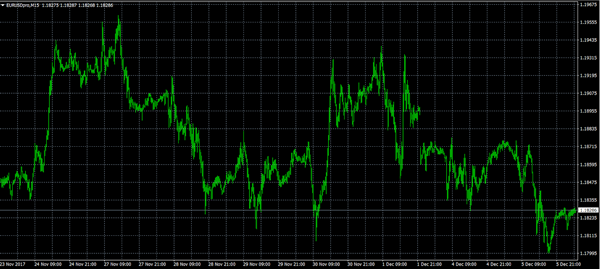
EUR/USD Analysis: Breaks Junior Ascending Channel
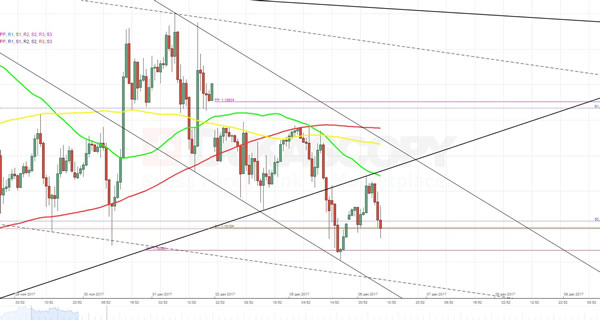
In line with expectations, a combination of the 55-, 100- and 200-hour SMAs pushed the rate downwards, leading to dissolution of the one-month long ascending channel. The plunge happened despite release of worse than expected non-manufacturing data, which means that markets are mainly focused on talks between the House and Senate about tax reform. Most probably these expectations will continue to nourish the buck through the whole week. On hourly chart this scenario nicely matches with a minor descending channel whose existence was additionally confirmed by a rebound from the monthly PP at 1.1806. Accordingly, today the pair is trying to return back to the 1.1866 level. The most likely scenario is that this attempt will be neutralized by one of the above MAs.
Daily Technical Analysis: EURUSD, GBPUSD, USDJPY, USDCHF
EURUSD
The EURUSD had a bearish momentum yesterday broke below the bullish channel as you can see on my H1 chart below. This fact is a serious threat to the bullish phase, but note that we still need a clear break below 1.1800 to confirm that the bullish phase is no longer valid, testing 1.1690 region. The bias is bearish in nearest term. Immediate resistance is seen around 1.1850 – 1.1870 area. A clear break back above that area could lead price to neutral zone in nearest term but would keep the bullish phase intact testing 1.1925 – 1.1960 region. Overall I remain neutral.
GBPUSD
The GBPUSD attempted to push lower yesterday bottomed at 1.3370 but closed higher at 1.3441. The bias is neutral in nearest term. Immediate support is seen around 1.3370. A clear break below that area could trigger further bearish pressure testing 1.3330 but overall I remain bullish and any downside pullback should be seen as a good opportunity to buy. Immediate resistance is seen around 1.3480. A clear break above that area could trigger further bullish pressure testing 1.3550 region.
USDJPY
The USDJPY was indecisive yesterday. The bias is neutral in nearest term. Overall I remain neutral but still prefer a bearish scenario at this phase as a part of the bearish pin bar scenario printed on daily chart on November 06. Immediate resistance is seen around 113.00/20 area which remains a good place to sell with a tight stop loss as a clear break above that area could trigger further bullish pressure retesting 114.50 region. Immediate support is seen around 112.25. A clear break below that area could trigger further bearish pressure testing 111.65 region.
USDCHF
The USDCHF continued its bullish momentum yesterday but still struggling around 0.9875 resistance area, which remains a good place to sell with a tight stop loss as a clear break above that area could trigger further bullish pressure testing 0.9940 region. The bias remains bullish in nearest term. Immediate support is seen around 0.9850. A clear break below that area could lead price to neutral zone in nearest term testing 0.9818 – 0.9780 region. Overall I remain neutral.
Technical Outlook: WTI Oil Price At The Back Foot Ahead EIA Crude Stocks Report
WTI oil price edged lower on Wednesday after Tuesday's action was directionless and ended in Doji candle, despite bigger than expected draw in crude oil stocks (5.48 million barrels vs 4.1 million barrels f/c) API report showed. Fresh easing today comes on speculation that EIA crude inventories report, due later today, will show build in gasoline and gasoline supplies. Near-term price action is holding between 20/10 SMA's ($57.13/$57.81 respectively) which mark initial support/resistance points. Fresh bears are pressuring 20SMA support and sustained break lower to generate bearish signal for test of next significant supports at $56.75 (29 Nov higher low) and $56.41 (Fibo 61.8% of $54.80/$59.02). Conversely, sustained lift above 10SMA would improve the sentiment.
Res: 57.55, 57.82, 58.31, 58.86
Sup: 57.13, 56.75, 56.41, 55.80
Vultures Circle Precious Metals
The still heavy long positioning in the U.S. precious metals futures are about to have their metals tested if the charts are anything to go by.
Gold
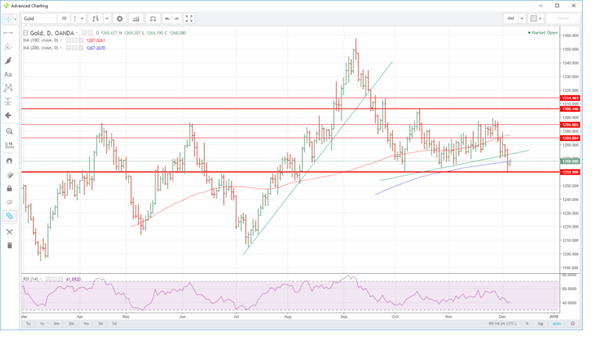
Long-suffering bullish gold traders had more reason to worry overnight, as they looked up into the sky and saw the vultures circling over their positioning. Despite a flattening of the U.S. yield curve, gold could not make any gains; instead, it fell 15 dollars to a low of 1261.00 before rising slightly to 1266.00 to gasp for air.
To say that the technical picture for gold this morning is ominous would be an understatement. Gold fell through trendline support at 1272.00, and then the 200-day moving average at 1267.25, both of which form resistance today. Gold stopped just shy of the long-term support at 1260.00 before its unconvincing recovery. A break of this level may be the straw that breaks the camel's back for structural long positioning and in turn could trigger a rush for the exit door.
Traders will be eyeing potential dollar strength nervously as we head into Friday's payrolls data followed by next week's FOMC. If this pushes gold over the 1260.00 cliffs, the technical picture suggests gold may not find many friends until the 1200.00 regions.
Silver
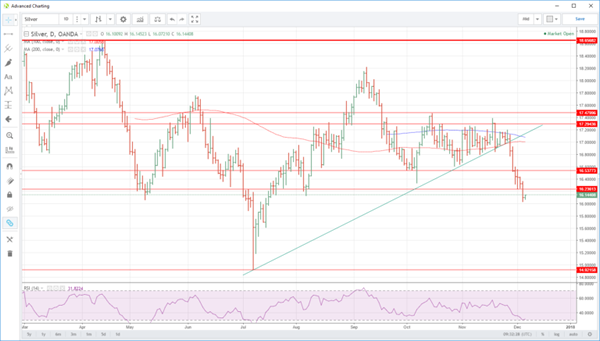
If the vultures are circling gold, then with silver, they are already feasting on the carcass. Silver broke its long-term support line at 17.0000 last week and has continued its downward spiral unabated ever since. In the process leaving it's 100 and 200-day moving averages above as a distant memory.
Silver has managed the barest of dead cat bounces today in Asia, trading slightly of the overnight lows at 16.1450. Resistance resides at 16.2360 initially followed by 16.5380.
The technical picture looks grim below. Silver will have support at 16.0000 initially, thereafter there is nothing but clear air until the 14.9200 area to arrest its decline.
The only glimmer of hope on silver's technical picture is that its Relative Strength Index (RSI) is pushing into very oversold territory. Unless the tone of the markets changes though, this may mean only temporary salvation but does imply that the 16.0000 support should be tough to break in the short-term.
GBP/USD Elliott Wave Analysis
GBP/USD – 1.3373
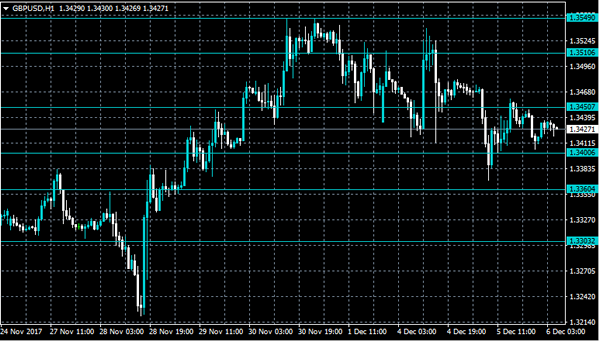
Although cable found renewed buying interest at 1.3221 and rallied to 1.3550, the subsequent retreat suggests consolidation below this level would be seen and as long as said resistance hold, mild downside bias is for at least a retracement of recent rise, hence weakness to 1.3300-10 would be seen, however, break of said support at 1.3221 is needed to signal top has been formed at 1.3550, bring further fall towards 1.3250-60 later.
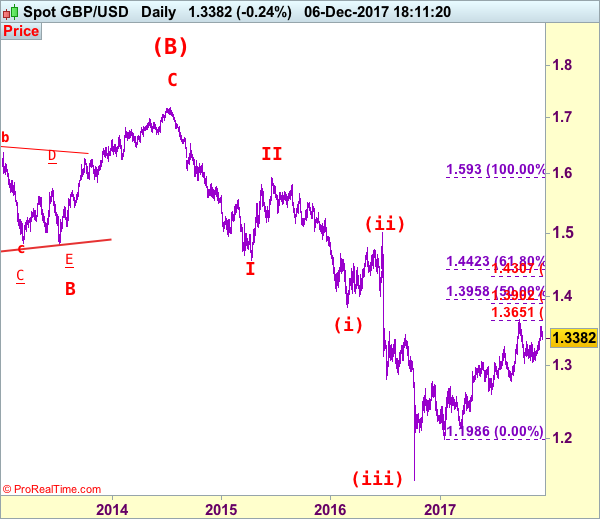
Our preferred count on the daily chart is that cable's rebound from 1.3500 (wave (A) trough) is unfolding as a wave (B) with A ended at 1.7043, followed by triangle wave B and wave C as well as wave (B) has possibly ended at 1.7192, below support at 1.4232 would add credence to this count, then further fall to 1.4000 level would follow but reckon downside would be limited to 1.3655 support and price should stay above previous support at 1.3500.
On the upside, whilst initial recovery to 1.3400-10 cannot be rude out, reckon 1.3470-80 would limit upside and bring another retreat later. Above said resistance at 1.3550 would abort and signal the rise from 1.3027 is still in progress for gain to 1.3595-00 but break there is needed to confirm early upmove has resumed for retest of 1.3658 resistance first.
Recommendation: Sell at 1.3470 for 1.3270 with stop below 1.3570.
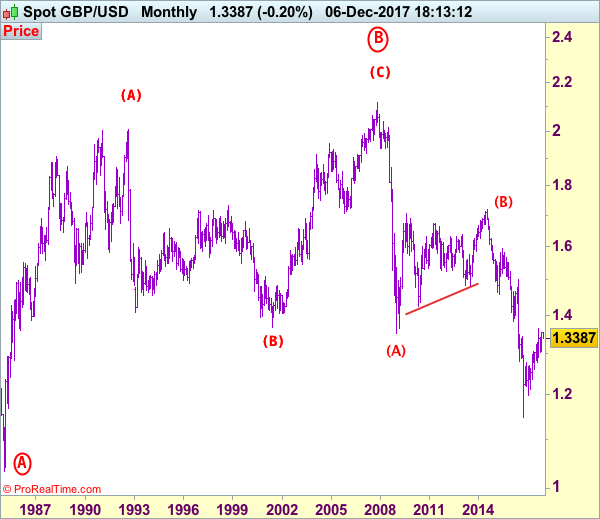
Longer term - Cable's rise from 1.0520 (Feb 1985) to 2.0100 (September 1992) is seen as [A], the decline to 1.3682 is labeled as (B) and (C) wave rally has ended at 2.1162 (9 Nov, 2007) which is also the top of larger degree wave B with circle. The selloff from there is a 5-waver with wave (A) ended at 1.3500 (23 Jan 2009), wave (B) itself is labeled as A: 1.6733, triangle wave B: 1.4813 and wave C as well as top of wave (B) ended at 1.7192 (2014), hence the selloff from there is an impulsive wave (C) with wave I : 1.4566, wave II 1.5930, an extended wave III is unfolding and already exceeded our downside target at 1.3500 and 1.3000, hence weakness to 1.2500 and possibly 1.2000 cannot be ruled out, however, price should stay well above psychological level at 1.0000.
GBPUSD Still Bearish Below 1.3450 Level
The British pound remains under downside pressure against the U.S dollar, as UK political uncertainty hurts the GBPUSD pair. After falling to 1.3367 on Tuesday, sterling recovered quickly but was swiftly rejected by technical selling around the 1.3450 resistance level, during the U.S session. Price-action on the GBPUSD pair currently trades around the 1.3420 level, ahead of an EU press conference later today. The press conference will be discussing the progress made on the UK and EU on Brexit negotiations, with the Irish border issue remaining a contentious issue.
Should the GBPUSD pair move below the 1.3400 level, further downside towards the 1.3360 and 1.3303 levels appears likely.
If GBPUSD buyers can hold price-action above the 1.3450 technical level again, further upside towards the 1.3510 and 1.3549 levels seems most likely.
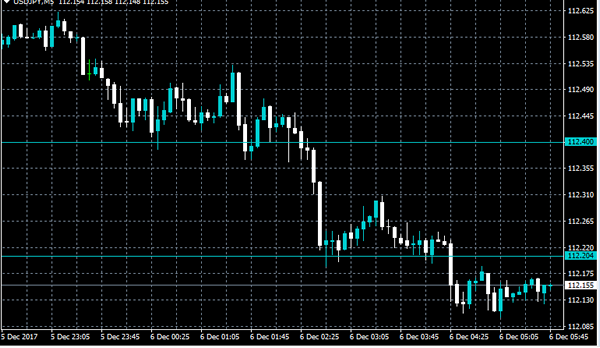
USDJPY Strongly Bearish Below 112.20 Level
The U.S dollar has moved sharply lower against the Japanese yen during the Asian trading session, hitting 112.10, as Japanese stocks slide. The USDJPY pair has been hit by risk-risk-off sentiment, with the Nikkei225 down over 2 percent on the day, continuing the decline seen in U.S stocks and bond yields on Tuesday. Price-action currently trades below the key 112.20 level, ahead of the release of the ADP jobs report, which is expected to show that the U.S economy created 185,000 private sector jobs in November.
The USDJPY pair remains strongly bearish while trading below the 112.20 technical level, intraday sellers may look to test the 111.90 and 111.58 technical levels.
If push price-action on the USDJPY pair moves above the 112.20 technical level, price-action may move towards the 112.40 and 112.70 resistance levels.
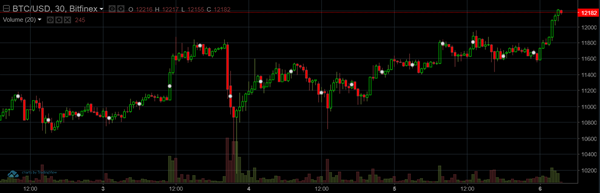
BITCOIN Smashes Another Record As Prices Cross $12,000
Bitcoin surged to new highs on Wednesday, as prices crossed $12,000 for the first time ahead of the planned launch of BTC futures this weekend.
The BTC/USD exchange rate rose nearly 4% to $12,200, where it was trading near session highs. The world’s no. 1 digital currency has added nearly 20% to its value over the past five days.
At present values, bitcoin is capitalized at $209 billion, according to CoinMarketCap. That represents roughly 57% of the total cryptocurrency market cap. At the time of writing, 17 other cryptos had a market valuation of at least $1 billion.
Prices are being pushed higher by the news that the CBOE Futures Exchange will launch its bitcoin futures contract this Sunday. By doing so, it will become the first major exchange to list a BTC derivates product.
CME Group will launch its very own bitcoin futures product on 18 December. Meanwhile, Nasdaq is also reportedly developing its own futures product for next year.
North America To Drive Headlines On Wednesday
North American markets will get plenty of attention on Wednesday, as traders evaluate fresh US jobs numbers and the final interest rate decision of the year from the Bank of Canada.
Action begins at 07:00 GMT with a report on German factory orders. Orders for manufactured goods are forecast to fall 0.3% in October, following a 1% increase the month before. However, that should still be good enough for a year-over-year gain of 7%.
Later in the morning, Switzerland will release the November consumer price index (CPI), a key barometer of inflation. CPI is forecast to flatline in November, translating into year-over-year growth of 0.9%.
On the monetary policy front, European Central Bank (ECB) official Yves Mersh is scheduled to deliver a speech at 10:30 GMT.
The North American session kicks off with the ADP private payrolls report. The monthly release could show the creation of 185,000 private sector jobs in November, following a net gain of 235,000 the month before. The official nonfarm payrolls report is due 48 hours later and is expected to show another month of solid jobs growth.
North of the border, the Bank of Canada (BOC) will deliver its final interest rate decision of the year on Wednesday. Policymakers are widely expected to stand pat for a second consecutive month as the Canadian economy adjusts to back-to-bate rate hikes. The benchmark lending rate is therefore expected to hold steady at 1%.
Earlier in the day, the Australian government reported a smaller than expected rise in third quarter GDP, signaling stronger headwinds for the domestic economy. The Australian economy expanded 0.6% in the third quarter, following an upwardly revised gain of 0.6% the previous quarter, the state-run statistics bureau said. Analysts in a median estimate called for a gain of 0.7%.
In annual terms, the Australian economy expanded 2.8%, which was higher than the Q2 rate but slightly below the consensus forecast of 3%.
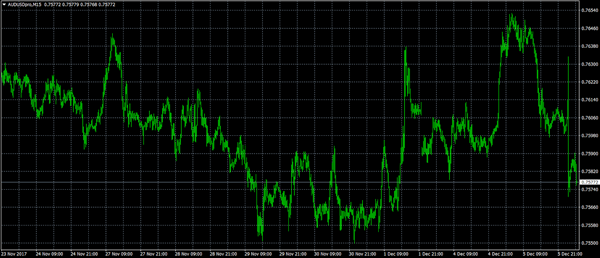
AUD/USD
The Australia dollar slipped back below 0.7600 US cents on Wednesday following the GDP report. The AUD/USD was last down 0.4% at 0.7583, which is a stark reversal from Tuesday’s highs near 0.7660. The Aussie is now struggling to maintain support at 0.7570. On the opposite side of the spectrum, resistance is likely seen near the Tuesday high.
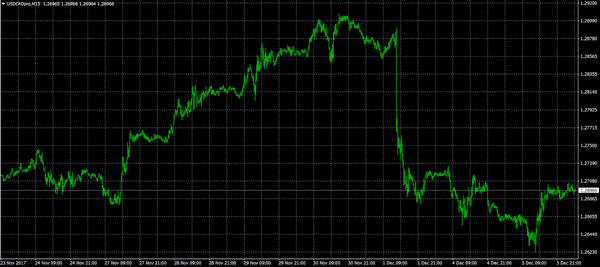
USD/CAD
The USD/CAD attempted at a recovery Tuesday, but prices fell short of the 1.2700 level. The pair had regained momentum early Wednesday, where it was trading at 1.2699. The BOC statement could hold the key to the next move in the USD/CAD.
EUR/USD
The euro made another sharp down move against the dollar on Wednesday, with prices falling 0.6% to 1.1830. The pair is showing weakness below 1.1840, putting it on a collision course with the 1.1800 support level. On the flipside, resistance is found at 1.1900.
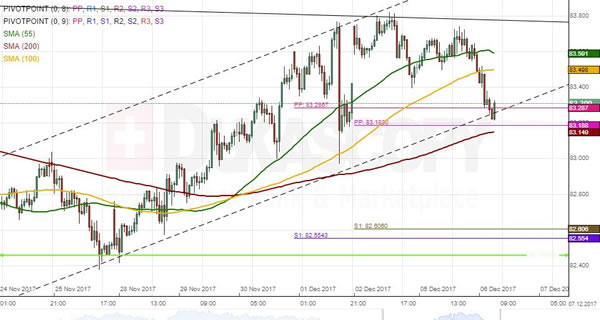
SGD/JPY 1H Chart: Rate Tests Short-Term Channel
A pattern that has dominated the SGD/JPY currency pair since late April is an ascending wedge. It seems that the maturity of this pattern could be reached within the following weeks, thus pointing to a possible breakout south. In the short term, the Singapore Dollar bounced off the upper wedge boundary early in November and has since edged lower; thus, another formation—a more chaotic channel down—is apparent on the chart. This pattern is guiding the pair towards the lower wedge boundary in the 82.60/83.00 area. The given channel is expected to dominate, thus pointing to weakening during the following week. The nearest support is the 200-hour SMA, the weekly and monthly PPs circa 83.20. The Singapore Dollar might hinder near this mark, but should eventually breach it and approach the weekly and monthly S1s at 82.60.