Sample Category Title
Trade Idea Wrap-up: EUR/USD – Sell at 1.1865
EUR/USD - 1.1805
Most recent candlesticks pattern : N/A
Trend : Near term down
Tenkan-Sen level : 1.1820
Kijun-Sen level : 1.1822
Ichimoku cloud top : 1.1856
Ichimoku cloud bottom : 1.1820
Original strategy :
Sell at 1.1900, Target: 1.1800, Stop: 1.1935
Position : -
Target : -
Stop : -
New strategy :
Sell at 1.1865, Target: 1.1765, Stop: 1.1900
Position : -
Target : -
Stop : -
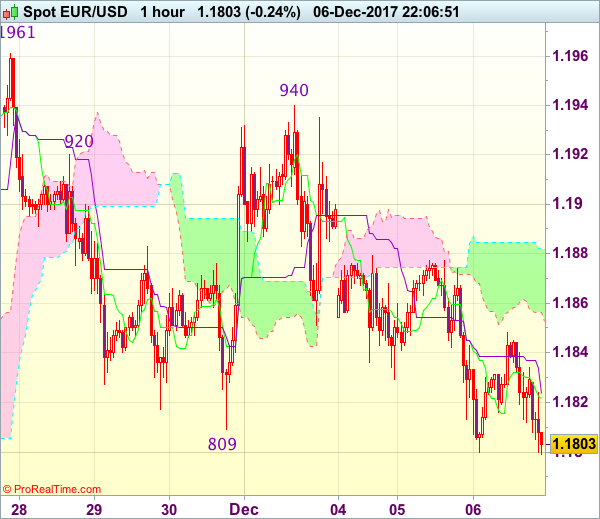
As the single currency has fallen again after brief recovery, adding credence to our bearish view that the erratic decline from 1.1961 top (last week’s high) is still in progress and downside bias remains for further weakness to to 1.1770 and possibly towards support at 1.1736 but near term oversold condition should limit downside and price should stay above previous key support at 1.1713.
In view of this, we are looking to sell euro on recovery as 1.1870-75 should limit upside and bring another decline. Above 1.1900 would risk test of last Friday’s high at 1.1940 but only break there would revive bullishness, bring retest of 1.1961 later.
Trade Idea Wrap-up: USD/JPY – Hold long entered at 112.10
USD/JPY - 112.28
Most recent candlesticks pattern : N/A
Trend : Near term up
Tenkan-Sen level : 112.16
Kijun-Sen level : 112.43
Ichimoku cloud top : 112.64
Ichimoku cloud bottom : 112.25
Original strategy :
Bought at 112.10, Target: 113.30, Stop: 111.75
Position : - Long at 112.10
Target : - 113.30
Stop : - 111.75
New strategy :
Hold long entered at 112.10, Target: 113.30, Stop: 111.75
Position : - Long at 112.10
Target : - 113.30
Stop : - 111.75
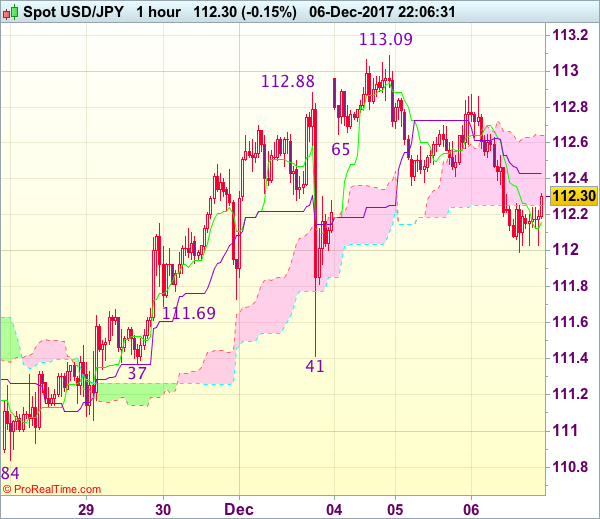
Although the greenback slipped again earlier today and marginal weakness from here cannot be ruled out, reckon downside would be limited and 111.80 should hold, bring rebound later, above 112.90 would signal the retreat from 113.09 has ended, bring retest of this level, break there would extend recent rise to resistance at 113.33 but loss of upward momentum should prevent sharp move beyond 113.60-70.
In view of this, we are holding on to our long position entered at 112.10. Below 111.80 would defer and risk weakness to 111.60 but only break of said support at 111.37-41 would abort and signal top is formed instead.
EURUSD Turning Bearish Below 1.1828 Level
The euro is struggling to move higher against the U.S dollar, with price-action moving closer to the 1.1800 technical level, which represents the pairs 100-day moving average. The EURUSD again moved into selling pressure during the European trading session, creating a third bearish lower swing price-high. An overall lack of euro demand above the 1.1875 level has hurt EURUSD sentiment, with traders now selling upside rallies. Traders now look to the release of the U.S ADP job report for November, and news coming from the pending U.S government shutdown.
The EURUSD pair remains intraday bearish while trading below the 1.1828 level, further downside towards the 1.1800 and 1.1770 levels appears likely.
Should EURUSD price-action move above the 1.1828 technical level, further buying towards 1.1845 and 1.1875 levels seems possible. Extended intraday resistance is found at the 1.1900 level.
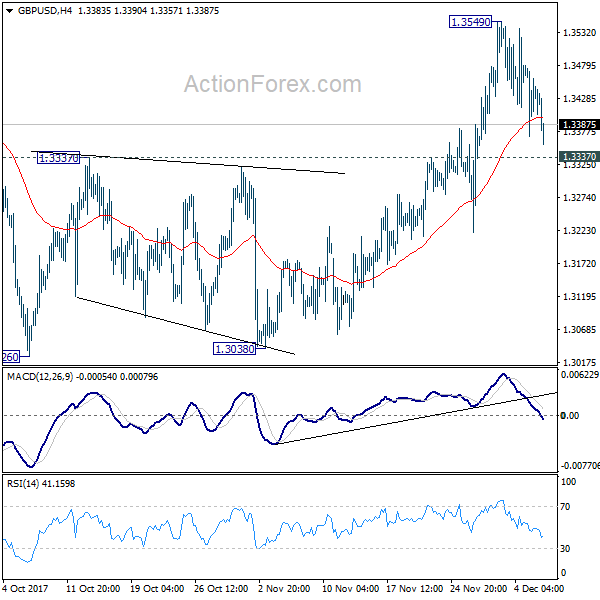
GBPUSD Strongly Bearish Below 1.3400 Level
The British pound has moved to a new weekly price-low against the U.S dollar, hitting 1.3360, as the Brexit stalemate weighs on the pound. The GBPUSD fell through the 1.3400 support level during the European session, sparking a technical sell-off in the pair. Brexit Secretary David Davis has confirmed that the UK and EU have yet to make any further progress, while Theresa May has yet to agree a border deal with the Irish Democratic Union Party. Traders now await the release of the ADP private sector jobs report from the United States economy.
The GBPUSD pair is strongly bearish while trading below the 1.3400 technical level, with sellers likely to test the 1.3303 level if price-action break below the 1.3360 level.
Should buyers push the GBPUSD pair above the 1.3400 technical level again, price-action may gravitate back towards the 1.3450 resistance level.
EUR/USD Mid-Day Outlook
Daily Pivots: (S1) 1.1792; (P) 1.1834 (R1) 1.1868; More....
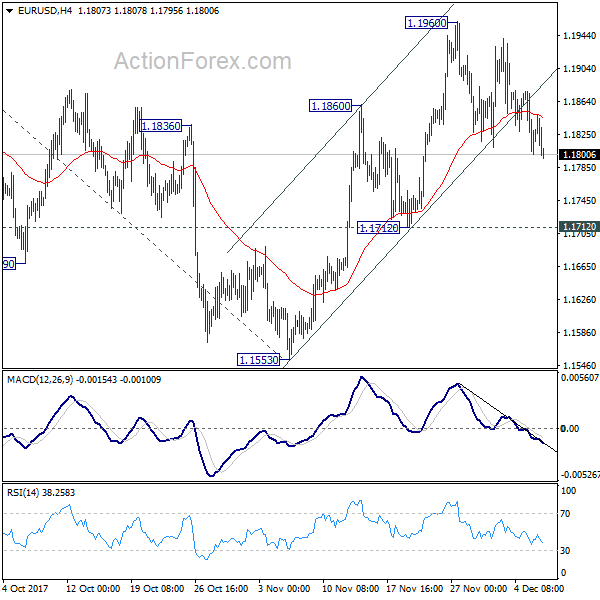
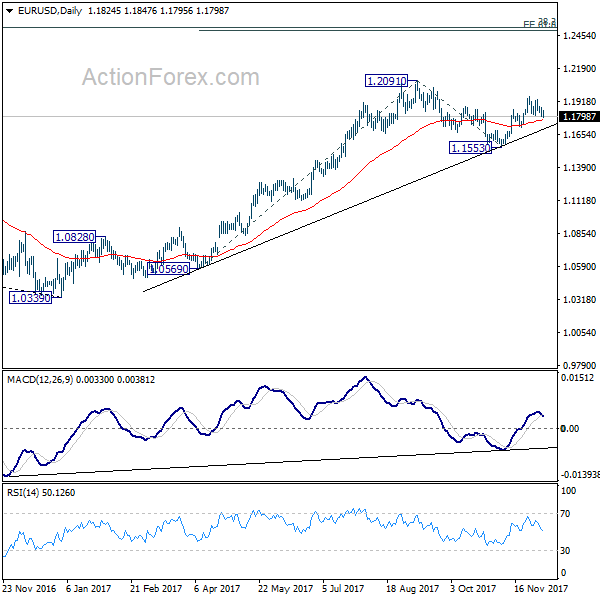
EUR/USD's pull back from 1.1960 continues today but it's staying well above 1.1712 support so far. Intraday bias remains neutral first and another rise is still mildly in favor. On the upside, break of 1.1960 will resume the rise from 1.1553 and target 1.2091 high first. Break there will resume medium term up trend from 1.0339 and target 61.8% projection of 1.0569 to 1.2091 from 1.1553 at 1.2494, which is close to 1.2516 long term fibonacci level. We'd expect strong resistance from there to bring reversal. On the downside, break of 1.1712 will indicate completion of the rise from 1.1553 and turn near term outlook bearish.
In the bigger picture, rise from 1.0339 medium term bottom is seen as a corrective move for the moment. Therefore, in case of another rally, we'd be expect 38.2% retracement of 1.6039 (2008 high) to 1.0339 (2017 low) at 1.2516 to limit upside and bring reversal. Meanwhile, sustained trading below 55 week EMA (now at 1.1393) will suggest that such medium term rebound is completed and could then bring retest of 1.0339 low.
USD/CHF Mid-Day Outlook
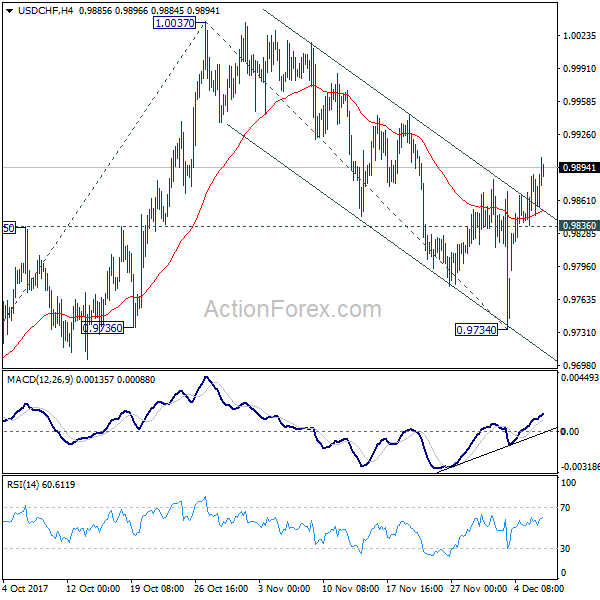
Daily Pivots: (S1) 0.9844; (P) 0.9865; (R1) 0.9894; More....
USD/CHF's break of 0.9881 resistance now suggests that pull back from 1.0037 has completed at 0.9734 already. Intraday bias is back on the upside for retesting 1.0037 first. Break there will resume whole rise from 0.9420 and target 61.8% projection of 0.9420 to 0.9734 from 1.0047 at 1.0115. On the downside, below 0.9836 minor support will dampen the bullish case and turn bias back to the downside for 0.9374 instead.
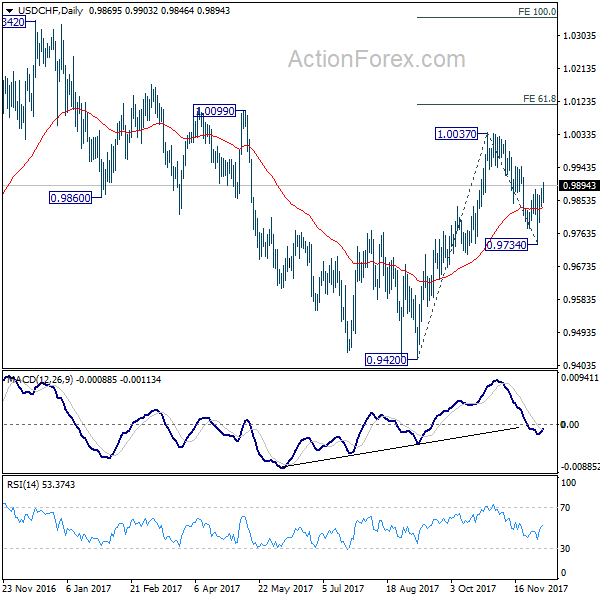
In the bigger picture, range trading continues between 0.9420/1.0342. At this point, 0.9420 appears to be a strong support level. Therefore, in case of decline attempt, we don't expect a firm break of this level. Nonetheless, strong break of 1.0342 is also needed to confirm upside momentum. Otherwise, medium term outlook will stay neutral.
USD/JPY Mid-Day Outlook
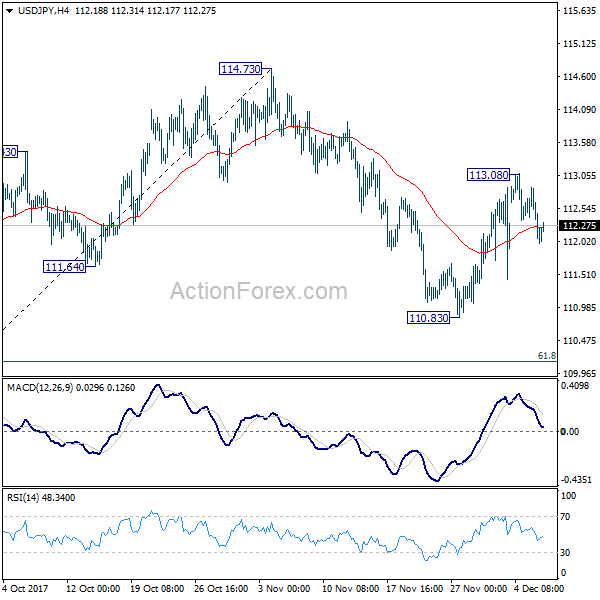
Daily Pivots: (S1) 112.35; (P) 112.60; (R1) 112.84; More...
Intraday bias in USD/JPY remains neutral and outlook is a bit mixed. On the upside, above 113.08 will extend the rebound from 110.83 to retest 114.73 key resistance. Decisive break there will extend the rally from 107.31 to retest 118.65 high. On the downside, break of 110.83 will resume the decline from 114.73 instead. But in that case, we'll look for bottoming again below 61.8% retracement of 107.31 to 114.73 at 110.14.
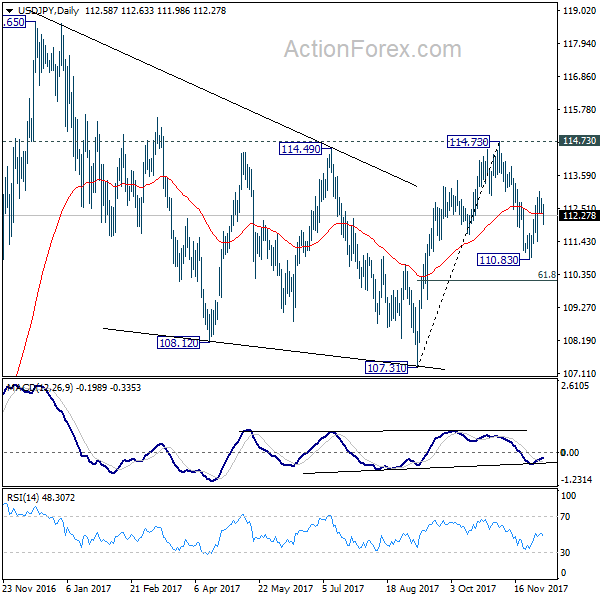
In the bigger picture, we're holding on to the view that correction from 118.65 is completed a 107.31. And medium term rise from 98.97 (2016 low) is resuming. Sustained break of 114.73 should affirm our view and send USD/JPY through 118.65. However, break of 107.31 will dampen this will and extend the medium term fall back to 98.97 low.
Canadian Dollar Steady Ahead of BoC Rate Decision
The Canadian dollar continues to have a quiet week. In the Wednesday session, USD/CAD is trading at 1.2667, down 0.16% on the day. On the release front, both Canada and the US release Trade Balance, and the US will also publish ISM Non-Manufacturing PMI. On Wednesday, the Bank of Canada will set the benchmark rate and the US releases ADP Nonfarm Employment Change.
The Bank of Canada is expected to remain on the sidelines and leave the benchmark rate at an even 1.00% on Wednesday. Although some analysts don't expect the BoC to raise rates before next April, that timetable could change if last week's sparkling numbers continue. On Friday, employment change soared to 79.5 thousand, crushing the estimate of 10.2 thousand. This marked 12 straight months of job gains and helped drive the unemployment rate down to 5.9%. As well, September GDP rebounded with a gain of 0.2%, edging above the estimate of 0.1%. The impressive numbers boosted the Canadian dollar by some 1.6% on Friday, its strongest 1-day gain in 2017. On Tuesday, the Canadian dollar climbed to its highest level since October 24. If today's BoC rate statement sounds optimistic about the Canadian economy, the loonie rally could continue. Another factor which the BoC must take into account is expected rates hikes in the US in December and January. If the Fed does raise rates at its next two policy meetings, the BoC would have to follow suit with a raise of its own, or watch the Canadian dollar head lower.
The US labor market has been red-hot, but the markets are bracing for some weak November numbers. ADP Nonfarm Employment Change is expected to slow to 189 thousand, compared to 235 thousand in the previous release. Investors are, of course, much more interested in the official nonfarm employment change release, which takes place on Friday. Again, the markets are expecting a soft landing, with a forecast of 200 thousand, down from 261 thousand in the October release. If nonfarm payrolls, one of the most important indicators, is weaker than expected, the US dollar could lose ground.
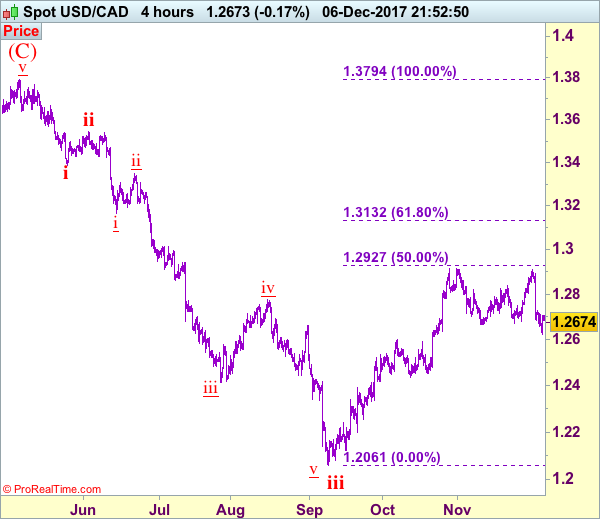
Trade Idea: USD/CAD – Sell at 1.2800
USD/CAD - 1.2677
Trend: Near term up
Original strategy :
Sell at 1.2800, Target: 1.2600, Stop: 1.2860
Position: -
Target: -
Stop: -
New strategy :
Sell at 1.2800, Target: 1.2600, Stop: 1.2860
Position: -
Target: -
Stop:-
As the greenback recovered after falling to 1.2623, suggesting consolidation above this level would be seen and corrective bounce to 1.2720-30 cannot be ruled out, however, as top has been formed earlier at 1.2917, reckon upside would be limited to 1.2790-00 and bring another decline later, below said support at 1.2623 would extend the fall from 1.2917 to 1.2570-75 but loss of near term downward momentum should prevent sharp fall below 1.2550 and price should stay well above 1.2500-10.
In view of this, we are looking to sell on recovery as 1.2790-00 should limit upside and bring another decline later. Above 1.2850-60 would risk test of 1.2890-00 but only break of said resistance at 1.2917 would revive bullishness and extend recent upmove to 1.2975-80 (61.8% Fibonacci retracement of 1.3547-1.2061), then towards psychological resistance at 1.3000.
To recap, wave B from 1.3066 is unfolding as an a-b-c and is sub-divided as a: 1.2192, b: 1.2716 and wave c is a 5-waver with i: 1.1983, ii: 1.2506, extended wave iii with minor iii at 1.0206, wave iv ended at 1.0781 and wave v as well as wave iii has ended at 0.9931, hence the subsequent choppy trading is the wave iv which is unfolding as (a)-(b)-(c) with (a) leg of iv ended at 1.0854, followed by (b) leg at 1.0108 and (c) leg as well as the wave iv ended at 1.0674. The wave v is sub-divided by minor wave (i): 0.9980, (ii): 1.0374, (iii): 0.9446, (iv): 0.9913 and (v) as well as v has possibly ended at 0.9407, therefore, consolidation with upside bias is seen for major correction, indicated target at 1.3700 and 1.4000 had been met and further gain to 1.4700 would be seen later.
GBP/USD Mid-Day Outlook
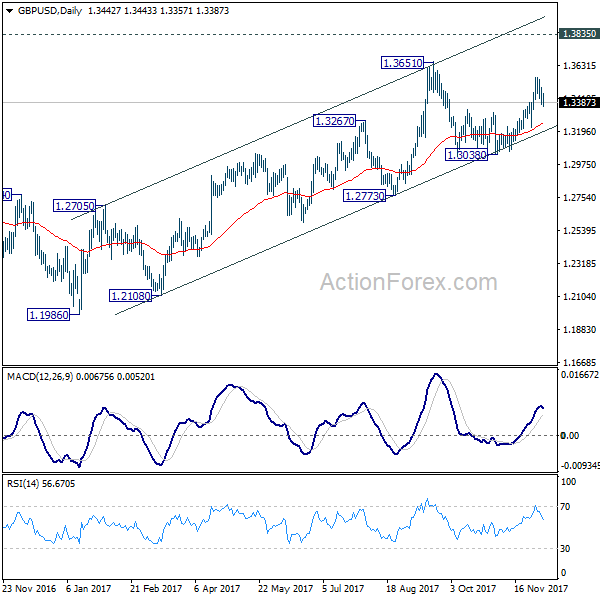
Daily Pivots: (S1) 1.3381; (P) 1.3429; (R1) 1.3489; More....
GBP/USD's pull back from 1.3549 extends to as low as 1.3357 so far today. But the pair is still staging above 1.3337 resistance turned support. Intraday bias remains neutral and another rise is still expected. Break of 1.3549 will target 1.3651 high and above. However, decisive break of 1.3337 will argue that rise from 1.3038 has completed and turn bias back to the downside for this support.
In the bigger picture, while the medium term rebound from 1.1946 low is strong, it's still limited below 1.3835 key support turned resistance. As long as 1.3835 holds, we'd view such rebound as a correction. That is, we'd expect another leg in the long term down trend through 1.1946 low. However, sustained break of 1.3835 should at least send GBP/USD to 38.2% retracement of 2.1161 (2007 high) to 1.1946 (2016 low) at 1.5466.