Sample Category Title
Daily Technical Analysis: EURUSD, GBPUSD, USDJPY, USDCHF
EURUSD
The EURUSD was indecisive yesterday. The bias is neutral in nearest term. Overall I remain neutral but as long as stay inside the bullish channel as you see my H1 chart below, price is still in a bullish phase with key support seen around 1.1800 which is a good place to buy with a tight stop loss. Immediate resistance is seen around 1.1880. A clear break above that area could trigger further bullish pressure testing 1.1920 – 1.1960 region. On the downside, a clear break and daily close below 1.1800 would stop the current bullish phase testing 1.1690 region or lower.
GBPUSD
The GBPUSD had a bullish momentum yesterday topped at 1.3447. It looks like the major bullish trend is now back on its track after some bearish correction. The bias is bullish in nearest term testing 1.3500 before retesting 1.3615 region. Immediate support is seen around 1.3380. A clear break below that area could lead price to neutral zone in nearest term testing 1.3330 but overall I remain bullish and any downside pullback should be seen as a good opportunity to buy.
USDJPY
The USDJPY continued its bullish momentum yesterday topped at 112.14. The bias is bullish in nearest term testing 112.50. A clear break and daily close above that area could trigger further bullish pressure testing 113.20. Immediate support is seen around 111.65. A clear break below that area could lead price to neutral zone in nearest term testing 111.00 – 110.65 support area. Overall I remain neutral but still prefer a bearish scenario at this phase as a part of the bearish pin bar scenario on daily chart.
USDCHF
The USDCHF was indecisive yesterday. The bias is neutral in nearest term. Immediate resistance is seen around 0.9875 area which remains a good place to sell with a tight stop loss. Immediate support is seen around 0.9818. A clear break and daily close below that area could trigger further bearish pressure testing 0.9780 or lower. On the upside, a clear break and daily close above 0.9875 would expose 0.9940 region. Overall I remain neutral.
GBPUSD – Remains On The Offensive On Bull Pressure
GBPUSD - The pair looks to extend its recovery further following its strong strength during morning trading on Thursday. Support lies at the 1.3450 level where a break will turn attention to the 1.3400 level. Further down, support lies at the 1.3350 level. Below here will set the stage for more weakness towards the 1.3300 level. Conversely, resistance stands at the 1.3500 levels with a turn above here allowing more strength to build up towards the 1.3550 level. Further out, resistance resides at the 1.3600 level followed by the 1.3650 level. Its daily RSI is bullish and pointing higher suggesting further strength. On the whole, GBPUSD continues to face upside pressure.
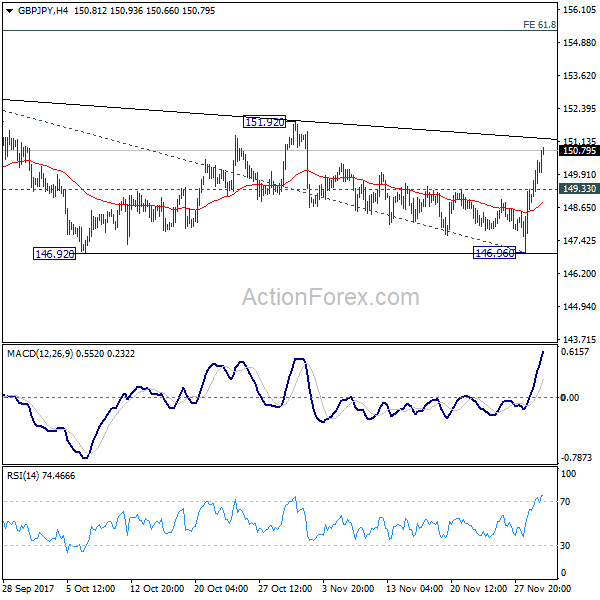
GBP/JPY Daily Outlook
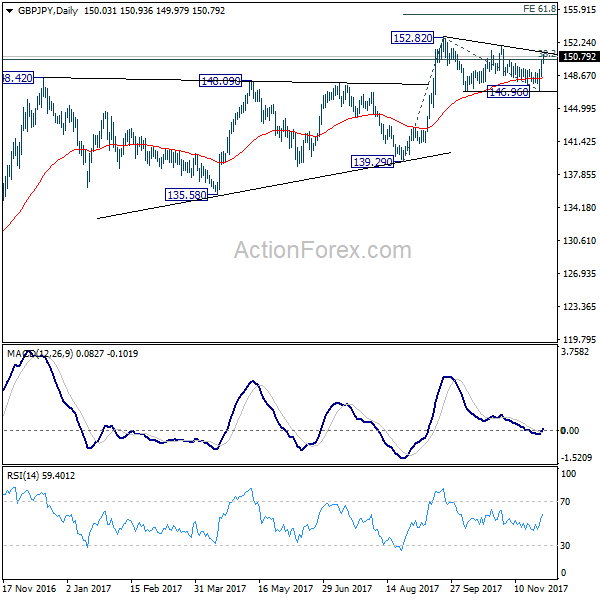
Daily Pivots: (S1) 148.99; (P) 149.70; (R1) 150.79; More...
GBP/JPY's strong break of 149.45 resistance now argues that consolidation pattern from 152.82 is completed at 146.96. Intraday bias is bacon the upside for 151.92 resistance first. Break there should confirm rise resumption and target 61.8% projection of 139.29 to 152.82 from 146.96 at 155.32 next. On the downside, below 149.33 minor support will dampen the delay the bullish view and extend the consolidation from 152.82 with another falling leg.
In the bigger picture, medium term rebound from 122.36 is still expected to resume after corrective pull back from 152.82 completes. Firm break of 38.2% retracement of 196.85 to 122.36 at 150.43 will carry long term bullish implications. In that case, GBP/JPY could target 61.8% retracement at 167.78. However, break of 139.29 will indicate rejection from 150.43 key fibonacci level. And the three wave corrective structure of rebound from 122.36 will argue that larger down trend is resuming for a new low below 122.26.
EUR/JPY Daily Outlook
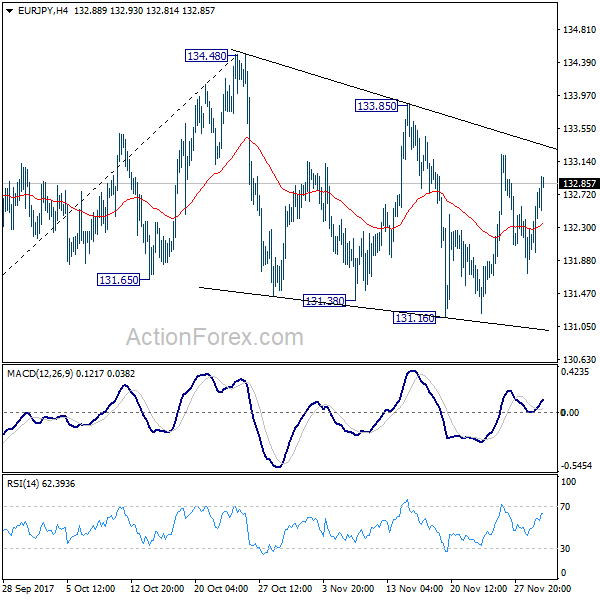
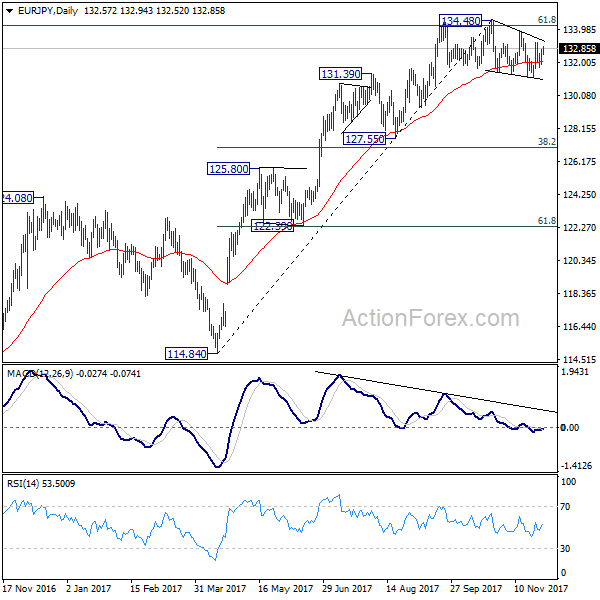
Daily Pivots: (S1) 132.06; (P) 132.42; (R1) 132.98; More....
Intraday bias in EUR/JPY remains neutral corrective pattern from 134.48 is still unfolding. As long as 134.48 key resistance holds, risk remains on the downside for deeper pull back. Break of 131.16 will target 38.2% retracement of 114.84 to 134.48 at 126.97, which is close to 127.55 support. We'll look for support from there to bring rebound on first attempt.
In the bigger picture, medium term rise from 109.03 (2016 low) is seen as at the same degree as the down trend from 149.76 (2014 high) to 109.03 (2016 low). 61.8% retracement of 149.76 to 109.03 at 134.20 is already met. Sustained break there will pave the way to key long term resistance zone at 141.04/149.76. However, break of 127.55 support will argue that the medium term trend has reversed and will turn outlook bearish for deeper fall back to 114.84/124.08 support zone at least.
EUR/GBP Daily Outlook
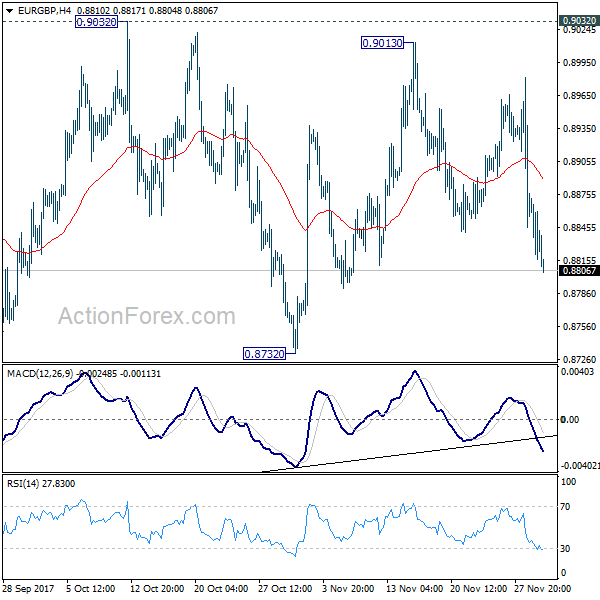
Daily Pivots: (S1) 0.8809; (P) 0.8842; (R1) 0.8867; More...
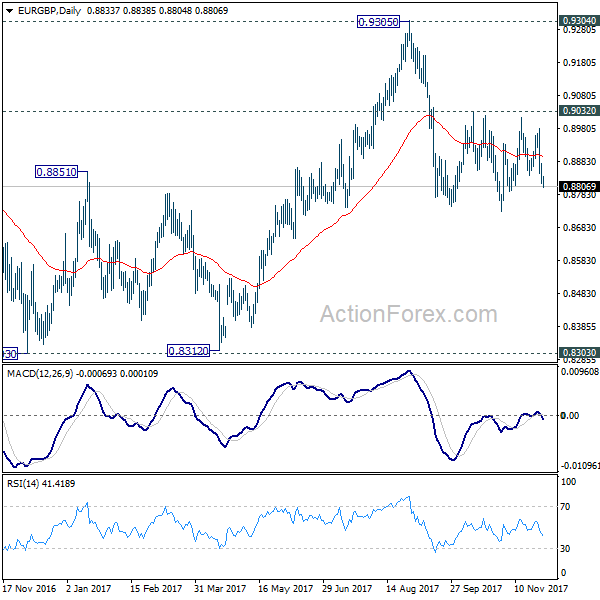
No change in EUR/GBP's outlook as it's still bounded in range of 0.8732/9032 and intraday bias remains neutral. With 0.9032 resistance intact, deeper decline is mildly in favor in the cross. Break of 0.8732 will resume the fall from 0.9305 and target 0.8303 key support level. However, on the upside, decisive break of 0.9032 will confirm completion of the decline from 0.9305. In such case, intraday bias will be turned back to the upside for retesting 0.9305 key resistance.
In the bigger picture, there are various ways to interpret price actions from 0.9304 high. But after all, firm break of 0.9304/5 is needed to confirm up trend resumption. Otherwise, range trading will continue with risk of deeper fall. And in that case, EUR/GBP could have a retest on 0.8303. But we'd expect strong support from 0.8116 cluster support (50% retracement of 0.6935 to 0.9304 at 0.8120) to contain downside.
EUR/AUD Daily Outlook
Daily Pivots: (S1) 1.5587; (P) 1.5633; (R1) 1.5691; More....
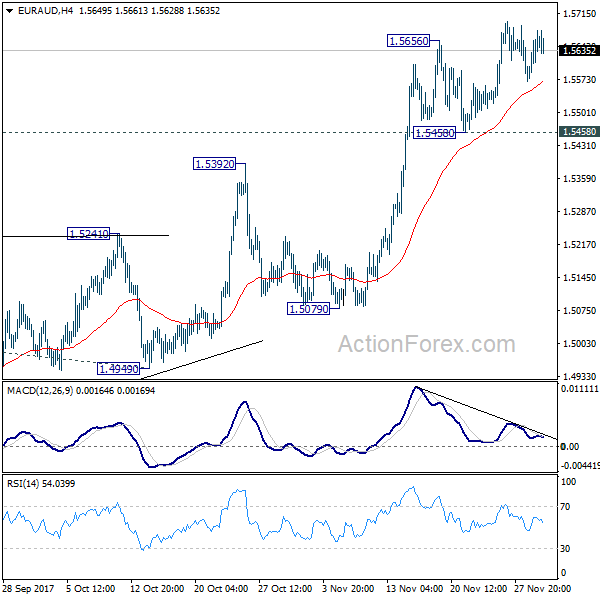
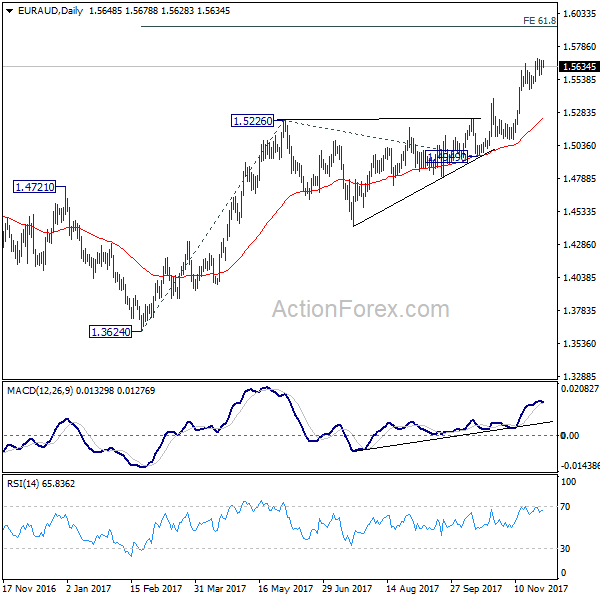
No change in EUR/AUD's outlook. With 1.5458 support intact, outlook remains bullish for further rally. . Medium term rise from 1.3624 should target 61.8% projection of 1.3624 to 1.5226 from 1.4949 at 1.5939 first. Break will target 100% projection at 1.6551, which is close to 1.6587 key resistance. However, firm break of 1.5458 will now indicate near term topping and should bring pull back towards 55 day EMA (now at 1.5247).
In the bigger picture, we're holding on to the view that corrective decline from 1.6587 medium term top (2015 high) has completed at 1.3624. Rise from 1.3624 is expected to extend to retest 1.6587. We'll hold on to this bullish view as long as 1.5226 resistance turned support holds. Firm break of 1.6587 will resume long term rise from 1.1602 (2012 low).
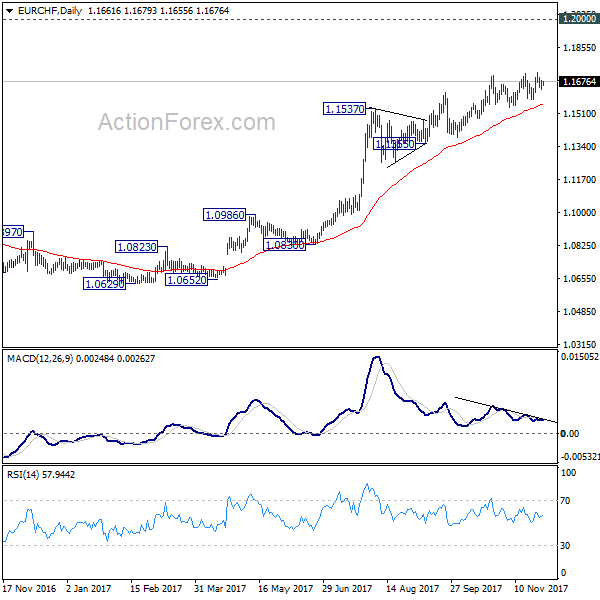
EUR/CHF Daily Outlook
Daily Pivots: (S1) 1.1643; (P) 1.1662; (R1) 1.1683; More...
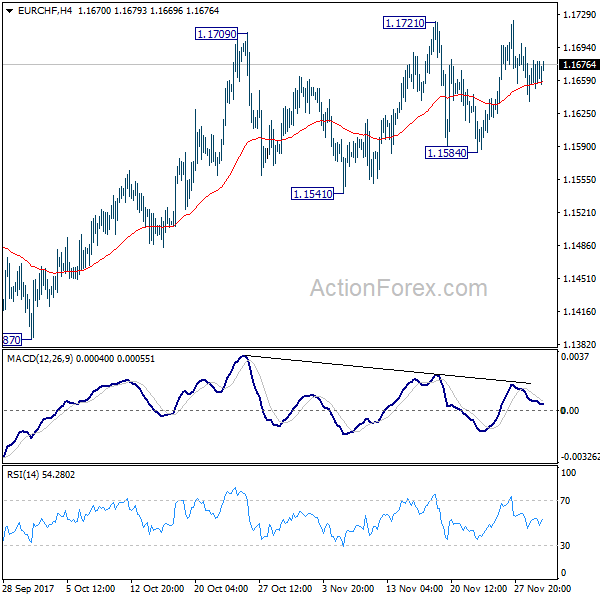
No change in EUR/CHF's outlook. With 1.1584 support intact, outlook remains bullish. Current medium term rise from 1.0629 would extend to 1.2 key level. However, considering bearish divergence condition in 4 hour MACD, firm break of 1.1584 will now indicate near term reversal and should bring pull back to 1.1355 support or below.
In the bigger picture, long term rise from SNB spike low back in 2015 is still in progress. EUR/CHF should now be heading back to prior SNB imposed floor at 1.2000. For now, this will be the favored case as long as 1.1355 support holds. However, break of 1.1355 will indicate medium term topping. In that case, EUR/CHF should head back to 55 week EMA (now at 1.1142) and possibly below.
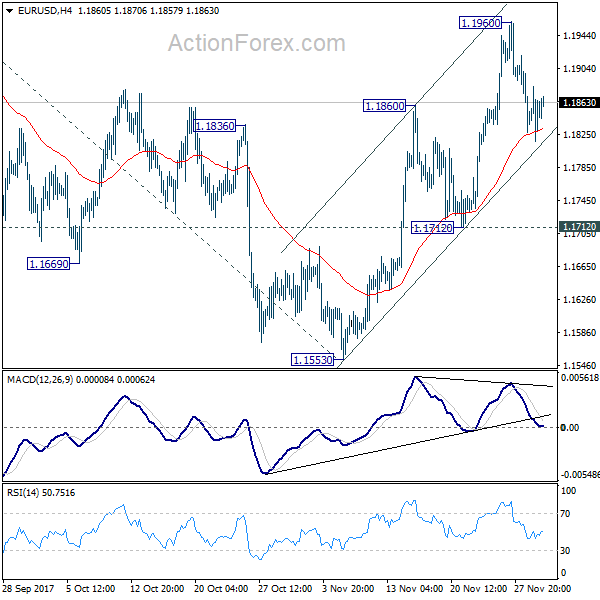
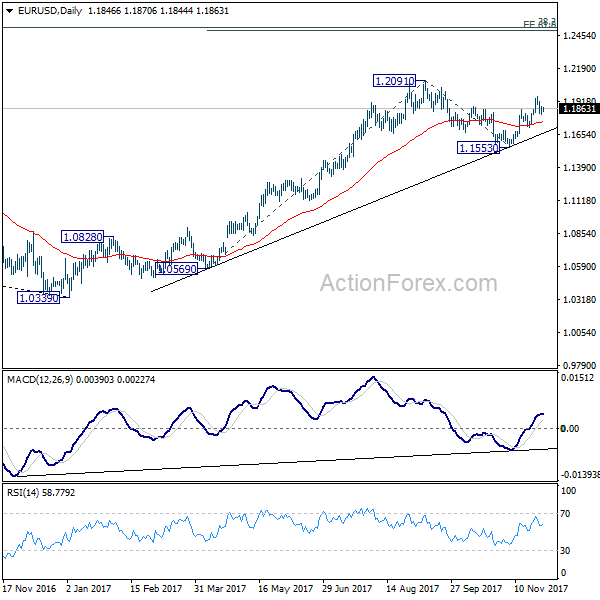
EUR/USD Daily Outlook
Daily Pivots: (S1) 1.1814; (P) 1.1849 (R1) 1.1881; More....
Intraday bias in EUR/USD stays neutral at this point. As long as 1.1712 support holds, rise from 1.1553 is expected to continue. Above 1.1960 will target 1.2091 high first. Break there will resume medium term up trend from 1.0339 and target 61.8% projection of 1.0569 to 1.2091 from 1.1553 at 1.2494, which is close to 1.2516 long term fibonacci level. We'd expect strong resistance from there to bring reversal. On the downside, break of 1.1712 will indicate completion of the rise from 1.1553 and turn near term outlook bearish.
In the bigger picture, rise from 1.0339 medium term bottom is seen as a corrective move for the moment. Therefore, in case of another rally, we'd be expect 38.2% retracement of 1.6039 (2008 high) to 1.0339 (2017 low) at 1.2516 to limit upside and bring reversal. Meanwhile, sustained trading below 55 week EMA (now at 1.1393) will suggest that such medium term rebound is completed and could then bring retest of 1.0339 low.
Market Morning Briefing: Euro Dropped To Levels Around 1.1820
STOCKS
Growth in US GDP at an annualized rate of more than 3% in the past 2-quarters has boosted a rise in the stock market too.
Dow (23940.68, +0.44%) has surged to levels above our expected 23800-23900 and has moved beyond the immediate resistance levels. Now the index looks strongly bullish and could target levels near 24000-24500 in the medium term.
Dax (13061.87, +0.02%) came off from 13200 yesterday and is likely to continue in the 12900-13200 region for some more time. A break on either side would be needed to have some clarity on further direction.
Nikkei (22574.45, -0.10%) has been stable despite a sharp up move in Dollar Yen (111.96). Movements have been narrow over the last few sessions and a sharp move is on the cards within the next few sessions. A break above 22750 could be surprising and could take the index back to levels near 23000-23250 but while below 22750, chances of a fall towards 22250-22000 looks possible.
Shanghai (3330.03, -0.23%) is fluctuating in the 3300-3350 region and is likely to move sideways in the coming sessions. A move above 3350 would be required to bring in some reversal just now; else a move towards 3300 and lower is possible in the near term.
Nifty (10361.30, -0.09%) is stable near current levels and is likely to spend the week sideways before trying to move up towards 10500 and higher again in the near term.
Sensex (33602.76, -0.05%) is likely to test 34000 in the near term but has been quiet since the past 2-3 sessions. Momentum could be low and movements narrow for the rest of the week.
COMMODITIES
Gold (1284.80) is in a short term up channel and is likely to trade in the 1280-1300 region. A bounce from 1280 looks likely just now.
Brent (63.37) is trading sideways but while above 62, it could test 65 in the near term.
WTI (57.37) could find some support in the 57.0-56.8 region which may again take the price back towards 59 and higher.
Copper (3.0735) is unable to sustain above levels of 3.08 and could probably move to test 3.00-2.95 on the downside in the coming sessions. Near term looks bearish.
FOREX
Dollar-Index (93.108) is trading marginally lower today and as predicted yesterday, might move beyond resistance on daily charts around 93.40 if there is sustainability in dollar strength; however, the possibility of downside towards 92.50-92.75 in case of a weak dollar remains open and will be ascertained in the coming few sessions.
Euro (1.1867) dropped to levels around 1.1820 yesterday after the US GDP data was released but is now trading a bit higher around 1.1860-1.1870. With a sharp increase in US Yields yesterday (see Interest Rates below), the Euro is likely to move down gradually towards 1.1825 and then 1.1775 levels (acting as support on the weekly candle charts). However, with a corresponding rise in German Yields, the possibility of a breach of resistance at 1.19 – 1.195 (on the weekly line charts) can’t be ruled out, in which case, the upmove beyond resistance could be steep and sharp.
Dollar-Yen (111.99) has sharply moved up from yesterday’s levels around 111.40 on the back of strengthening US Yields. This rise could lend support to Dollar strength in the coming days and an upside of 113-113.50 could be reached quickly if this strength persists.
Pound (1.3471) continues its move past resistance level of 1.335 and is now on course to test 1.36 on the weekly charts, which could then act as resistance for some time.
Dollar Rupee (64.32) is likely to bounce back from support at 64.30 and could move higher to test 64.50/60 in the coming sessions.
INTEREST RATES
Decent pickup in US yields as Supports mentioned over the last couple of days have held well. The 5Yr is up at 2.10% from 2.07%, 10Yr has moved up strongly from 2.33% to 2.38% and the 30Yr is also up strongly from 2.76% to 2.82%.
This bounce can pave the way for further rise, especially since Yellen has reiterated the Fed's committment to gradual increases in interest rates. Significantly, she said, ""We don't want to cause a boom-bust condition in the economy."
The US Yield Curve has also steepened with the 30-5 Spread (0.72%) rising to 0.72% from 0.69% earlier. This is in line with our expectation of a rise to 0.75% and higher.
German yields have also risen a bit, with the 2Yr at -0.69% from -0.71% earlier and the 5Yr at -0.30% compared to -0.34% earlier. However, there is Resistance near -0.27% on the German 5yr whereas there is no near term Resistance on the US 5Yr now. Reflecting this, the German-US 10Yr Spread (-2.00%) has dipped from -1.99% yesterday, in line with our expectation of a further dip to -2.03%. A break below -2.03% could open up much lower levels.
Similarly, although the Japanese 10yr (0.04%) has moved up a bit from 0.03%, the US-Japan 10Yr Spread (2.34%) has moved up again. Need to see if this Spread can break above immediate and important Resistance near 2.355%.
In India, SBI has increased deposit rates by 100bp on bulk deposits above Rs 1 Cr. This seems to go against their view of lower GOI yields going forward. That said, we stick to our view of near term range trade between 6.90-7.10%.
GBP/USD Daily Outlook
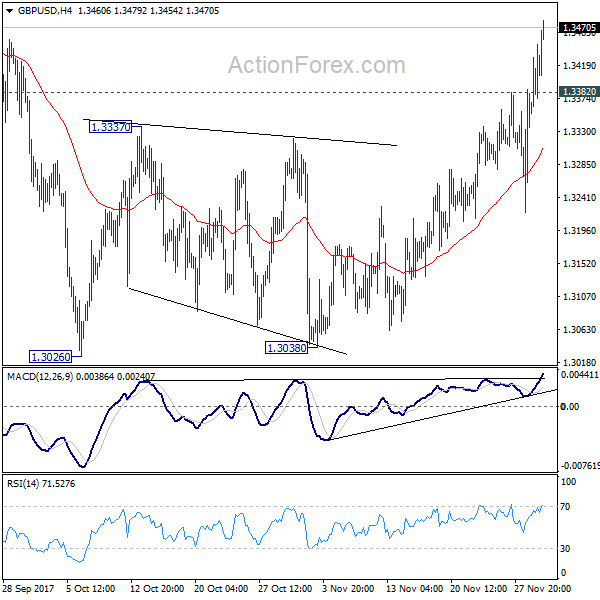
Daily Pivots: (S1) 1.3347; (P) 1.3397; (R1) 1.3460; More....
GBP/USD's rise extends to as high as 1.3479 so far. with 61.8% retracement of 1.3651 to 1.3026 at 1.3412. Intraday bias stays on the upside for 1.3651 high. Break will resume medium term rally from 1.1946 to 1.3835 key resistance. On the downside, below 1.3382 minor support will turn bias neutral and bring retreat before staging another rally.
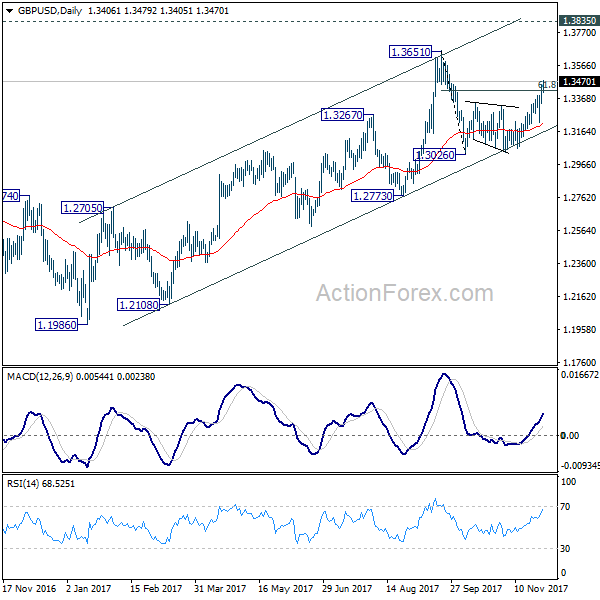
In the bigger picture, as noted before, GBP/USD hit strong resistance from the long term falling trend line. Nonetheless, subsequent fall was contained by 55 week EMA (now at 1.3069). Outlook is a bit mixed. For the moment, as long as 1.3835 support turned resistance holds, medium term rise from 1.1946 are viewed as a corrective pattern. That is, we'd expect another leg in the long term down trend through 1.1946 low. However, sustained break of 1.3835 should at least send GBP/USD to 38.2% retracement of 2.1161 (2007 high) to 1.1946 (2016 low) at 1.5466.