Sample Category Title
USD Holds Steady Ahead Of FOMC And ADP
Further upside in USD/CHF
Switzerland Manufacturing PMI came in at 62.0 from 61.7 and 0.7 higher than expectations. This continued a strong trend of economic improvement in manufacturing reaching the highest level since 2011. Last week Kof leading indicators jumped to 109.1 from 105.8. With a weaker CHF and further improvement in global demand Switzerland is uniquely positioning to exploit the opportunity. This fact is clearly reflecting in the increased upside surprises. Interestingly and quietly consumer price inflations has been slowly creeping higher as annual headline read stands at 0.7%.
Should the current inflation trajectory continue prices should hit the SNB 2% target in early 2019. While a year away with Swiss GDP growth outlook improving above 0.9% 2017 trend, the central bank will be faced with interesting policy choices in 2018. Yet in the current environment, CHF remains a solid short against USD and EM currencies. Accelerating outflows and dropping FX hedge ratios will further weaken the CHF. But the key of an unmoving SNB unlikely to unwind reserves of adjust policy rates higher until CHF become less “overvalued” is the primary reason investors will shift out of CHF. We remain constructive on USDCHF expecting current bullish trend will extend to 1.02.
High expectations for the US ADP data before the FOMC meeting
Today we get US labor ADP data ahead of the NFP report on Friday. Bloomberg Survey indicates new jobs creation for October of 200k compared to the prior September read of 135k. The overall sentiment is positive and it has been 7 years that the data print positive. The third quarter GDP has been released earlier last week at 3% q/q. Anyway it is worth saying that before this release GDP growth was in its second-worst year since 1959. On top of that credit demand is contracting which should weigh on growth and tax receipts remain negative.
This is why traders will clearly have the downside risks in the back of their minds. ADP has had a history of spectacular misses for predicting NFPs over the past months. Last time ADP predicted 135 new jobs while NFPs came in negative. Yet, statistically speaking, ADP has more often been a pretty accurate forecast for the NFP change.
Tonight will be held the FOMC meeting against the backdrop of the coming nomination of the new Fed Chair that will replace Janet Yellen early next year. Markets now expect a rate hike in
December. It is currently priced in at 66.8%. We suspect that ADP is likely to print below the current expectations following September NFPs. A poor labor read will keep adding downside pressures on the greenback lower, and fuel the main country equity indexes as a US weak economy will push away Fed rate-tightening policy discussion. We think that the room is open for short-term weakness on the dollar.
USD/CAD: Canadian Gross Domestic Product
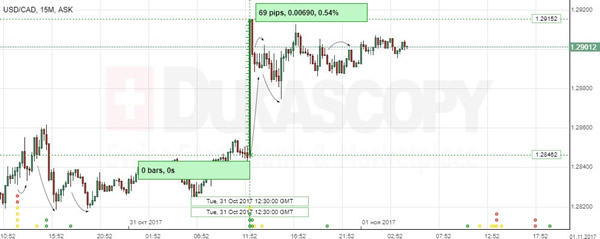
The Canadian Dollar weakened significantly against the Greenback, reflecting disappointing GDP data on Tuesday. The USD/CAD currency pair added 69 base points or 0.54% to return to the past week’s high of 1.290 and remained in the area by Wednesday morning.
Statistics Canada revealed that the country’s gross domestic product contracted surprisingly 0.1% in the month of August, following the flat reading in the prior month. Data suggested that the decline was caused by maintenance shutdowns in the extractive and chemical industries. Back to the previous week, the Bank of Canada diminished its yearly growth projection to 1.8% in the Q3, and confirmed its cautious stance about the next interest rate increases.
EUR/USD: EZ Gross Domestic Product
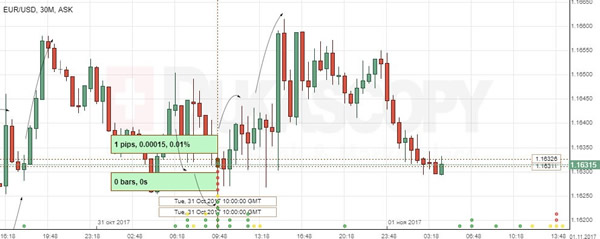
The EZ GDP report failed to change the side move in the EUR/USD currency pair on Thursday. After the release, the Euro added 1 pip against the US Dollar to reveal bulls' attempts to get back the strong footing for the currency, but the pair returned to 1.1630 on Wednesday.
The Eurostat release showed that the Euro zone's quarterly GDP growth was slightly weaker at 0.6% in the September quarter. However, the yearly GDP growth rate edged higher to 2.5% in the Q3. Data also showed the bloc's unemployment rate dropped to its nine-year low in the observed period. The Euro zone's consumer inflation showed some signs of cooling, with the CPI at 1.4% in October, though analysts suggested it could reach 2% target in the next year.
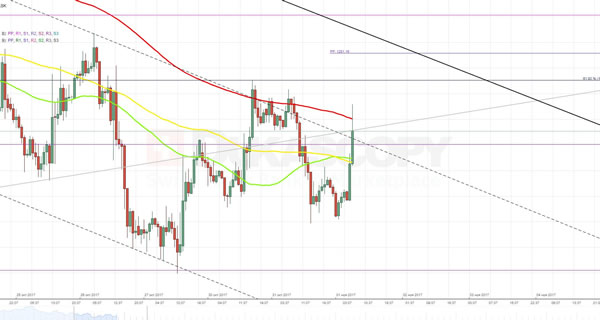
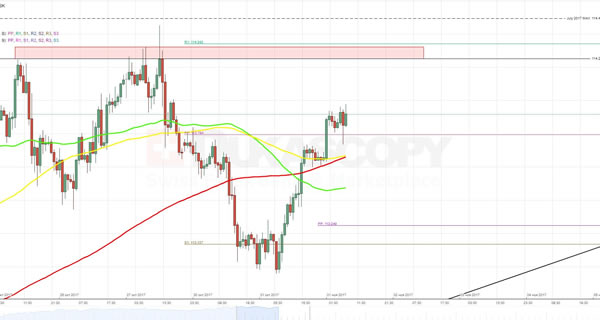
XAU/USD Analysis: Tests 200-Hour SMA
As soon as markets found out that one the leading indicators, the Consumer Confidence Index, substantially exceed expectations the rate plunged to the 1,269.37 level. Nevertheless, the upcoming FOMC meeting as well as employment data release do not allow reinforcing this success. On the other hand, in order to break to top the pair still needs to bypass the weekly PP, the upper boundary of a descending channel and, most importantly, the 200-hour SMA. Previous failed attempts suggest that until the first release these barriers are likely to constrain active rise of the yellow metal's price. In case of positive news, the pair is expected to repeat previous Thursday's downfall and reach the weekly S1 at 1.264.23.
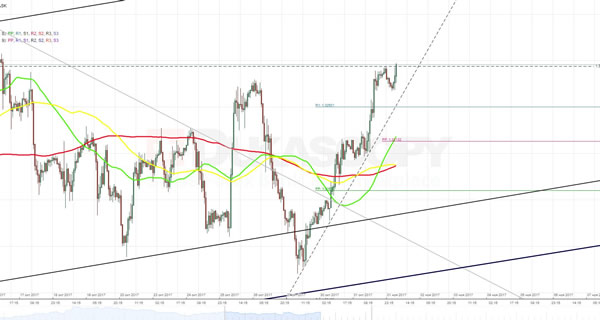
USD/JPY Analysis: Surges Above 113.80
As it was expected, a release of positive consumer sentiment data elevated the pair to the 113.70 mark, which represented an approximate location of different moving averages. During this trading session the exchange rate most probably is going to climb even higher amid the US labour data release and the subsequent Fed meeting. If that is the case, the pair is likely to break through resistance located between the 114.25 and 114.35 marks and try to reach the July 2017 maximum at 114.50. Generally, this advance is expected to have limited effect, as two days ago the pair made breakout from a long-term rising wedge formation. From this perspective, the Yen is expected to start slowly recovering against the Dollar in the nearest future.
GBP/USD Analysis: Rapidly Climbs To 1.3280
Although the US economy showed convincing signs of growth, the Pound continued to rapidly appreciate against the Dollar yesterday. The fact that the cable managed to return to mid-October level near 1.3295 indicates how actively traders are anticipating interest rate hike by the Bank of England, which even overshadows today’s FOMC meeting. From technical point of view, there is a need to notice that both on hourly and daily timeframes the pair is free to surge up until the weekly R2 located at the 1.3370 level (after passing through the above resistance). Until release of the American data, the pair is expected to move horizontally near 1.3270. Afterwards, in case of plunge it is likely to be stopped by the 200-hour SMA fluctuating near 1.3180.
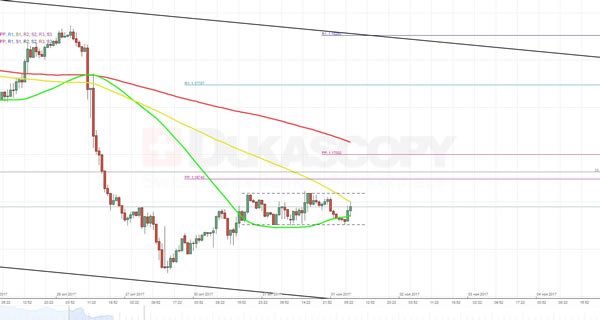
EUR/USD Analysis: Moves Horizontally In Anticipation Of FOMC Meeting
Despite a release of various macroeconomic data yesterday, including the Euro Zone CPI and CB Consumer Confidence, the pair did not make any sharp moves and continued to move horizontally between the 100- and 55-hour SMAs. Such indifference nicely illustrates how traders are anticipating the upcoming FOMC Monetary Policy Statement and appointment of the new Fed Chair by President Trump. Given that yesterday’s information appeared to be better than expected plus general consensus that today’s meeting will not bring any unexpected news suggests that the pair is likely to continue moving horizontally between the 1.1658 and 1.1625 levels with a tendency to stick to the southern direction. A major breakout to the top also looks unlikely because that side contains multiple barriers.
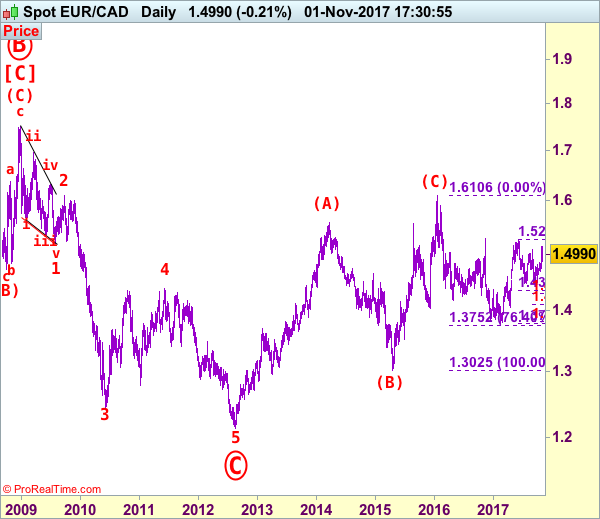
EUR/CAD Elliott Wave Analysis
EUR/CAD – 1.4984
Although the single currency rallied to as high as 1.5146 last week, lack of follow through buying on break of previous resistance at 1.5076 and the subsequent retreat to 1.4868 suggest top is possibly formed there and consolidation mild downside bias is seen, below said support at 1.4868 would add credence to this view, bring further fall to 1.4800, then towards 1.4740-50. Looking ahead, only a drop below support at 1.4680-85 would retain bearishness and signal the rise from 1.4441 has ended, bring further fall to 1.4635 support, then towards 1.4550-55 which is likely to hold from here due to near term oversold condition.
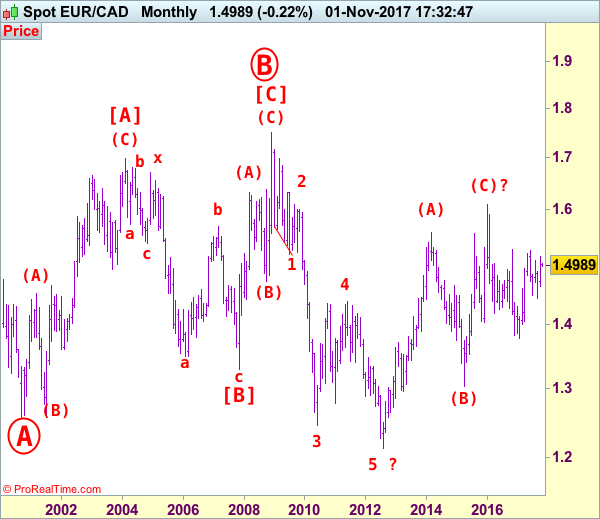
Our latest preferred count is that larger degree wave [C] from 1.3289 as well as circle wave B ended at 1.7509 in Dec 2008 with (A): 1.6325, (B): 1.4719 followed by wave (C) at 1.7509, hence circle wave C is unfolding with wave 1 ended at 1.5186 (diagonal wave 1), wave 2 at 1.6096, impulsive wave 3 has ended at 1.2451, followed by wave 4 at 1.4380, in view of recent strong rebound, we are now treating the wave 5 as well as larger degree circle wave C has ended at 1.2129, hence (A)-(B)-(C) correction has commenced from there with impulsive wave (C) now unfolding and indicated initial upside target at 1.6000 had been met and reckon 1.6500 would hold.
On the upside, whilst initial recovery to 1.5050 cannot be ruled out, reckon upside would be limited and said resistance at 1.5146 should hold, bring another retreat. Above said resistance would signal the rebound from 1.4441 is still in progress for further gain too 1.5200, having said that, price should falter below previous chart resistance at 1.5259 and bring another decline later.
Recommendation: Sell at 1.5050 for 1.4850 with stop above 1.5150.
On the bigger picture, our long-term count on the monthly chart is that a big sideways consolidation from 2000 low of 1.2557 has possibly ended at 1.7509 as circle wave B with [A]: 1.6976 ( (A): 1.4513, (B): 1.2612, (C): 1.6976), wave [B]: 1.3289 is a double three with 1st a-b-c: 1.5384, x: 1.6709 and 2nd a-b-c: 1.3289. As indicated above, the wave [C] has ended at 1.7509. The selloff from there is now unfolding which itself should be labeled as an impulsive wave with wave 1: 1.5186 (diagonal wave 1), followed by wave 2: 1.6096 and wave 3: 1.2451, wave 4: 1.4380, wave 5 as well as larger degree circle wave C has possibly ended at 1.2129 and major correction has possibly commenced for retracement of recent decline towards 1.4000, then 1.4180-90 (38.2% Fibonacci retracement of 1.7509-1.2129). Below said support at 1.2129 would risk weakness to psychological support at 1.2000 and then 1.1851 (50% projection of 1.7509-1.2451 measuring from 1.4380) but reckon 1.1500 would remain intact, bring reversal later.
EURJPY Risk Tilted To The Upside In Short Run, Broader Neutral Trend Intact
EURJPY is firmer after the bounce up earlier this week following a sharp fall from highs not seen since late 2015. The cross continues to benefit from strong upside momentum in the short term. Looking at the broader trend, the market has been neutral since mid-September.
The level at 131.45 has provided strong support. Soft support is expected at yesterday's low of 132.31, which will keep risk to the upside if it holds during the next few sessions.
EURJPY needs to break the 50% Fibonacci and key 133 level to open up the way for more corrective gains towards the 134.48 peak.
Breaking below yesterday's low of 132.31 would turn the focus back to the downside to target 131.45. From here, the odds increase for a break out of the broader range to move to the downside.
Intra-day risk is tilted to the upside but EURJPY needs to regain the key 133-handle to relieve downside pressure. The broader range that has prevailed since mid-September is expected to remain intact as long as the 131.45 support holds.
AUD/USD Elliott Wave Analysis
AUD/USD – 0.7685
Aussie dropped in line with our bearish expectation, our short position entered at 0.7870 met downside target at 0.7670 with 200 points profit, however, as price has recovered after finding support at 0.7625, suggesting consolidation above this level would be seen and initial recovery to 0.7720-25 is likely, however, reckon 0.7780-85 would limit upside and bring another decline later, below said support at 0.7625 would extend the decline from 0.8125 top for retracement of early upmove to 0.7570, then towards 0.7520 but near term loss of momentum should limit downside and reckon 0.7500 would hold.
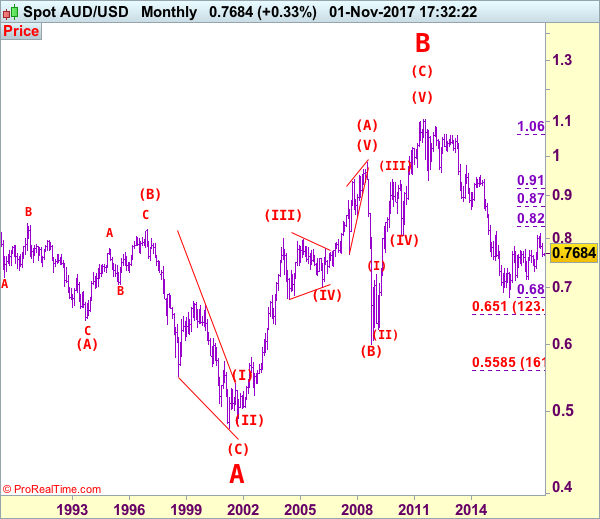
We are keeping our count that top has been formed at 1.1081 (wave 5 of V) and major correction (A-B-C-X-A-B-C) has commenced, indicated downside targets at 0.7945 (61.8% Fibonacci retracement of entire rise from 0.6007-1.1081) and 0.7750 had been met and downside bias is seen for further weakness to 0.6800, then 0.6700 but reckon 0.6500 would hold from here.
Our preferred count is that the rally from 0.6007 to 0.7270 (7 Jan 2009) is marked as wave A, the retreat to 0.6248 (2 Feb 2009) is wave B and the subsequent upmove is labeled as wave C with wave (iii) and wave (iv) ended at 0.8265 and 0.7700 respectively and wave (v) as well as 3 ended at 0.9407, then wave 4 ended at 0.8066 (instead of 0.8578). The wave 5 has met our indicated projection target of 1.1060 and could ended at 1.1081, this level is now treated as the peak of wave (C) as well as larger degree wave B, hence major fall in wave C has commenced, our initial downside target at psychological support at 0.7000 has just been met and further weakness to 0.6500 would be seen later.
On the upside, expect recovery to be limited to 0.7720-30 and bring another decline to aforesaid downside targets. Above 0.7795-00 would defer and risk a stronger rebound but only break of resistance at 0.7897 would abort and signal low is formed instead, risk test of previous support at 0.7908, break there would signal first leg of decline from 0.8125 has ended instead, bring a stronger rebound to 0.7940-50 but upside should be limited to 0.8020 and bring another decline later. A daily close above 0.8020 would risk test of 0.8080 but only break of resistance at 0.8103 would signal correction from 0.8125 has ended, bring retest of this level first.
Recommendation: Short entered at 0.7870 met target at 0.7670 with 200 points profit and would sell again at 0.7720 for 0.7520 with stop above 0.7820.
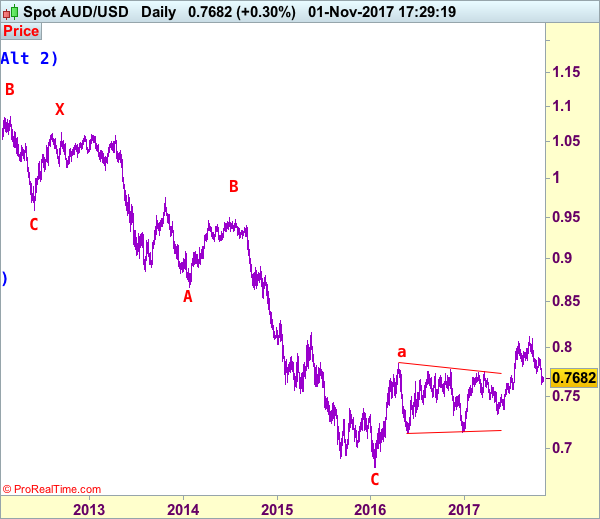
Our alternate count on the daily chart treated the top formed in 2008 at 0.9851 could be a larger degree wave I and was followed by a deep and sharp correction in wave II to 0.6007 and wave III is unfolding from there.
The long-term uptrend started from 0.4775 (2 Apr 2001) with an impulsive structure. Wave I is labeled as 0.4775 to 0.9851 (15 Jul 2008), wave II has ended at 0.6007 (Oct 2008) and wave III is still in progress which may extend further gain to 1.1265.