Sample Category Title
Trade Idea: GBP/USD – Stand aside
GBP/USD – 1.3285
Original strategy :
Sold at 1.3195, stopped at 1.3255
Position: - Short at 1.3195
Target: -
Stop: - 1.3255
New strategy :
Stand aside
Position: -
Target: -
Stop:-
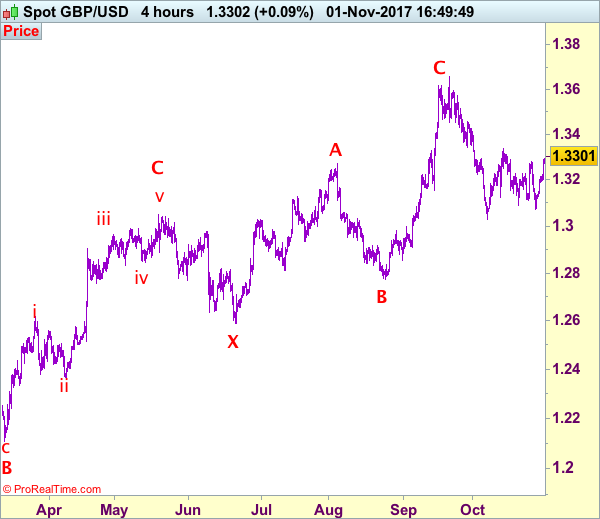
As sterling has surged yesterday and broke above previous resistance at 1.3279-87, dampening our bearishness and gain towards resistance at 1.3338 cannot be ruled out, however, as broad outlook remains consolidative, reckon upside would be limited to 1.3390-00, price should falter well below resistance at 1.3455, bring another decline later.
In view of this, would not chase this rise here and would be prudent to stand aside for now. Below 1.3260-65 would bring pullback to 1.3220-25 but only break of 1.3195-00 would signal top is formed instead, then further choppy trading within recent range would take place and weakness to 1.3150 and possibly 1.3117 would follow. Our preferred count is that (pls see the attached chart) the wave IV is unfolding as a complex double three (ABC-X-ABC) correction with 2nd wave B ended at 1.2774, hence 2nd wave C could have ended at 1.3658.
Our preferred count on the daily chart is that cable's rebound from 1.3500 (wave (A) trough) is unfolding as a wave (B) with A ended at 1.7043, followed by triangle wave B and wave C as well as wave (B) has ended at 1.7192, the subsequent selloff is the larger degree wave (C) which is still unfolding with minor wave (III) of larger degree wave 3 ended at 1.1986, hence wave (IV) correction is in progress which could either be a triangle wave (IV) of a complex formation but upside should be limited to 1.3500 and price should falter well below 1.4000, bring another decline in wave (V) of 3 for weakness to 1.1500, then 1.1200.
Trade Idea: GBP/JPY – Stand aside
GBP/JPY - 151.50
Original strategy:
Sold at 150.00, stopped at 150.60
Position: - Short at 150.00
Target: -
Stop: - 150.60
New strategy :
Stand aside
Position: -
Target: -
Stop:-
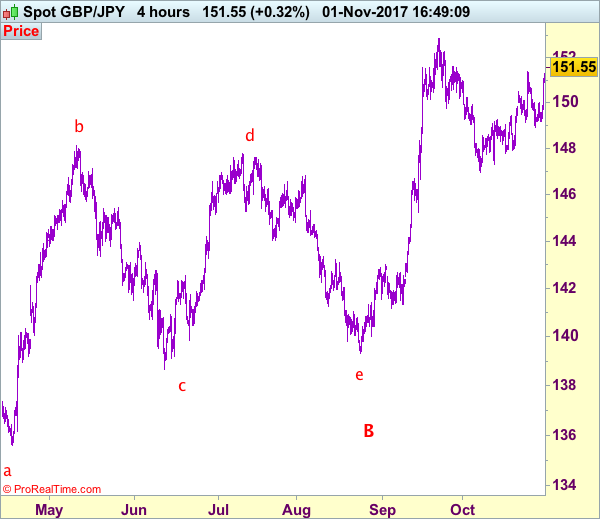
Sterling rallied after holding above support at 148.92 and broke above previous resistance at 151.40, signaling the rise from 146.95 is still in progress, hence near term upside risk remains for this move to extend further gain to 152.25-30 but break there is needed to retain bullishness and signal early upmove has resumed for retest of recent high of 152.85 which is likely to hold on first testing.
In view of this, would not chase this rise here and would be prudent to stand aside in the meantime. Below 151.00 would bring pullback to 150.50 but break of previous resistance at 150.00 is needed to suggest top is possibly formed, bring weakness to 149.15-20 but only break of support at 148.95 would confirm and revive bearishness for retracement of recent rise to 148.75, then towards 148.00-10.
Our preferred count is that larger degree wave V with circle is unfolding from 251.12 with wave (I) 219.34, (II): 241.38 and wave (III) is subdivided into 1: 192.60, 2: 215.89 (23 Jul 2008) and wave 3 ended at 118.87 earlier in 2009. The correction from there to 162.60 is wave 4 which itself is a double three and is labeled as first a-b-c ended at 151.53, followed by wave x at 139.03, 2nd a ended at 162.60, 2nd b at 146.75 and 2nd c leg of wave 4 ended at 163.00. Therefore, the decline from 163.00 to 116.85 is now treated as wave 5 which also marked the end of larger degree wave (III), hence wave (IV) major correction has commenced for retracement of the wave (III) from 241.38 and upside target at 183.95-00 (50% Fibonacci retracement of the wave (II) from 241.38) had been met, a drop below 160.00 would suggest wave (IV) has ended at 195.85, bring decline in wave (V) for initial weakness to 130 (already met) and 120.
Forex Technical Analysis: EUR/USD, USD/JPY, GBP/USD
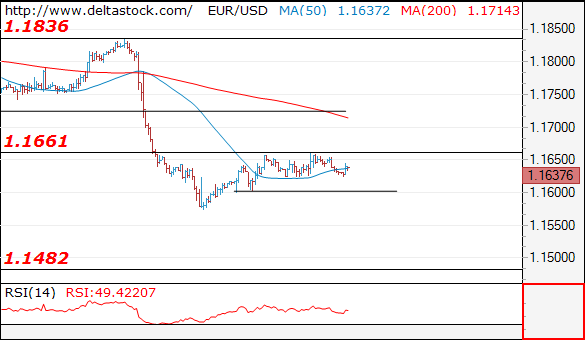
EUR/USD
Current level - 1.1637
Despite the neutral intraday bias I still favor a higher rebound, through 1.1660, to 1.1720 area. The latter is expected to cap the upside and to provoke a large scale move towards 1.1480. Key intraday support lies at 1.1600.
| Resistance | Support | ||
| intraday | intraweek | intraday | intraweek |
|
1.1660 |
1.1840 |
1.1600 |
1.1480 |
|
1.1720 |
1.1940 |
1.1480 |
1.1300 |
USD/JPY
Current level - 113.93
The rebound above 113.50 show a completion of the current slide from 114.50 and the intraday bias is positive, for another test of the mentioned peak. The whole consolidation below 114.50 is still underway, with a risk of a third leg towards 113.00 and only a clear break through 114.50 will challenge 115.50.
| Resistance | Support | ||
| intraday | intraweek | intraday | intraweek |
|
114.00 |
114.50 |
113.50 |
111.00 |
|
114.50 |
115.50 |
113.05 |
107.30 |
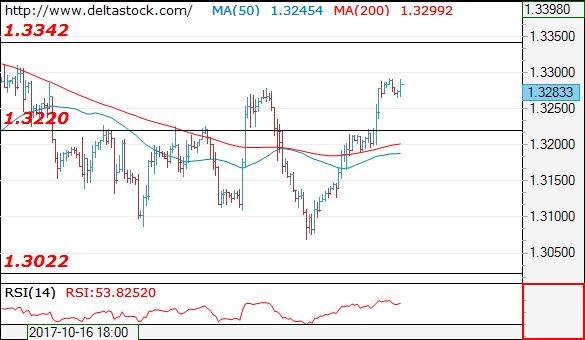
GBP/USD
Current level - 1.3283
The break through 1.3220 resistance unleashed an upmove beyond 1.3280 and the bias is still positive, with a risk of a tight test at 1.3340 resistance. Initial support lie s at 1.3260, followed by 1.3220. A violation of the latter will signal a beginning of a senior move towards 1.3020.
| Resistance | Support | ||
| intraday | intraweek | intraday | intraweek |
|
1.3300 |
1.3340 |
1.3260 |
1.3020 |
|
1.3340 |
1.3650 |
1.3220 |
1.2760 |

Trade Idea: EUR/JPY – Hold short entered at 132.70
EUR/JPY - 132.72
Original strategy:
Sold at 132.70, Target: 130.70, Stop: 133.30
Position: - Short at 132.70
Target: - 130.70
Stop: - 133.30
New strategy :
Hold short entered at 132.70, Target: 130.70, Stop: 133.30
Position: - Short at 132.70
Target: - 130.70
Stop:- 133.30
Although the single currency has risen again after brief pullback and marginal gain from here cannot be ruled out, as this move from 131.45 is viewed as retracement of the fall from 134.50, reckon upside would be limited and resistance at 132.96 should hold, bring retreat later, below 132.25-30 would bring weakness to 131.90-95 but break of latter level is needed to signal the rebound from 131.45 has ended, bring retest of this level, below there would extend the fall from 134.50 for a correction of early upmove to 131.00, then towards 130.50-60.
In view of this, we are holding on to our short position entered at 132.70. Above 133.10 would defer and suggest first leg of corrective decline from 134.50 top has ended, risk a stronger rebound to 133.50-60 but still reckon upside would be limited to 133.95-00, price should falter well below said last week’s high at 134.50, bring another selloff later.
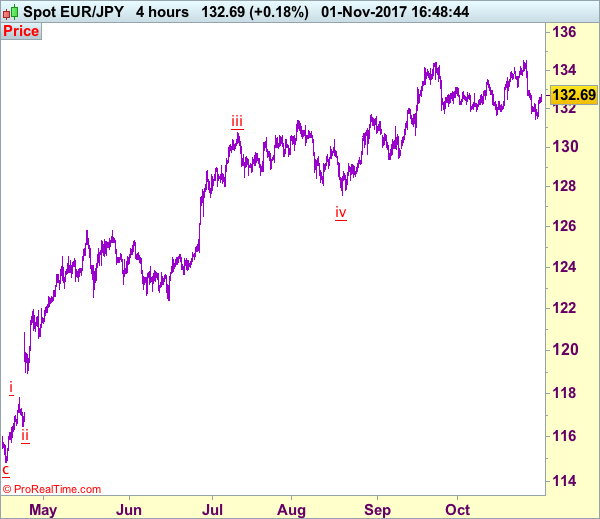
Our latest preferred count is that wave (ii) is ABC-X-ABC which ended at 123.33 and wave (iii) is unfolding with wave iii ended at 100.77, followed by wave iv at 111.57 and wave v as well as the wave (iii) has ended at 97.04, followed by wave (iv) at 111.43 and wave (v) has ended at 94.12 which is also the end of the larger degree v, this also implied the major wave (C) has also ended there, hence major correction has commenced from there with (A) leg unfolding in its lower degree wave c which has possibly ended at 145.69. Under this count, A-B-C wave (B) has commenced with A leg ended at 136.23, wave B at 143.79 and wave C has possibly ended at 149.79.
Our larger degree count is that the decline from 139.26 is wave (C) and is sub-divided into a diagonal triangle i-ii-iii-iv-v with wave i - 105.44, wave ii- 123.33, wave iii - 97.03, wave iv - 111.43, followed by the final wave v as well as the end of wave (C) at 94.12, this also mark the bottom of larger degree wave B. Under this count, major rise in wave C has commenced as an impulsive wave with minor wave III ended at 145.69, wave V is still in progress for further gain to 150.00. Having said that, this so-called wave V could well be the first leg of larger degree 5-waver wave C and this wave C should bring at least a retest of wave A top at 169.97 (July 2008).
Trade Idea: AUD/USD – Sell at 0.7720
AUD/USD – 0.7685
Original strategy:
Sell at 0.7720, Target: 0.7550, Stop: 0.7780
Position: -
Target: -
Stop:-
New strategy :
Sell at 0.7720, Target: 0.7550, Stop: 0.7780
Position: -
Target: -
Stop:-
As aussie found support at 0.7639 and has rebounded again, retaining our view that further consolidation above last week’s low at 0.7625 would be seen and another bounce to 0.7699 resistance cannot be ruled out, however, reckon 0.7720-25 would limit upside and bring another decline later, below said support at 0.7639 would bring retest of 0.7625, break there would extend recent decline from 0.8125 top to 0.7600, having said that, loss of downward momentum should prevent sharp fall below 0.7550 and reckon 0.7500 would hold from here, bring rebound later.
In view of this, we are looking to reinstate short on recovery as 0.7720-25 should limit upside and bring another decline. Above previous support at 0.7770 would defer and suggest a temporary low is possibly formed, bring rebound to 0.7800 and then towards 0.7825-35 later.
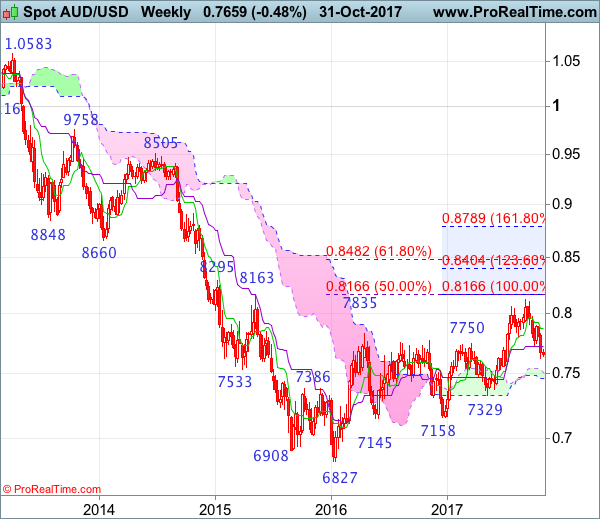
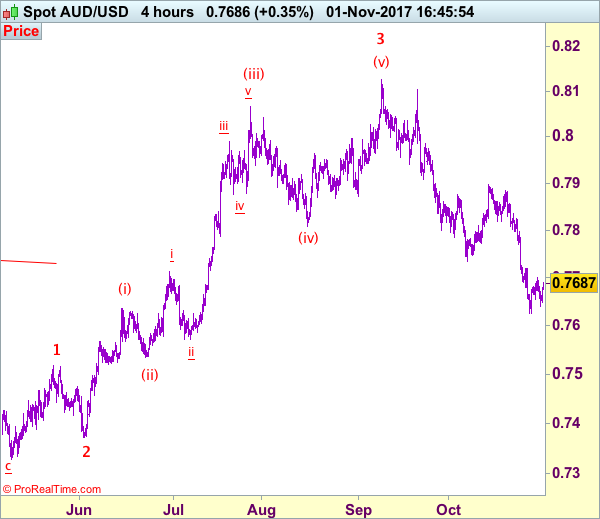
On the 4-hour chart, recent upmove from 0.7329 is unfolding as an impulsive rise with wave 3 as well as smaller degree wave (iii) extending, only minor wave v of (iii) has ended at 0.8125, hence bullishness remains for this move to extend headway to 0.8200, then towards 0.8300, however, reckon upside would be limited to 0.8400 and the final wave 5 should falter below 0.8500, bring correction later.
NZD/USD Candlesticks and Ichimoku Analysis
Weekly
• Last Candlesticks pattern: N/A
• Time of formation: N/A
• Trend bias: Up
Daily
• Last Candlesticks pattern: Shooting star
• Time of formation: 20 Sep 2017
• Trend bias: Up
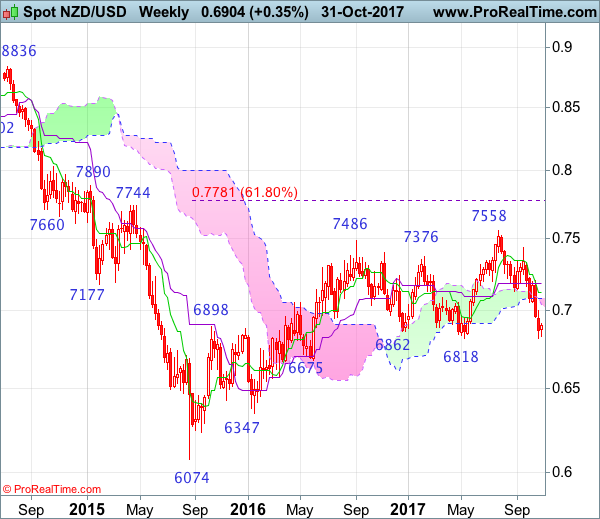
NZD/USD – 0.6915
Kiwi met renewed selling interest at 0.7206 last month and dropped sharply in line with our bearish expectation, adding credence to our bearish view that the decline from 0.7558 top is still in progress and bearishness remains for this move to bring retracement of early upmove, below support at 0.6818 would extend further decline to 0.6710-20, then 0.6675 support but a sustained breach below latter level is needed to retain bearishness and encourage for subsequent selloff towards strong support at 0.6575 which is likely to hold from here.
On the upside, whilst initial recovery to 0.7000 cannot be ruled out, reckon upside would be limited to the Kijun-Sen (now at 0.7031) and bring another decline. Only a daily close above 0.7056 (previous support now resistance) would suggest a temporary low is possibly formed, bring a stronger rebound to 0.7090-00 but still reckon upside would be limited to 0.7150-55 and price should falter well below said resistance at 0.7206, bring another selloff later this month.
Recommendation: Sell again at 0.7030 for 0.6830 with stop above 0.7130.
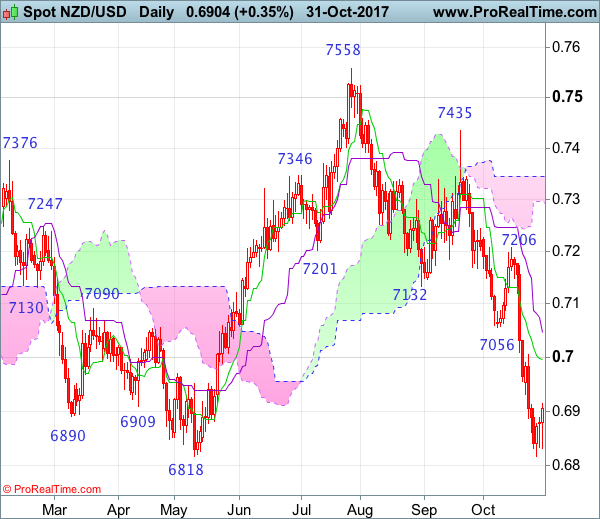
On the weekly chart, despite falling to 0.6818 again, as kiwi has recovered after failing to penetrate this support, suggesting minor consolidation above said support would be seen and corrective bounce to 0.7000 cannot be ruled out, reckon upside would be limited to the lower Kumo (now at 0.7043) and bring another decline. A break of said strong support at 0.6818 would add credence to our bearish view that the fall from 0.7558 top is still in progress for further weakness to 0.6700, then 0.6675, only a break below strong support at 0.6575 would signal the rise from 0.6074 low has ended.
On the upside, expect recovery to be limited to last week’s high at 0.7004 and the lower Kumo (now at 0.7043) should hold, bring another decline. Above the Tenkan-Sen (now at 0.7127) would defer and risk a stronger rebound to the Kijun-sen (now at 0.7188) but resistance at 0.7206) should remain intact, bring another decline later. Only a break of 0.7206 resistance would defer and suggest low is possibly formed instead, bring further gain to 0.7245-50 and possibly towards 0.7325-30 but price should falter well below resistance at 0.7435.
AUDUSD Holds Bearish Outlook Under 200-Day MA
AUDUSD is under pressure below its 200-day moving average. The market has been reversing the May to September uptrend, retracing over half of this move. The drop below the 50% Fibonacci level of the 0.7328 to 0.8124 upleg last week has strengthened the short-term bearish bias.
The market is now consolidating just above Friday’s low of 0.7624 and near the 61.8% Fibonacci level. This is expected to provide support in the near term, while prices are capped by the 200-day MA at 0.7691. The bounce on Friday failed to break above the 200-day MA resistance and left the AUDUSD pair neutral since the drop below it on October 26.
Downside momentum stalled as seen by RSI reaching oversold levels near 30, pointing to more sideways trading in the near term. A move above the 50% Fibonacci (0.7725) opens up AUDUSD for more gains to 0.7900. Only a rise above this key level would indicate that the short-term bearish phase has ended and increase the odds to break 0.8000 and re-test the 0.8124 peak.
The outlook for AUDUSD remains bearish below the 200-day MA and another leg lower towards 0.7525 and 0.7328 cannot be ruled out.
US Dollar Awaits Barrage Of Key Risk Events, Kiwi Soars On Strong Employment Numbers
The dollar was little changed ahead of a very heavy calendar the next three days, while the kiwi staged an impressive rebound following the release of strong employment numbers out of New Zealand overnight.
The US dollar was definitely going to be in focus for the rest of the week due to the Fed meeting that ends later today, the announcement of the Fed Chair nominee by President Trump tomorrow and the October employment report to be released on Friday. Starting with the Fed meeting, it is expected to give a signal that a December hike is a very strong possibility and it is even possible that certain Fed voters might dissent and ask for an immediate hike, which could boost the greenback further. A terrorist attack in New York that left 8 people dead did not have much market impact although it was the deadliest attack in the city since 2001.
The dollar managed to post strong gains against the yen as it moved towards challenging the 114 level once more and was last at 113.92. However, against the euro and the pound it was struggling to make headway as the euro managed to rise to 1.1647 in early European trading on Wednesday and the pound crossed above the 1.33 threshold to 1.3307.
The pound seems to be boosted by signs that Brexit talks are getting down to serious business, while the Bank of England is expected to hike rates tomorrow. The euro from its part is benefitting from the fact that the Catalan independence crisis seems to have been dealt for now and that Eurozone growth is strong despite inflation remaining contained.
In New Zealand, a very strong set of employment numbers helped the kiwi recover from its recent depressed levels, which were the result of worries about the incoming government’s economic and immigration policies. The unemployment rate fell to a low 4.6% in the third quarter compared to 4.8% during the second quarter, while the participation rate climbed to 71.1% from 70%. Signs of a strong economy could provide some relief from the political woes that the kiwi is suffering from. The kiwi climbed above the 69 cent level to 0.6918, having traded not far from the 0.68 mark the previous day.
In other currencies, the loonie appeared to stabilize just below the 1.29 level, after the US dollar’s rally on Tuesday against the Canadian currency following a surprise contraction in monthly Canadian GDP during August. The Governor of the Bank of Canada also appeared cautious not to give a hawkish view in a speech the previous day.
Looking ahead, the Fed meeting statement during late US trading eclipses all other events on Wednesday. October manufacturing ISM out of the US will also be watched as will the ADP employment numbers, which are sometimes seen as a precursor to the nonfarm payrolls (due on Friday). It will be relatively quiet during today’s European trading, with the only data point of note scheduled being the UK’s manufacturing PMI.
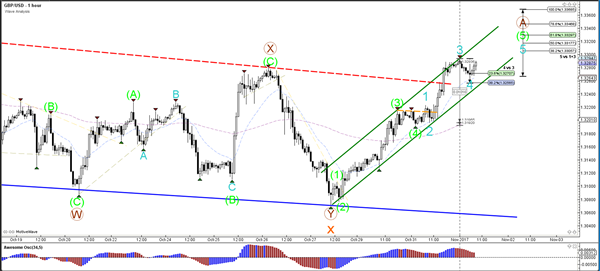
Daily Wave Analysis: GBP/USD Breaks Resistance Channel With Sturdy Bullish Momentum
Currency pair GBP/USD
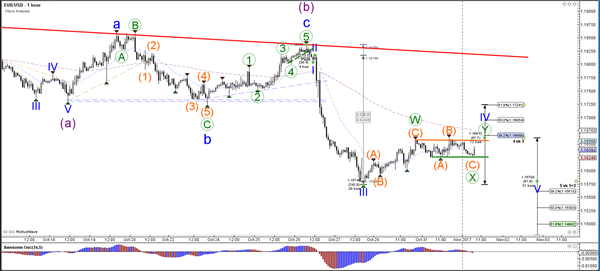
The GBP/USD break above the resistance trend line (dotted red) of the channel and has built a larger correction at the larger support trend lines (blue). A break above the 61.8% Fibonacci level invalidates the bearish wave pattern and indicates that more upside is likely.
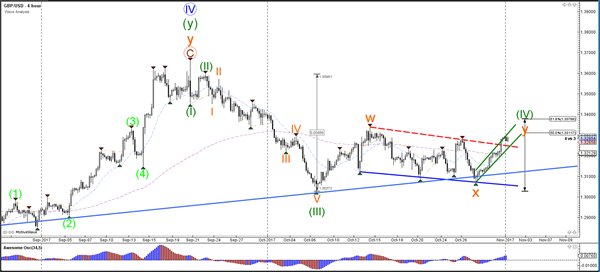
The GBP/USD is showing strong bullish momentum and is building a neat channel to the upside. Price could face sturdy resistance at the Fib levels of the 4 hour chart.
Currency pair EUR/USD
The EUR/USD is still building a bullish retracement within wave 4 (blue). A break below the support of the sideways zone (green) could indicate the continuation of the wave 5 (blue) within a larger wave C (purple).
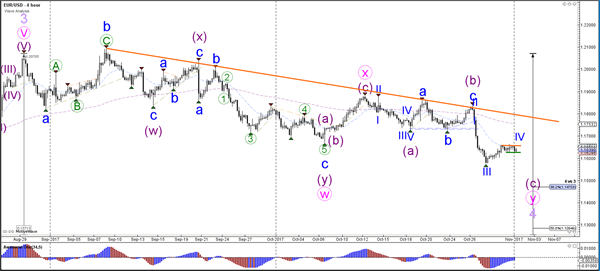
The EUR/USD will most likely complete the wave 4 (blue) if price breaks below the channel (green). In the meantime price could retrace to deeper Fibonacci levels of wave 4 (blue) but typically should not break above the 61.8% Fibonacci level.
Currency pair USD/JPY
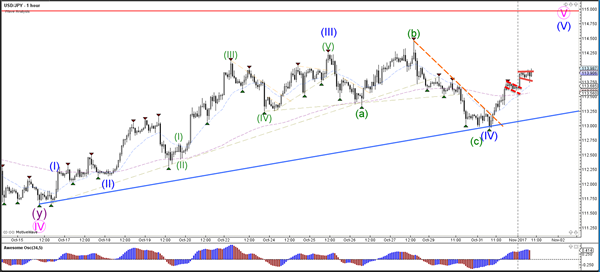
The USD/JPY strong bullish bounce is most likely indicating that one more bullish push is likely towards the 115-resistance level.
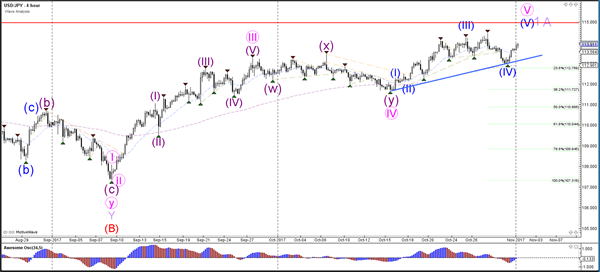
The USD/JPY broke above the resistance trend line (dotted orange) and then broke above the small bull flag chart pattern (dotted red). Price could continue higher if it breaks the next pattern
AUD/USD Candlesticks and Ichimoku Analysis
Weekly
• Last Candlesticks pattern: Long white candlestick
• Time of formation: 10 Jul 2017
• Trend bias: Up
Daily
• Last Candlesticks pattern: Long white candlestick
• Time of formation: 18 Jul 2017
• Trend bias: Up
Aussie has dropped again since late last week, justifying our bearish view and the breach of previous support at 0.7733 confirms recent fall from 0.8125 top has resumed, indicated downside target at 0.7680 was met (with 200 points profit), although this move may extend weakness to 0.7600, as this move is still viewed as retracement of early upmove, reckon downside would be limited to 0.7570-75 and support at 0.7535-40 would remain intact due to oversold condition, risk from there has increased for a rebound later.
On the upside, whilst initial recovery from 0.7625 may bring corrective bounce to the Tenkan-Sen (now at 0.7752), reckon upside would be limited to 0.7800 and previous support at 0.7819 should hold and bring another decline later. Only break of indicated resistance at 0.7897 would abort and signal low is formed instead, bring a stronger rebound to 0.7915-20, then towards 0.7970-75, however, still reckon upside would be limited to 0.8000 and price should falter below resistance at 0.8103, bring another decline later.
Recommendation: Short entered at 0.7880 met target at 0.7680 with 200 points profit
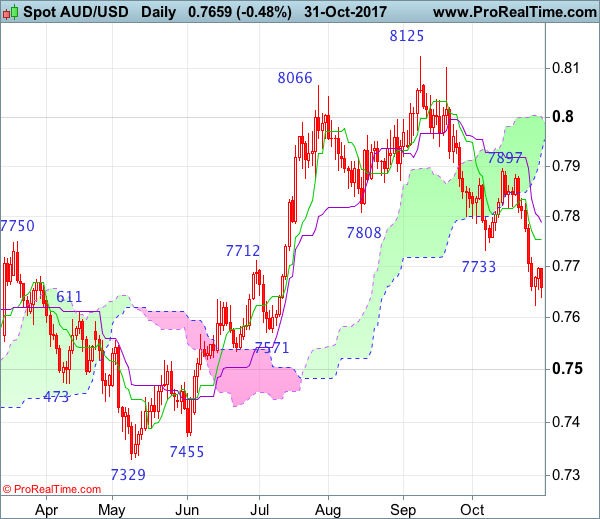
On the weekly chart, last week’s anticipated selloff formed another black candlestick and indicated support at 0.7733 was penetrated, adding credence to our view that top has been formed at 0.8125, hence consolidation with downside bias remains for weakness to 0.7570-75, then towards support at 0.7535, however, near term oversold condition should limit downside to the lower Kumo (now at 0.7462) and reckon support at 0.7372 would hold from here.
On the upside, although initial recovery back to previous support at 0.7733 cannot be ruled out, reckon upside would be limited to 0.7830-35 and price should falter well below the Tenkan-Sen (now at 0.7875), bring another decline later. A weekly close above resistance at 0.7897 would abort and signal low is formed instead, bring a stronger rebound to 0.7950-60 and possibly towards 0.8000 but upside would still be limited and 0.8103 resistance should remain intact, bring another decline later.