
Sample Category Title
GBP/JPY Daily Outlook
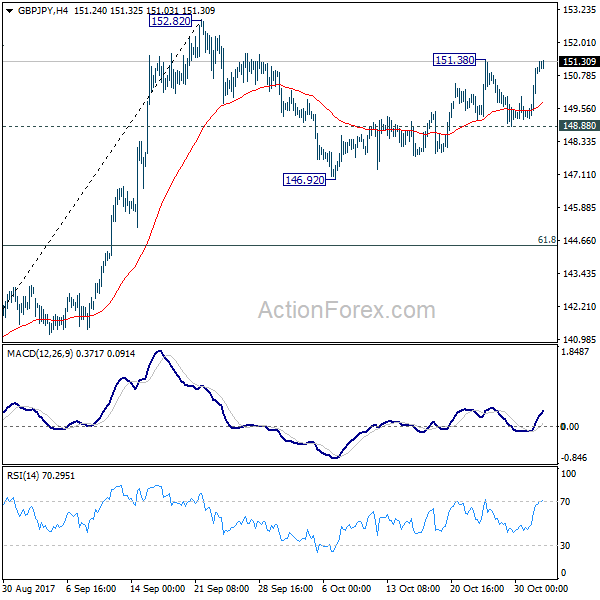
Daily Pivots: (S1) 149.72; (P) 150.39; (R1) 151.60; More
GBP/JPY recovers after drawing support from 4 hour 55 EMA. Intraday bias is turned neutral first. Above 151.38 will target 152.82 high. Decisive break there will confirm medium term rally resumption. On the downside, below 148.88 support will extend the consolidation from 152.82 with another fall. But downside should be contained by 61.8% retracement of 139.29 to 152.82 at 144.45 and bring rebound.
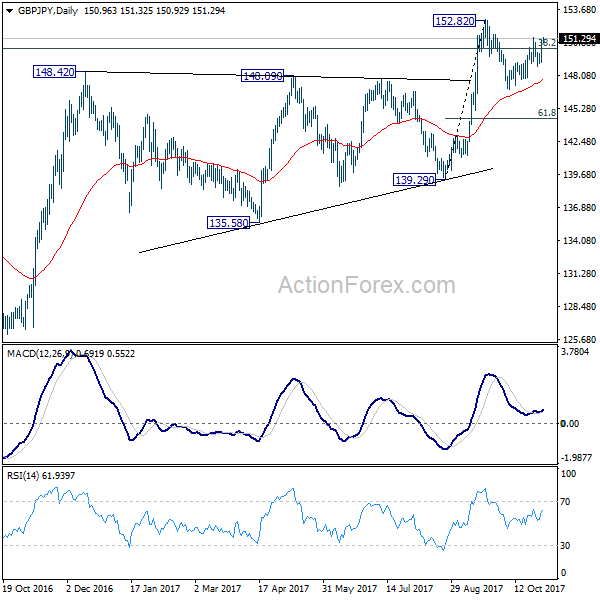
In the bigger picture, medium term rebound from 122.36 is still expected to resume after corrective pull back from 152.82 completes. Firm break of 38.2% retracement of 196.85 to 122.36 at 150.43 will carry long term bullish implications. In that case, GBP/JPY could target 61.8% retracement at 167.78. However, break of 139.29 will indicate rejection from 150.43 key fibonacci level. And the three wave corrective structure of rebound from 122.36 will argue that larger down trend is resuming for a new low below 122.26.
EUR/JPY Daily Outlook
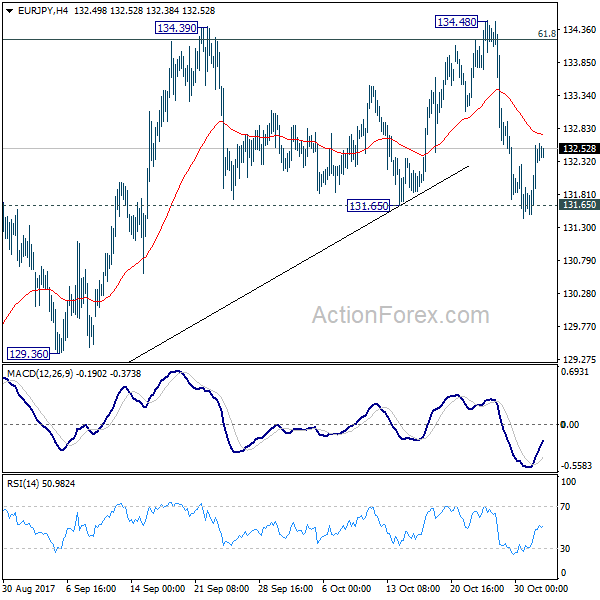
Daily Pivots: (S1) 131.70; (P) 132.13; (R1) 132.76; More....
EUR/JPY recovers after breaching 131.65 key support briefing. Intraday bias remains neutral first. on the downside, decisive break of 131.65 will confirm rejection from 134.20 fibonacci level. That will also complete and double top pattern (134.39, 134.48) and confirms near term reversal. 55 day EMA will also be firmly taken out. In that case, deeper decline should be seen back to 127.55 key support. On the upside, decisive break of 134.39/48 resistance zone is needed to confirm up trend resumption. Otherwise, even in case of rebound, near term outlook is neutral at best.
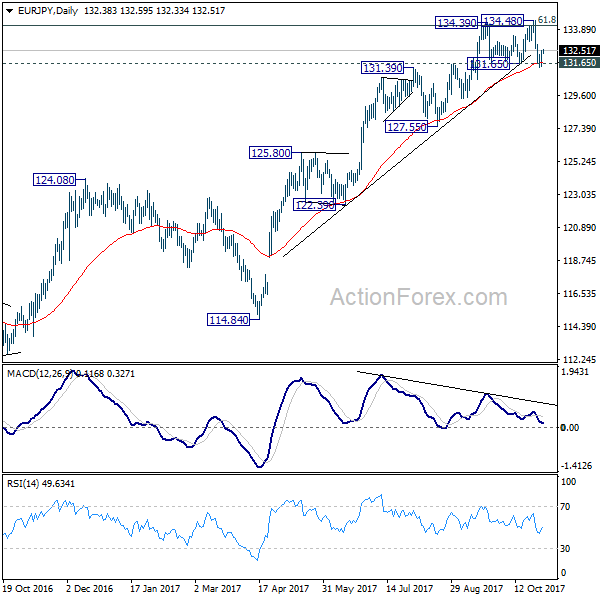
In the bigger picture, medium term rise from 109.03 (2016 low) is seen as at the same degree as the down trend from 149.76 (2014 high) to 109.03 (2016 low). 61.8% retracement of 149.76 to 109.03 at 134.20 is already met. Sustained break there will pave the way to key long term resistance zone at 141.04/149.76. However, break of 127.55 support will argue that the medium term trend has reversed and will turn outlook bearish for deeper fall back to 114.84/124.08 support zone at least.
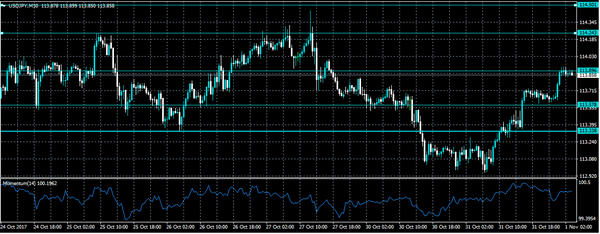
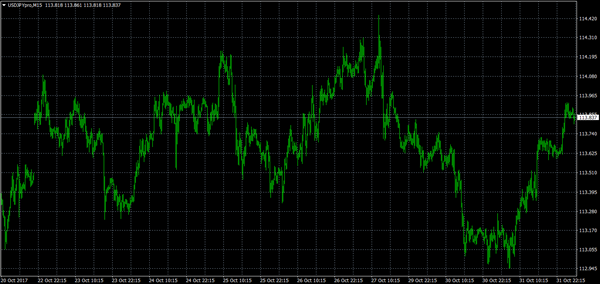
USDJPY Strongly Bullish ABove 113.90
The U.S dollar has rebounded sharply higher against the Japanese Yen, hitting 113.93 during the Asian trading session. The USDJPY pair currently trades close to highs of the day, as rising Japanese stocks and better than expected company earnings boost risk-on sentiment in financial markets. Traders now await the release of the U.S ADP jobs report and the ISM manufacturing PMI for the month of October.
The USDJPY pair is strongly bullish on an intraday basis while trading above the 113.90 technical level. Further upside towards 114.24 and 114.50 remain likely while above this key level.
A failure below the 113.90 level, will likely lead to an immediate decline towards the 113.70 and 113.57 support levels for the USDJPY pair.
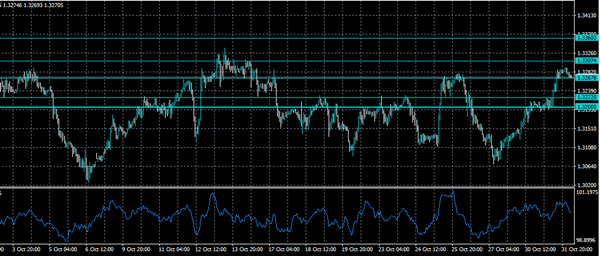
GBPUSD Strongly Bullish Above 1.3267
The British pound has risen sharply higher against the U.S dollar, hitting 1.3293, during today's Asian trading session. The GBPUSD pair is currently consolidating around the 1.3270 level, as broad-based strength in the British pound is being underpinned by a probable rate hike from the Bank of England tomorrow. GBPUSD traders now await the upcoming release of the United Kingdom's Manufacturing PMI, for the month of October.
The GBPUSD pair is strongly bullish on an intraday basis while trading above the 1.3267 technical. Further buying above this level should be expected towards 1.3307 and 1.3360.
Should the GBPUSD pair decline below the 1.3267 technical level for a sustained period, sellers will likely push price-action back towards the 1.3222 and 1.3200 levels.
Wednesday Is Fed Day
One of the month's most highly anticipated events will take place on Wednesday, as the Federal Reserve unveils its latest policy decision. Although no change in policy is expected, the official statement may reveal clues about the likelihood of a December rate hike. For the vast majority of traders, a December liftoff is a foregone conclusion, according to the CME Group's 30-day Fed Fund Futures prices.
PMI data courtesy of IHS Markit will make headlines beginning at 09:00 GMT with reports on Greek and UK manufacturing sectors. Very little changes are expected on either front.
In terms of monetary policy, the Bank of England's Sir Jon Cunliffe is scheduled to deliver a speech at 10:00 GMT, one day after the central bank is expected to raise interest rates.
The North American session begins with ADP's monthly employment report, which covers US private sector job creation. Private-sector employment is forecast to grow by 200,000 for October, following a gain of 135,000 the previous month.
Markit and the Institute for Supply Management (ISM) will also report on US manufacturing PMI between 13:45 GMT and 14:00 GMT.
Reports on construction spending and crude stockpiles will also influence investor sentiment on Wednesday.
Earlier in the day, Markit reported the final Nikkei Japanese manufacturing PMI for October. The reading of 52.8 was higher than forecasts.
Meanwhile, the Caixin China manufacturing PMI was unchanged at 51.
The Fed will conclude its policy meeting Wednesday afternoon, with an official rate statement scheduled for 18:00 GMT.
USD/JPY
The USDJPY returned to strength on Tuesday, as markets favoured the greenback ahead of this week's FOMC decision. The USD/JPY is currently trading around 113.85, having gained 0.2% from the previous close. The pair is in a firm uptrend extending back three weeks, but faces a major hurdle around the psychological 114.00 handle. Prices surged above that handle last week before retracing all the way back down to the low 113.00s. The 31 October low of 112.96 provides immediate support.
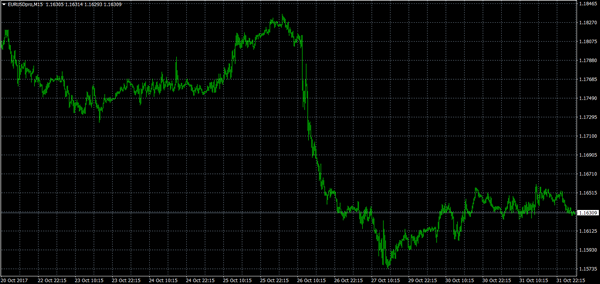
EUR/USD
Europe's common currency was little changed on Tuesday, as investors continued to evaluate the fallout from Catalonia's independence movement. The EUR/USD exchange rate continues to trade in the low-to-mid 1.16 region. Prices were last down 0.1% at 1.1630. Immediate resistance is located at 1.1660. On the opposite side of the spectrum, the pair is likely to find support at 1.1590.
USD/CAD
The Bank of Canada's dovish posturing last week has driven a nail into the loonie. The USD/CAD extended its uptrend on Tuesday, hitting 1.2900 for the second time in three sessions. The USD/CAD is currently trading near three-month highs, with the pair eyeing further gains in the wake of the Fed announcement later in the day.
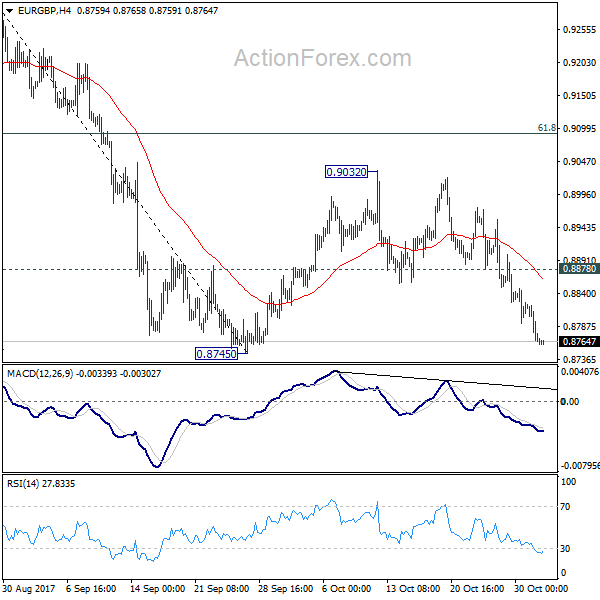
EUR/GBP Daily Outlook
Daily Pivots: (S1) 0.8747; (P) 0.8785; (R1) 0.8804; More...
Intraday bias in EUR/GBP remains mildly on the downside for 0.8745 support. Break will resume whole fall from 0.9305 and target 0.8303 key support level. On the upside, above 0.8878 minor resistance will extend the corrective pattern from 0.8745 with another rise. But upside should be limited by 61.8% retracement of 0.9305 to 0.8745 at 0.9091 to bring fall resumption eventually.
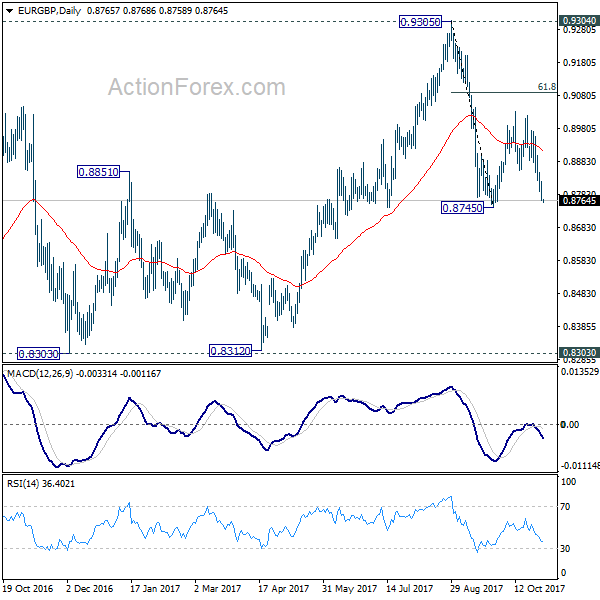
In the bigger picture, there are various ways to interpret price actions from 0.9304 high. But after all, firm break of 0.9304/5 is needed to confirm up trend resumption. Otherwise, range trading will continue with risk of another fall. And in that case, EUR/GBP could have a retest on 0.8303. But we'd expect strong support from 0.8116 cluster support (50% retracement of 0.6935 to 0.9304 at 0.8120) to contain downside.
New Zealand Dollar Sellers In Driver’s Seat Vs USD
Key Highlights
- The New Zealand Dollar made a downside move from the 0.7200 swing high against the US Dollar.
- There is a major bearish trend line forming with resistance at 0.6900-0.6920 on the 4-hours chart of NZD/USD.
- New Zealand's Employment Change in Q3 2017 was 2.2%, compared with the forecast of 0.8%.
- Today in the US, the Fed Interest rate decision is scheduled and the central bank is likely to keep rates at 1.25%.
NZDUSD Technical Analysis
The New Zealand Dollar started a crucial downtrend from the 0.7200 swing high against the US Dollar. The NZD/USD pair is currently well below 0.6920 and looks set to extend declines.
During the recent slide, the pair broke the 0.7060 and 0.6900 support levels and traded as low as 0.6818. The pair is currently attempting a recovery, but facing sellers near the 38.2% Fib retracement level of the last decline from the 0.7003 high to 0.6818 low.
Moreover, there is a major bearish trend line forming with resistance at 0.6900-0.6920 on the 4-hours chart. Any major corrections from the current levels are likely to face hurdles near 0.6900 and 0.6920 in the near term.
On the downside, a break of the 0.6818 low would ignite further losses below 0.6800.
New Zealand Employment Change and Unemployment
Earlier today, the New Zealand Employment Change figure for Q3 2017 was released by the Statistics New Zealand. The forecast was lined up for a change of 0.8% in Q3 2017 compared with the last -0.2%.
The actual result was better than the forecast, as the New Zealand Employment Change in Q3 2017 was 2.2%. Looking at the Unemployment Rate, the market was looking for a decline from 4.8% to 4.7% in Q3 2017. However, the actual was again better, as there was a decline to 4.6%.
The report added that:
In the September 2017 quarter, the seasonally adjusted unemployment rate fell to 4.6 percent (down 0.2 percentage points from the June quarter), the lowest unemployment rate since the December 2008 quarter.
Overall, the NZD/USD pair might correct towards 0.6920, but most likely to face sellers on the upside.
Economic Releases to Watch Today
UK's Manufacturing PMI for Oct 2017 – Forecast 55.8, versus 55.9 previous.
US Manufacturing PMI for Oct 2017 – Forecast 54.5, versus 54.5 previous.
US ADP Employment Change Oct 2017 – Forecast 200K, versus 135K previous.
US ISM Manufacturing Index for Oct 2017 – Forecast 59.5, versus 60.8 previous.
Fed Interest Rate Decision – Forecast 1.25%, versus 1.25% previous.
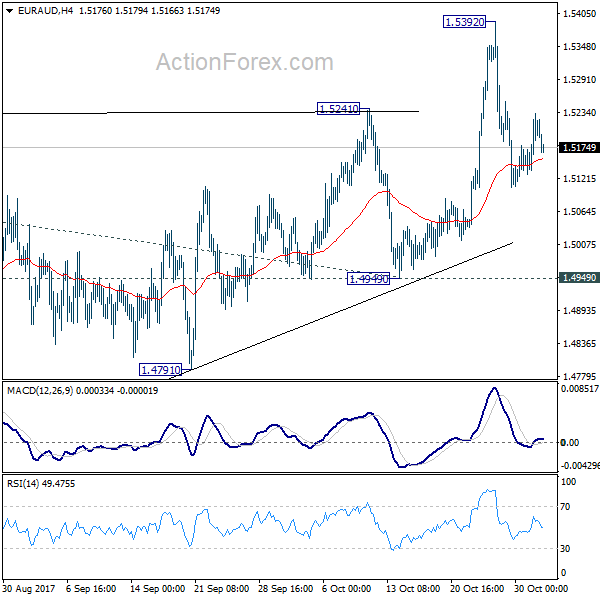
EUR/AUD Daily Outlook
Daily Pivots: (S1) 1.5148; (P) 1.5190; (R1) 1.5252; More....
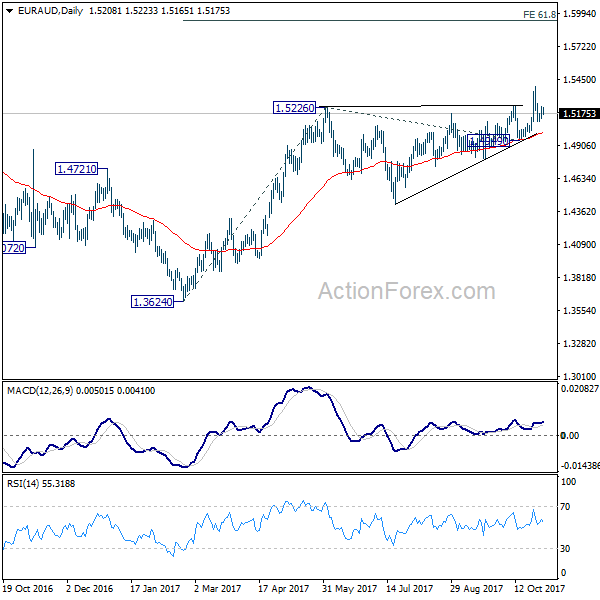
EUR/AUD is staying in consolidation below 1.5392 and intraday bias remains neutral at this point. Again, as long as 1.4949 support holds, outlook remains bullish. Medium term rally from 1.3624 is in favor to continue. On the upside, break of 1.5392 will resume medium term rise from 1.3624 and target 61.8% projection of 1.3624 to 1.5226 from 1.4949 at 1.5939 first. However, decisive break of 1.4949 will carry larger bearish implication and turn bias to the downside.
In the bigger picture, we're holding on to the view that corrective decline from 1.6587 medium term top has completed at 1.3624. Rise from 1.3624 is expected to extend to retest 1.6587. However, break of 1.4949 support will dampen our view and argue that rise from 1.3624 has completed. In that case, EUR/AUD would turn southward for retesting 1.3624 low.
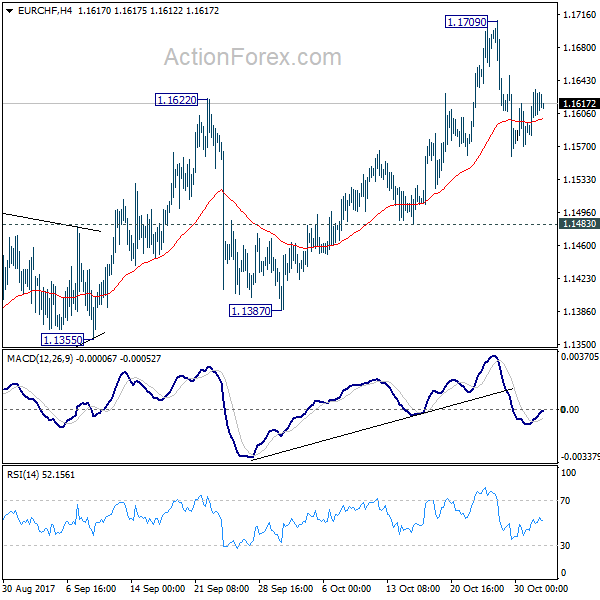
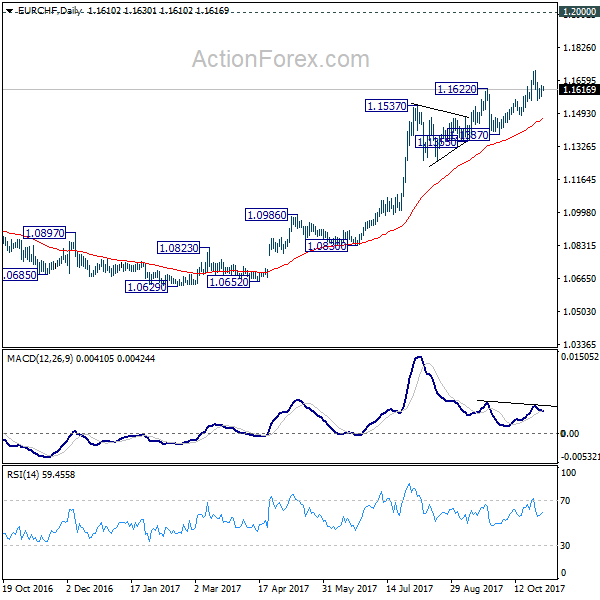
EUR/CHF Daily Outlook
Daily Pivots: (S1) 1.1588; (P) 1.1610; (R1) 1.1640; More...
Intraday bias in EUR/CHF remains neutral for consolidation below 1.1709. Deeper pull back cannot be ruled out. But still, as long as 1.1483 minor support holds, outlook remains bullish and we'd expect further rally ahead. Break of 1.1709 will target 1.2 key level. However, break of 1.1483 will be an early sign of reversal. In that case, deeper decline should be seen back to 1.1355 support. .
In the bigger picture, long term rise from SNB spike low back in 2015 is still in progress. EUR/CHF should now be heading back to prior SNB imposed floor at 1.2000. For now, this will be the favored case as long as 1.1355 support holds. However, break of 1.1355 will indicate medium term topping. In that case, EUR/CHF should head back to 55 week EMA (now at 1.1067) and possibly below.
Australia’s Manufacturing Sector Growth Slowed In October
For the 24 hours to 23:00 GMT, the AUD declined 0.46% against the USD and closed at 0.7654.
LME Copper prices declined 0.3% or $21.0/MT to $6802.0/MT. Aluminium prices fell 0.1% or $3.0/MT to $2140.0/MT.
Overnight data revealed that Australia's AiG performance of manufacturing index eased to 51.1 in October from a level of 54.2 in the previous month. The decline in the sector was due to a surge in energy costs, a higher Australian Dollar and closures in the automotive industry.
Earlier today, in China, Australia's largest trading partner, the Caixin manufacturing PMI remained flat at 51.0 for October, meeting market expectations, thus indicating a stable pace of expansion in the sector.
In the Asian session, at GMT0400, the pair is trading at 0.7666, with the AUD trading 0.16% higher from yesterday's close.
The pair is expected to find support at 0.7640, and a fall through could take it to the next support level of 0.7613. The pair is expected to find its first resistance at 0.7693, and a rise through could take it to the next resistance level of 0.7719.
Investors will now await the release of Australia's trade balance and building permits data, both for September, due overnight.
The currency pair is trading between its 20 Hr and 50 Hr moving averages.
